| Issue |
A&A
Volume 693, January 2025
|
|
|---|---|---|
| Article Number | A47 | |
| Number of page(s) | 12 | |
| Section | Planets, planetary systems, and small bodies | |
| DOI | https://doi.org/10.1051/0004-6361/202451399 | |
| Published online | 03 January 2025 | |
Assessing the processes behind planet engulfment and its imprints
1
Departamento de Física e Astronomia, Faculdade de Ciências, Universidade do Porto, Rua do Campo Alegre s/n,
4169–007
Porto,
Portugal
2
Instituto de Astrofísica e Ciências do Espaço, Centro de Astrofísica da Universidade do Porto, Rua das Estrelas
4150-762
Porto,
Portugal
3
Institute of Physics, University of Bern,
Gesellschaftsstrasse 6,
3012
Bern,
Switzerland
4
LUPM, Université de Montpellier, CNRS,
Place Eugène Bataillon,
34095
Montpellier,
France
5
Institute for Particle Physics and Astrophysics, ETH Zürich,
Otto-Stern-Weg 5,
8093
Zürich,
Switzerland
★ Corresponding author; This email address is being protected from spambots. You need JavaScript enabled to view it.
Received:
5
July
2024
Accepted:
13
November
2024
Abstract
Context. Newly formed stars are surrounded by a protoplanetary disc composed of gas and dust, part of which ends up forming planets. During the system’s evolution, some of the planetary material may end up falling into the host star and being engulfed by it, leading to potential variation in the stellar composition.
Aims. The present study explores how planet engulfment may impact the chemical composition of the stellar surface and discusses what the rate of events with an observable imprint would be for Sun-like stars.
Methods. We used data on the formation and evolution of 1000 planetary systems from the New Generation Planetary Population Synthesis (NGPPS) calculations by the Generation III Bern model to analyse the conditions under which planet engulfment may occur. Additionally, we used stellar models computed with Cesam2k20 (Code d’Evolution Stellaire Adaptatif et Modulaire) to account for how the stellar internal structure and its processes may affect the dilution of the signal caused by planet engulfment.
Results. Our results show that there are three different phases associated with different mechanisms under which engulfment events may happen. Moreover, systems that undergo planet engulfment are more likely to come from protoplanetary discs that are more massive and more metal-rich than non-engulfing systems. Engulfment events leading to an observable signal happen after the dissipation of the protoplanetary disc when the convective envelope of the stars becomes thinner. With the stellar convective layer shrinking as the star evolves in the main sequence, they display a higher variation of chemical composition. This variation also correlates with the amount of engulfed material. By accounting for the physical processes happening in the stellar interior and in the optimistic case of being able to detect variations above 0.02 dex in the stellar composition, we find an engulfment rate no higher than 20% for Sun-like stars that may reveal detectable traces of planet engulfment.
Conclusions. Engulfment events that lead to observable variation in the stellar composition are rare due to the specific conditions required to result in such signatures.
Key words: planets and satellites: formation / planets and satellites: terrestrial planets / stars: abundances / planetary systems / stars: solar-type
© The Authors 2025
 Open Access article, published by EDP Sciences, under the terms of the Creative Commons Attribution License (https://creativecommons.org/licenses/by/4.0), which permits unrestricted use, distribution, and reproduction in any medium, provided the original work is properly cited.
This article is published in open access under the Subscribe to Open model. This email address is being protected from spambots. You need JavaScript enabled to view it. to support open access publication.
1 Introduction
There is a rich variety among the more than 5700 exoplanets1 detected, and they can range from super-Mercuries (e.g. Azevedo Silva et al. 2022) to hot Jupiters (e.g. Grunblatt et al. 2022) and even deformed planets (Barros et al. 2022). The diversity of the exoplanet population challenges our understanding of the formation and evolution of planetary systems.
Given that stars and planets form from the same initial gas and dust cloud, it is common to assume that the composition of planet building blocks should be related to the composition of the stellar atmosphere (e.g. Asplund et al. 2009). The wide range of stellar compositions (e.g. Adibekyan et al. 2012) is believed to be reflected in the composition of rocky planets (e.g. Santos et al. 2017), directly affecting the bulk densities of planets. In particular, the correlation between the composition of planet building blocks and the stellar atmosphere is valid for refractory elements (Bond et al. 2010; Thiabaud et al. 2014; Bonsor et al. 2021). As a matter of fact, it has been shown that knowledge of the relative abundances of refractory major rock-forming elements such as Fe, Mg, and Si contributes to the improvement of interior estimates for telluric planets (Dorn et al. 2015; Unterborn et al. 2016). Although the composition of terrestrial planets and their host stars was always assumed to correlate through a 1-to-1 linear relation, Adibekyan et al. (2021) recently demonstrated that this assumption is not valid.
Through the in-falling of planets and their subsequent absorption into their host star, the evolution of planets can have a measurable impact in the stellar surface chemical composition. The pioneering work of Gonzalez (1997) initiated the search for signatures of planet formation and engulfment in the composition of solar-like stars, resulting, however, in contradictory results (Pinsonneault et al. 2001; Ramírez et al. 2009, 2010; González Hernández et al. 2010, 2011, 2013, Adibekyan et al. 2017, Liu et al. 2021).
The work by Meléndez et al. (2009) has shown an anomaly in the solar chemical composition when compared to other solar twins, which they interpreted as being due to a deficit in refractories relative to volatiles. Alternatively, Cowley & Yüce (2022) explore the option of the Sun being instead enhanced in volatiles, but they find that the best-quality dataset does not support this hypothesis. To explain this anomaly, Meléndez et al. (2009) suggested that the observed depletion in refractory elements is a marker of planet formation, since the formation and retention of solid planetary material leads to the star accreting disc material depleted in certain heavy elements. However, Booth & Owen (2020) argue that this deficit does not come from retention of refractory material inside planets. Instead, it is likely to appear from gaps in the protoplanetary disc due to the formation of Jupiter analogues and consequent trapping of dust outside of their orbits, which prevents it from being accreted into the host star. They find that the forming giant planets can create refractory depletion of ~5–15%, with initial conditions favouring giant planet formation leading to the larger values of refractory depletion. In their review paper, Adibekyan et al. (2017) present two alternative scenarios that could explain this irregularity in the solar chemical composition. The chemical anomaly could either just reflect the galactic chemical evolution and be related to the stellar age (Adibekyan et al. 2014), or it could be due to the fact that the Sun formed in a dense stellar environment, in a very massive open cluster (Önehag et al. 2014).
The difference in chemical composition could, however, be seen in another perspective. Instead of the Sun being depleted in refractories relative to volatiles, it could be the solar twins being enriched in refractory elements (e.g. Spina et al. 2014, 2015). Smith et al. (2001) and Schuler et al. (2011) proposed that the accretion of metal-rich planetary material onto the star can result in an enhancement in heavy elements of the stellar surface composition through the in-fall of solid planets or minor bodies; that is, planet engulfment (Ramírez et al. 2011; Spina et al. 2015; Church et al. 2020). Therefore, it is not easy to ascertain the physical reason behind the differences in the chemical composition of solar-like stars and the Sun.
Binary stars are the best laboratories in which to test the impact of planet engulfment on the host star composition, as stars from binary systems are formed from the same molecular cloud, and thus should possess similar chemical compositions (Adibekyan et al. 2018). This has been done on an individual system basis, for binaries where one of the pairs has a planetary companion. There are many contradictory results, and while some reveal the planet-hosting binary component showing a significant enhancement in elemental refractory abundances (e.g. Saffe et al. 2017; Oh et al. 2018; Ramírez et al. 2019; Nagar et al. 2020), others find no such difference (see e.g. Liu et al. 2014; Saffe et al. 2015; Mack et al. 2016). For the cases in which there is a refractory enhancement in the chemical composition, the authors attribute these differences in abundances of 0.1–0.2 dex to the consequences of planet engulfment. Nonetheless, Deal et al. (2015), Ramírez et al. (2019), and Liu et al. (2021) argue that offsets observed in binary systems could be due to atomic diffusion and its consequences. Furthermore, both find a weak correlation between binary separation and chemical abundance differences. This result was recently explored by Behmard et al. (2023a,b), who find that differences in abundances for stars within a wide binary may be primordial, since large projected separations can exceed the typical turbulence scales in molecular clouds, and thus have no connection to the presence of planets.
Variation in stellar composition due to planet engulfment was once more brought up in a recent work by Spina et al. (2021) (hereinafter referred to as SP21), who analysed a sample of 107 binaries composed of pairs of Sun-like stars, and reported how the binaries components had different compositions. The authors attribute this difference to the engulfment of terrestrial material into one of the binary components, and claim an engulfment rate of ~20–35% for their sample. Moreover, SP21 suggest that the engulfment should have occurred after the disc dissipation, as otherwise the impact of the engulfment event would mostly disappear due to the large size of the convective zone of the star.
Nevertheless, Behmard et al. (2023a,b) suggest that planet engulfment signatures are difficult to detect in solar-like stars. Thermohaline mixing and gravitational settling (Théado et al. 2009; Vauclair & Théado 2012; Deal et al. 2015) weaken engulfment signatures, leading to a signal observable only up to ~2 Gyr after the engulfment event, depending on the mass, temperature, and metallicity of the star. Behmard et al. conclude that engulfment is hard to detect in systems that are several gigayears old, and argue that the true engulfment rate announced by SP21 is closer to ~2.9% instead, a value comparable to results from models.
The orbital architecture of a system also plays a role in the occurrence of engulfment events. In the absence of a disc, dynamical instabilities in the system can also lead to these events. Phenomena such as fly-by encounters (Davies et al. 2014) can disturb the system, leading to instabilities within it on long timescales. However, it is not possible to observe the planet engulfment phase, as we can only see the current configuration of a system (Behmard et al. 2023b,a). As such, it is necessary to resort to models, seeing as simulations of the formation and evolution of planetary systems provide the necessary information on the state of a system across time.
In this work, we aim to understand what the planet engulfment rate is, the conditions under which these events happen, how planet engulfment correlates with the properties of the planetary systems, and how it impacts the composition of the stellar surface. This is done using simulated planetary systems from formation models. In Section 2, we describe the planetary population synthetic dataset that we have used in this work and its importance for the topic at hand. We start by presenting a more statistical approach of the results in Section 3, with a deeper analysis of parameters impacting planet engulfment being addressed in Section 4. This is followed by an analysis of the chemical composition of the planetary material engulfed by the host star and that of the remaining planets in the systems in Section 5. We then examine in Section 6 how planet engulfment events impact the stellar surface chemical composition. Section 7 features a discussion of the results, with a final summary being provided in Section 8.
2 Data
To study planetary engulfment and better understand what may lead to it, we analysed the latest data from the New Generation Planetary Population Synthesis (NGPPS) calculations by the Generation III Bern model (Emsenhuber et al. 2021a). The Bern model is a self-consistent global model following the core accretion paradigm (Mizuno 1980) and based on previously existing models built to simulate a giant planet formation in the Solar System (Alibert et al. 2004, 2005). It was improved to include quantitative statistical comparisons with observations (Mordasini et al. 2009), to follow the long-term evolution of the formed planet (Mordasini et al. 2012a,b), and to address the structure of the protoplanetary disc (Fouchet et al. 2012) and the solids accretion rate (Fortier et al. 2013). Additionally, the model incorporates a planet migration scheme with type I (Paardekooper et al. 2011) and type II (Dittkrist et al. 2014) migration. The model was then extended to allow for the formation of multi-planetary systems via N-body integration (Alibert et al. 2013), to include the cooling, contraction, envelope evaporation, and general and thermodynamic evolution after the planetary formation over gigayear timescales (Mordasini et al. 2012b), and to account for atmospheric escape (Jin et al. 2014).
The dataset used includes the simulation of the formation and evolution of 1000 planetary systems across 10 Gyr. Each synthetic system initially contains 100 embryos of 0.01 M⊕ orbiting a 1 M⊙ star. The stellar metallicity comes from a normal distribution, 𝒩(−0.02, 0.22) dex, truncated to −0.6 < [Fe/H] <0.5 dex to avoid metallicities that do not occur in the solar neighbourhood. All systems initially possess a protoplanetary disc, whose gas mass comes from a log-normal distribution, Lognormal (−1.49, 0.35) M⊙, constrained to 4 × 10⁻³ < Mgas disk < 0.16 M⊙ to ensure that the discs are always self-gravitationally stable (see Emsenhuber et al. 2021b for a comprehensive explanation on the initial conditions of the simulations and respective distribution).
The embryos present in the systems grow (via the accretion of planetesimals and gas), collide with each other in giant impacts, migrate, and interact via an N-body in an evolving protoplanetary disc. The model is divided in two phases and takes place across 10 Gyr: the formation phase (0–20 Myr), which follows the core accretion paradigm, and the evolution phase (20 Myr–10 Gyr), which analyses the thermodynamical development of each planet individually. A detailed description of the model is provided in Emsenhuber et al. (2021a; 2021b), with additional reviews by Benz et al. (2014) and Mordasini (2018).
3 Planet engulfment in NGPPS: Statistics
The formation and evolution of a planetary system can be a very active and chaotic process (Malhotra 1999; Lin & Douglas 2008). The majority of planets in our sample end up being accreted by other planets, with less than one third remaining after 10 Gyr. Furthermore, a small fraction is either ejected from the system, disappears due to photoevaporation, or falls into the star, eventually being engulfed by the host. However, not all stars register an engulfment event. Out of 1000, 47.1% of stars never engulf a planet, implying that only around half of them are polluted by in-fall material from their system.
Despite there being 529 stars that engulf planetary material, signatures of these events might not be observable. A large stellar convective layer means that interior mixing processes will dilute any refractory enrichment from planetary material and over time dilute engulfment signatures (Kunitomo et al. 2018). Since the size of convective zones changes with stellar evolution, the timing of engulfment events affects the observability of the resulting signatures (Booth & Owen 2020; Behmard et al. 2023b). Therefore, we started by analysing when these events happen in the span of 10 Gyr and how much material falls onto the host stars.
3.1 Timing of planet engulfment
Engulfment events can happen during the formation and evolution of planetary systems. However, they are not uniformly distributed across 10 Gyr. Figure 1 shows the cumulative distribution of the number of stars (and hence systems) with engulfment as a function of time. Although a star may engulf planets at different points in time, we count only the time of the first occurrence. The first engulfment event happens at ~1.5 × 10⁵ yr and the number of stars with at least one of these events increases with time. As is shown by Figure 1, there are three main engulfment phases that reflect the physics behind the planet formation simulations: disc migration (0 ~10 Myr), dynamical interactions (10–100 Myr), and tidal forces (100 Myr–10 Gyr). We note that we generally define 0 ~ 10 Myr for the first phase, which lasts only until the disc dissipates, but the disc lifetime varies for each system, with the mean value being ~4 Myr. Additionally, Table 1 reveals how the engulfment rate varies in each phase and how it affects the number of systems with engulfment.
The first transition at 5 × 10⁶ yr marks the first change and is close to the average lifetime of the protoplanetary discs in the simulation (~4 Myr). During this period, disc migration is the main process responsible for the engulfment of planetary material. The presence of the disc leads to planets gradually migrating closer to the star, while accreting solid and gaseous material. If they migrate too close to the star, they will fall into and be engulfed by the stellar host. Over this phase, the number of systems with engulfment events increases quickly due to the effect of disc migration, leading to 370 systems with engulfment.
After the disc dissipates, this process can no longer affect the planets. However, the number of systems registering engulfment events continues to grow, albeit more slowly. Up to 100 Myr, dynamical interactions prompts collisions and scattering of planets. Due to this scattering, some planets are pushed into the star to then ultimately be engulfed by it. During this phase, 220 systems register at least one engulfment event, with a total of 440 planets engulfed.
After 100 Myr, the immediate output from the model needs to be carefully considered, since dynamical interactions between planets are stopped in the model. At this stage, the model indicates that there is no more accretion of either gaseous or solid material, ceasing planetary growth. The model changes processes and tidal effects are now the main mechanism that affects the system and that might lead to the star engulfing a planet. During this last stage, the number of systems with engulfment increases at the slowest rate, and we have 380 planets engulfed among 222 systems. Despite these values being similar to the ones from the previous phase, we note the difference in the timescale: these events occurred over about 10 Gyr, while the previous ones were within less than 100 Myr. Tidal effects are stronger the more massive the planets are, since the gravitational force is stronger. Therefore, a system needs to possess a giant planet for tides to play a role, and this is not the case for all systems.
Although the number of systems with engulfment increases over time, the frequency of these events is not always constant. In Figure 2, we show the distribution of the number of engulfment events as a function of time. The solid line represents the kernel density estimate (KDE) of the distribution. It is possible to see how the distribution of the number of engulfment events has three peaks, namely around ~2 Myr, ~100 Myr, and ~8 Gyr, and how these match the three periods described before.
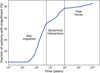 |
Fig. 1 Percentage of systems with at least one engulfment event, for the 10 Gyr. |
Fraction of planets engulfed in each phase, cumulative percentage of systems with at least one engulfment event, and number of systems with planet engulfment for each phase.
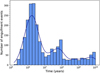 |
Fig. 2 Number of engulfment events at different points in time over 10 Gyr, on a logarithmic scale. The solid line represents the KDE of the distribution. |
3.2 Masses of engulfed planets
During the first million years, planets grow in mass, and the different engulfment mechanisms are efficient for different planetary masses. As such, the distribution of the masses of the engulfed planets is not uniform across time. Moreover, the multiplicity of planet engulfment event is also an important parameter to consider, as it can vary from one event to thirty. Furthermore, the mass of engulfed planets can be in the range of 0.01–690 M⊕ (~2.17 MJ).
Looking at the total amount of mass engulfed by each star (Figure 3), it is possible to see that there are two main peaks. The first is around low-mass objects, with masses of up to ~1 M⊕. The second is centred around more massive planets, with masses of M ~ 10–30 M⊕. Additionally, there is the smaller, third peak corresponding to gas giants with masses of M ~ 100–200 M⊕.
By accounting for the number of events and the total mass engulfed in each system, we get the distribution of the average mass engulfed per event, which can be seen in Figure 4. Analogous to Figure 3, the distribution shows two peaks, with the first centred around lower values of mass (~0.1 M⊕) and the second around higher ones (~5 M⊕). The wide range of masses corresponds to the different types of planets engulfed.
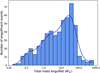 |
Fig. 3 Total mass engulfed by the star, for each system, on a logarithmic scale. The solid line represents the KDE of the distribution. |
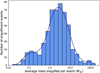 |
Fig. 4 Average mass engulfed by the star per event, for each system. The solid line represents the KDE of the distribution. |
3.3 Planet engulfment across time and mass
The simultaneous analysis of the mass of engulfed material and the point in time when these events happen allows us to better understand the processes behind planet engulfment as a whole. In Figure 5, we show these two quantities together, colour-coded by the number of engulfment events. The figure reveals the peaks observed in Figure 2, but now with the additional information regarding mass. A deeper look into the data reveals how in early times (before 100 Myr), the majority of the (proto)planets engulfed were low-mass planets, which were engulfed across several events.
There are two main peaks of engulfment events during this period, once again one right up to 4 Myr, and another around 100 Myr. Throughout the first phase of engulfment, most engulfed planets have masses between M ~0.6–5 M⊕. On the other hand, during the dynamical interactions phase, mostly planets with M ~0.04–0.1 M⊕ are engulfed. The second peak may be the result of the cessation of dynamical interactions, right after 100 Myr, as is explained in Section 3.1.
At later times (after 100 Myr), tidal effects are responsible for the engulfment of material into the central star. More massive planets have a stronger impact on the stellar host, leading to stronger tidal effects. As the planet pulls the tidal bulges on the star forwards, making the star spin faster, it loses some of its angular momentum in its orbital motion around the star into the spin of the host (see Emsenhuber et al. 2021a for a detailed description of the tidal model). Consequently, the planet ends up migrating closer to the star. As such, the typical mass engulfed shifts to M ~ 10–20 M⊕.
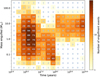 |
Fig. 5 2D histogram representing the timing and amount of material engulfed by the central star, for 1000 systems and across 10 Gyr. |
4 Parameters impacting planet engulfment
To better understand the processes driving in-fall and the resulting planetary accretion, it is crucial to identify the relevant features. In this section, we explore which parameters have an impact on planet engulfment.
4.1 Parameters impacting planet engulfment: An astrophysical approach
Along with the previous analysis, the inherent properties of the protoplanetary disc also help to determine if a system is prone to undergoing engulfment events or not. Looking at the initial properties of the disc for both engulfing and non-engulfing systems can help us better understand what might affect the occurrences of these events. Figure 6 shows the distribution of four parameters directly related to the initial conditions in the protoplanetary disc: the initial mass of solid material (dust), the initial mass of gaseous material, the metallicity ([Fe/H]), and the disc lifetime. We note how for the first three parameters there is a shift between engulfing and non-engulfing systems. The statistics of Anderson-Darling and Kolmogorov–Smirnov tests show a p-value of <10−7 for these three cases.
Figure 6 seems to suggest that high disc mass and metallicity lead to planet engulfment. Under such conditions, planet cores grow faster and they more quickly start accreting gas, prompting the formation of giant planets (see a detailed analysis in Emsenhuber et al. 2021b). In turn, giants will migrate during their formation and evolution, which will generate some scatter of the planets around them, leading to some being pushed towards the star.
For the systems that register at least one engulfment event, in Figure 7 we look at the total amount of mass engulfed in the system, depending on four initial parameters previously mentioned that reveal a difference between populations. There is a clear correlation with initial mass, as systems with a high initial mass tend to engulf a higher amount (since there is more material available). In addition, the more metallic a system is, the more mass it tends to engulf, and though it is not as obvious, there is also a correlation between these two parameters (Spearman coefficient of 0.33). The dependence we found for these parameters seems to support the idea that systems with conditions more favourable to the formation of giants are more likely to experience planet engulfment.
Although the presence of giant planets can lead to planet engulfment, it is important to notice that the direction of the causality relation between initial conditions and the presence of giant planets is not clear. The presence of giant planets in the system is not necessarily the main reason behind the engulfment of planets, as the formation of giant planets also depends on the same aforementioned initial conditions of the disc. Furthermore, although systems with more massive and more metallic discs are more prone to forming giants and undergoing planet engulfment, there exist cases of systems that also register engulfment events but do not form giant planets. As such, giant planets cannot be the sole reason behind planet engulfment.
4.2 Parameters impacting planet engulfment: A machine-learning approach
On top of the initial conditions of the planet-forming discs, the NGPPS database contains over 140 columns of information about the characteristics of planetary embryos at a given time snapshot. In order to understand which parameters are more important for a correct prediction of engulfment in planetary systems, we used several machine-learning (ML) supervised classification models to analyse the data. Our aim was to identify the astrophysical parameters that are most relevant when predicting whether engulfment will happen in a system. For this, we utilised the XGBClassifier2 from XGBoost (Chen & Guestrin 2016), the RandomForestClassifier from Random Forest (Ho 1995), and the SVC from Support Vector Machines (Cortes & Vapnik 1995) implemented in scikit-learn3. We also attempted to use Logistic Regression (Cox 1958) from scikit-learn; however, due to the non-linearity of the dependencies, this model did not perform well.
We performed a standard analysis of the data, including exploratory data analysis, normalisation, and addressing multi-collinearity using the variance inflation factor. We split the data into training and testing sets, and optimised the hyperparameters of the models to achieve the best performance for the classification of engulfed and non-engulfed systems. Through these models, we achieved an accuracy of approximately 88% in predicting whether a system would experience an engulfment event. The five critical parameters influencing the models to attain this level of accuracy were the maximum planetary mass within the system at 10 Gyr, the minimum orbital distance of planets at 10 Gyr, the disc lifetime, the initial metallicity, and the initial mass of planetesimals in the disc.
In Figure 8, we illustrate how the fraction of systems with engulfment is contingent on the aforementioned five parameters. The figure shows that these dependencies are not necessarily linear, and for some parameters, there are thresholds beyond which the majority of systems with these properties experience engulfment. For instance, more than 90% of systems with a massive planet (M > 30 M⊕) and minimum orbital distances of a > 0.3 AU undergo engulfment during their evolution. Moreover, there are thresholds above which all the systems experience engulfment. Specifically, all 64 systems with a maximum planetary mass of M > 2900 M⊕ (M > 9 MJ) experience engulfment. The figure also shows that systems that are overall more metalrich and that have more massive and longer-lived discs are more likely to undergo planet engulfment, as was previously concluded.
In the plots of the minimum distance and initial [Fe/H] from Figure 8, we observe a decline in the overall increase in the engulfment fraction for amin,10 Gyr < 0.05 AU and [Fe/H]init > 0.3 dex, respectively. In the first case, this drop occurs because there are many engulfing systems with planets orbiting at distances of less than 0.05 AU (at 10 Gyr), resulting in a cluster of systems within the range 0 < amin,10gyr < 0.05 AU on the amin,10gyr distribution. Thus, when we consider higher values up to 0.05 AU for the minimum distance, we are excluding these very close-by systems. This leads to a sharp decrease in the number of engulfing systems compared to the significantly larger number of non-engulfing systems, resulting in a reduced fraction. Beyond 0.05 AU, the systems are more evenly spread. Analogously, there are very few systems with [Fe/H] > 0.3 dex (less than 5%). When we increase the value of the initial [Fe/H] above 0.3 dex, the total number of systems with planet engulfment and such a value of [Fe/H] decreases.
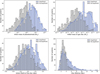 |
Fig. 6 Initial conditions of the protoplanetary disc, for engulfing and non-engulfing systems. We show the initial mass of solids (planetesimals) in the disc (top left), and initial mass of gas disc (top right). On the bottom, we show metallicity (bottom left) and disc lifetime (bottom right). |
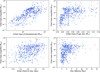 |
Fig. 7 Total mass engulfed depending on initial conditions of the disc, for engulfing systems. |
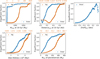 |
Fig. 8 Fraction of systems with engulfment depending on the maximum planetary mass within the system at 10 Gyr, the minimum orbital distance of planets at 10 Gyr, the disc lifetime, the initial metallicity, and the initial mass of planetesimals in the disc, on a linear scale (blue) and a logarithmic scale (red). |
5 Composition of engulfed and remaining planets
During its lifetime, a star can engulf planets with a diverse range of masses and compositions, which could then affect the stellar atmosphere composition. To better understand the chemical patterns of the engulfed planetary material compared to that of the planets that remain on stable orbits, we selected nine cases to analyse: the engulfment of planets with masses of M = 2, 5, and 10 M⊕, at times around 8 Myr, around 60 Myr, and around 4.5 Gyr. The first period should not be too short, in order to avoid the presence of the disc and the large stellar convective layer; hence, we chose 8 Myr. The second period was selected to be around 60 Myr. Finally, we decided on 4.5 Gyr for the last one as this is around the solar age, and our results show that the impact on stars is not very different at the late stage of evolution (≳1 Gyr).
Since the Bern model does not include a continuous time distribution but instead provides snapshots of different points in time, and there are not enough events happening at a given time, we considered the aforementioned times within a certain interval: 8 ± 2 Myr, 60 ± 40 Myr, and 4.5 ± 1 Gyr. For the previously mentioned masses, in the period between 10 and 100 Myr, the number of engulfment events is small, and thus the model does not provide enough information to estimate representative average values. As such, we decided to extend the period around 60 Myr to account for more events. Likewise, in the simulated data, the planets’ mass is not exactly 2, 5, or 10 M⊕. As such, we considered a range of masses centred on these values, and in a way that the intervals do not overlap: 2 ± 1.5 M⊕, 5 ± 1.5 M⊕, and 10 ± 3.5 M⊕. The size of the intervals was adjusted in order to guarantee a minimum number of three events in each case, for the different periods.
For each instance, we analysed the chemical composition of the planetary material. The internal structure model from Generation III Bern model assumes that planets have a spherically symmetric interior with an onion-like structure composed of an iron core, a silicate mantle, and (depending on a planet’s accretion history) a water ice layer and a gaseous envelope made of pure H/He. In this work, we refer to the gaseous layer surrounding the planet as the “atmosphere”, and the remaining layers of the planet, not including the atmosphere, as the “core”.
The Generation III Bern model provides information on the ice mass fraction of the core, fice, and the iron mass fraction in the core’s refractory component, firon. We computed the corresponding mass fraction of ice, iron, and silicates of each planet from the core mass, Mcore:
![Mathematical equation: $\[\begin{aligned}& M_{ice}=M_{core} \times f_{ice} \\& M_{iron}=\left(M_{core}-M_{ice}\right) \times f_{iron} \\& M_{silicates}=M_{core}-M_{ice}-M_{iron}.\end{aligned}\]$](/articles/aa/full_html/2025/01/aa51399-24/aa51399-24-eq1.png) (1)
(1)
Since the simulations only contain information on the amount of iron, silicates, and ices without discriminating specific elements, we took a simple approach regarding the chemical composition.
We started by assuming that the ices are composed only of water and disregarded highly volatile molecules such as CH4, CO, and other carbon-bearing species. This choice was based on results from Marboeuf et al. (2014) where H2O is identified as the dominant chemical species in ices and as comprising ~60% of its mass. For the silicates, we used the Earth composition as a reference and, following Hirose (2010), we divided the silicates into 80% MgSiO3 (perovskite, a magnesium silicate) and 20% Mg2SiO4 (olivine). For the atmosphere, we assumed that 76% of the atmosphere mass (Matm) corresponds to hydrogen and the remaining 24% to helium, considering that the fixed value of helium mass fraction in the simulations is Y = 0.24.
With information of these minerals, together with iron, water, and an atmosphere made of H/He (if present), we extracted the mass fraction of H, He, O, Mg, Si, and Fe. Through stoichiometric relations and the molecular mass of the different species, we computed the mass of the different elements using
![Mathematical equation: $\[m_{X}=\alpha.n_{Y} \times \mathcal{M}_{X},\]$](/articles/aa/full_html/2025/01/aa51399-24/aa51399-24-eq2.png) (2)
(2)
where X represents the element we want to determine the mass of, α its stoichiometric coefficient, ℳ the molecular mass, n the moles number, and Y the molecule it is part of.
Some species like He and Fe are straightforward to calculate, since they come directly from Matm and Miron. However, H, O, Mg, and Si are present in more than one molecule, and therefore all of the contributions need to be accounted for:
![Mathematical equation: $\[\begin{aligned}M_H & =0.76 \times M_{atmo}+2 n_{H_2 O} \times \mathcal{M}_H \\M_{H e} & =0.24 \times M_{atmo} \\M_O & =\left(3 n_{M g S i O_3}+4 n_{M g_2 S i O_4}+n_{H_2 O}\right) \times \mathcal{M}_O \\M_{M ~g} & =\left(n_{M g S i O_3}+2 n_{M g_2 S i O_4}\right) \times \mathcal{M}_{M g} \\M_{S ~i} & =\left(n_{M g S i O_3}+n_{M g_2 S i O_4}\right) \times \mathcal{M}_{S i} \\M_{F ~e} & =M_{iron}.\end{aligned}\]$](/articles/aa/full_html/2025/01/aa51399-24/aa51399-24-eq3.png) (3)
(3)
In Table 2, we present the results of the calculated the mass fraction of all aforementioned elements for the engulfed planets and for those remaining in the system after 10 Gyr.
We notice that, in general, the engulfed planets have a higher amount of Mg, Si, and Fe than the planets remaining in the system. This could be due to the fact that if these engulfed planets formed inside the ice line, closer to the star where condensation temperatures are higher, their composition would be richer in refractory elements like Mg, Si, and Fe (see e.g. Lodders 2003; Wang et al. 2019). Being at a shorter orbital distance from the star, they would be more susceptible to be pushed into the host star and eventually engulfed by it.
On the other hand, the planets that remain in the systems are generally richer in oxygen. Following our simple approach in composition, this element comes not only from the olivine and perovskite, but also from the molecule of water. If these planets have lower abundances of Mg, Si, and Fe, but a higher amount of O, this points to a higher content of water in these planets, meaning that they could have formed farther away from Article number, page 8 of 12 the host star, contrary to the engulfed planets. In the surviving planets, the amount of hydrogen compared to helium is greater than what would come exclusively from the atmosphere (76% H, 24% He). This means that the hydrogen amount also comes from water molecules, which supports the hypothesis that these planets formed at a longer orbital distance from the star, and thus are less likely to be engulfed by the host star.
Average percentage mass fraction of elements in engulfed planets (top) and remaining planets (bottom).
6 Impact of planet engulfment on stellar composition
In order to assess the effect of planet engulfment on the surface composition of the host star, stellar models were computed with the Cesam2k204 (Code d’Evolution Stellaire Adaptatif et Modulaire) stellar evolution code (Morel & Lebreton 2008; Marques et al. 2013; Deal et al. 2018). The models were computed with X0 = 0.720, Y0 = 0.264, and Z0 = 0.016 (solar calibrated) and an initial mixture of metals following the solar abundances determined by Asplund et al. (2021), the OPAL equation of states (Rogers & Nayfonov 2002), and opacity tables (Iglesias & Rogers 1996) complemented at low temperature by the table of Ferguson et al. (2005). The nuclear reaction rates were taken from the NACRE (Nuclear Astrophysics Compilation of REactions rates) compilation (Angulo 1999), except for the 14N(p, γ)15O reaction, for which we adopted the LUNA (Laboratory for Underground Nuclear Astrophysics) rate (Imbriani et al. 2004). Convection was computed following the CGM formalism (Canuto-Goldman-Mazzitelli, Canuto et al. 1996) with a solar-calibrated parameter, αCGM = 9183. We used the Krishna Swamy (1966) T(τ) relation for the atmosphere. For the transport of chemical elements, we included atomic diffusion following the Michaud & Proffitt (1993) formalism, and thermohaline convection was included with the Brown et al. (2013) prescription. When an additional transport was included, a turbulent diffusion coefficient was added with the expression
![Mathematical equation: $\[D_{\text {turb }}=\omega D(\mathrm{He})_{0}\left(\frac{\rho_{0}}{\rho}\right)^{n},\]$](/articles/aa/full_html/2025/01/aa51399-24/aa51399-24-eq4.png) (4)
(4)
where ω = 400 and n = 3 are constants, ρ is the density, and D(He)0 and ρ0 are the diffusion coefficient of helium and density at the reference depth defined with the temperature, T0, respectively (see Richer et al. 2000). The reference depth was calibrated to produce a transport to obtain the lithium surface abundance of the Sun for a solar model. The calibrated value is log(T0) = 6.44. When accretion was taken into account, the matter was instantaneously diluted in the convective envelope with an accretion rate of Maccr/1 Myr for 1 Myr after the start of the accretion. Any additional dilution comes directly from the transport in the radiative zone.
Through these stellar models, it is possible to determine the impact of planet engulfment on the surface composition of the host star. The composition of the planetary material was estimated from the simulations, as is described in Section 5. We applied the aforementioned nine cases to the stellar models and checked how a planet with a given mass engulfed by its host at a given time changes the stellar composition. The results of the variation in [Fe/H] due to planetary engulfment can be found in Figure 9. The solid black line in the plot corresponds to the evolution of the composition for the solar case.
According to SP21, in our analysis we set σ[Fe/H] = 0.02 dex as the minimum value for a variation in [Fe/H] to be measurable. As a more conservative approach, we also considered a threshold of 0.06 dex for the [Fe/H] variation to be observable. This number reflects the middle value of the [Fe/H] variation for the binaries classified by SP21 as chemically anomalous; that is, the median of the dataset.
The timing and amount of engulfed material pertain to the nine cases mentioned in Section 5. Regardless of the mass of the engulfed planet, events happening around 8 Myr do not have an observable impact on the stellar atmosphere’s composition, as the biggest variation corresponds to an enhancement of <0.01 dex, in the case of M ~ 10 M⊕.
As is shown in Table 3, the engulfment events that occur around 60 Myr can generate [Fe/H] variation of 0.02 dex (case of 2 M⊕), 0.04 dex (case of 5 M⊕), and up to 0.07 dex (case of 10 M⊕) immediately after the accretion of the planetary material. If we consider the criteria from SP21, in all cases it would be possible to detect traces of planet engulfment. However, if we assume instead σ[Fe/H] = 0.06 dex, only an engulfment of a planet with 10 M⊕ would provide an amount of material large enough to induce an observable change in the stellar surface composition. Nevertheless, as the star evolves and its internal processes dilute the additional material, this chemical imprint reduces, respectively, to <0.01, 0.02, and 0.03 dex after 1 Gyr, leading to the chemical imprint of a 2 M⊕ engulfed planet no longer being detectable by SP21’s criteria. However, 3 Gyr after the event, only traces consequent of the engulfment of a 10 M⊕ remain detectable. On the other hand, if we assume that σ[Fe/H] = 0.06 dex then no chemical imprint on the stellar surface is large enough to be measured 1 Gyr following the occurrence.
If we have an engulfment event of the same three cases at 4.5 Gyr, the induced signature on [Fe/H] variation is 0.03, 0.06, and 0.07 dex for the case of engulfment of a 2 M⊕, 5 M⊕, and 10 M⊕ planet, respectively, all of which are detectable by SP21’s criteria. Looking 1 Gyr and 3 Gyr after the event, the internal processes of the star dilute the chemical imprint on the stellar surface and the signatures for the 2 M⊕ and 5 M⊕ cases are no longer observable. Moreover, if we consider σ[Fe/H] = 0.06 dex, no variation in the iron abundance remains detectable for these scenarios.
Though the findings presented correspond only to the variation in the iron abundance, the [O/H], [Mg/H], and [Si/H] variations follow the same behaviour, leading to similar conclusions.
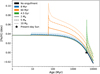 |
Fig. 9 Variation in iron abundance on the stellar surface due to an engulfment event occurring at 8 Myr (blue), 60 Myr (orange), or 4.5 Gyr (green). Included are the cases of an engulfed planet with a mass of 2 M⊕ (solid line), 5 M⊕ (dashed line), or 10 M⊕ (dotted line). The solid black line models the evolution of the solar composition. |
Variation in [Fe/H] caused by engulfment of 2,5, and 10 M⊕ at 60 Myr and 4.5 Gyr, and evolution of the chemical signature after 1 Gyr and 3 Gyr.
Fraction of systems that register engulfment of planetary bodies with masses above a minimum value (2, 5, or 10 M⊕), during time intervals from a fixed point (60 Myr; 1, 2, 3, 4, or 5 Gyr) until 10 Gyr.
7 Discussion
Several studies have addressed the subject of planet engulfment. As was previously mentioned, in their work SP21 report an engulfment rate of ~27% for Sun-like stars. In their analysis, they account for the presence of a convective layer in the star and note that the engulfment events must have happened after the dissipation of the protoplanetary disc; otherwise, the thick stellar convective zone (Kunitomo et al. 2018) would dilute the accreted material without producing any substantial variation in the atmospheric chemical composition (Spina et al. 2015).
Nonetheless, the authors do not mention the exact moment when these occurrences should happen in order to leave a chemical imprint in the host’s composition. Moreover, they do not discuss any specific stellar structure considered, despite it being a necessary component to consider since, as was mentioned in Section 6, processes like atomic diffusion, thermohaline mixing, and other transport processes can affect the lifetime of the chemical patterns induced by the engulfment of planetary material.
In this work, we account for both aspects when we evaluate the impact of planet engulfment on the stellar surface composition with the stellar models computed with Cesam2k20. As was explained in Section 6, accretion of material onto the stellar surface at 8 Myr will not induce visible variation in the [Fe/H] abundance due to the size of the stellar convective layer at this early stage (Kunitomo et al. 2018). However, as the star evolves, the convective zone will gradually shrink (Stahler & Palla 2004); thus, the signature on the star’s composition caused by planet engulfment would be increasingly great at later ages.
Following this line of reasoning, in Table 4 we calculate the fraction of systems that have registered an engulfment event of a planet with M > 2M⊕, M > 5M⊕, and M > 10M⊕ after a given age, considering the σ = 0.02 dex threshold. When we consider an event at any point after 60 Myr, ~20% of the systems engulf a M > 2 M⊕ planet. However, we show in Table 3 that 3 Gyr after the event, only the variation in [Fe/H] caused by the accretion of more massive planets (M > 10 M⊕) remains detectable. As such, when trying to observe the resulting signature a few gigayears after, only ~11% of the stars would still have traces of planet engulfment.
The more this age threshold is moved towards later ages, the fewer systems exist that undergo planet engulfment in these conditions, since we are shortening the time interval. Furthermore, as we consider engulfment of more massive planets, the fraction of systems will also decrease, as massive planets are less common than low-mass ones (see e.g. Fressin et al. 2013; Rowan et al. 2016; Fulton et al. 2021).
To estimate the engulfment rate liable to be observed in the present day, we need to account for not only stellar age, but also the lifetime of the signal resulting from planet engulfment. Analysing Table 3, we find that traces from the engulfment of massive planets (M > 10 M⊕) remain detectable for several gigayears, even if the occurrence happens as early as 60 Myr. Looking at Table 4, this corresponds to 10.5%. On the other hand, the lifetime of an observable signature from the engulfment of a 5 M⊕ is ~2 Gyr. Since the majority of stars in the solar neighbourhood are older than 3 Gyr (e.g. Haywood et al. 2013; Lin et al. 2018; Gondoin 2023), we should also include events that occur after 1 Gyr for planets with masses between 5–10 M⊕ (as planets more massive than 10 M⊕ are already contemplated in 10.5% of the systems). The consequent chemical imprint can remain visible for a few gigayears, corresponding to an additional 5.6% of the systems. In this optimistic scenario, we estimate that the engulfment rate leading to a measurable change in stellar composition is smaller than 20%.
SP21 report an engulfment rate that could be comparable with our results if we consider engulfment of planets with masses of M > 2 M⊕ happening after 60 Myr, with observations made immediately after the event (Table 4). However, as is shown in Table 3, the engulfment of lower-mass planets causes an abundance difference of less than 0.03 dex on [Fe/H], which is no longer detectable 1 Gyr after the occurrence. If we instead assume a minimum detectable variation of 0.06 dex in [Fe/H], we would be referring to the engulfment of more massive planets (M > 10 M⊕), which comprises 11% of the systems, less than half of the reported rate. This analysis was done assuming the more conservative scenario in which engulfment events can happen at any point after 60 Myr, with stars observed immediately following the occurrence. This implies that some stars must still be young for the chemical imprint of the event to remain visible and not yet diluted by the stellar internal processes. In fact, Table 4 and Figure 5 show that a large fraction of the engulfment events happen during the first 100 Myr. Nevertheless, the stars in the solar neighbourhood are, on average, older than 3 Gyr. Moreover, the signatures from planet engulfment are no longer discernible 3 Gyr after the occurrence if the engulfed mass is less than 10 M⊕ (assuming that observable variations in the chemical composition exceed 0.02 dex). In this regard, we find these values to be smaller than is proposed by SP21.
Conversely, a recent work by Liu et al. (2024) also broaches this topic. The authors report an occurrence rate of 8% for engulfment events from a homogeneous sample of 91 co-natal pairs of stars with derived high-precision chemical abundances. While SP21 attribute a difference in composition to planet engulfment, Liu et al. (2024) recognise that atomic diffusion can also impact the stellar composition. In this context, the authors tested two hypotheses: whether the observed variation in chemical composition is due to atomic diffusion or planet engulfment. Taking similar precautions as we did in this work, Liu et al. (2024) obtained a result aligned with our findings, in particular for stars older than 3 Gyr.
The stellar age is also expected to have an impact in dictating how relevant the impact of planet engulfment would be in the chemical composition of the stellar surface, as the extension of the convective zone shrinks as the star evolves. Older stars would have thinner convective layers compared with younger stars. However, since we did not have complete information on the stellar ages from an observational sample, we could not compare them with the outcome from simulations; hence, this was something we were unable to test.
Furthermore, the spectral type should also be taken into account, since for hotter stars not only is the dilution timescale shorter but the convective envelopes are shallower (see e.g. Kunitomo et al. 2018; Semenova et al. 2020), since higher temperatures require other transport mechanisms besides the traditional gravitational settling, which can influence the timescales of the mixing of the chemical imprint (Baturin et al. 2006; Michaud et al. 2015). In this regard, it would be useful to test how much the different temperatures of the binary components correspond to different sizes of the convective envelope, and how this would impact the dilution factor between both components of the binary system. Since in the sample of SP21 they consider only the mean effective temperature in their analysis and mention that they allow differences of up to 600 K, it would be interesting to verify what consequences this large difference could have for the results. In addition, a comparison with the sample from Liu et al. (2024), where they only allow differences of up to 300 K, could provide further insights on the relevance of this effect.
Despite accounting for different aspects, we acknowledge that our results have some limitations due to the nature of the model they were based on. The 1000 stars simulated were Sun-like stars; thus, the stellar models computed with Cesam2k20 consider the chemical composition of the stellar atmospheres as being solar-like. Moreover, when estimating the impact of planet engulfment on the stellar composition, we did not model each individual engulfment event for each system, even though the cumulative effect of multiple engulfment events could be greater. The caveats for the Generation III Bern model are explained in detail in Emsenhuber et al. (2021a), and Emsenhuber et al. (2021b) provides a comprehensive discussion on the limitations for the case of population synthesis itself. Consequences and constraints are further explored for different settings through the series of articles these works belong to (e.g. Burn et al. 2021; Schlecker et al. 2021; Mishra et al. 2021).
8 Summary
In this work, we have explored the impact of planet engulfment on the chemical composition of the host star. Using the results of planetary population synthesis from the Generation III Bern model (Emsenhuber et al. 2021a,b), we have been able to follow the formation and evolution of 1000 systems. In particular, the data has allowed us to track the star and planets individually over time and analyse the conditions under which planet engulfment might happen. An analysis of the timing of planet engulfment and the amount of material involved reveals the existence of three different phases at different points of evolution, each with a main mechanism responsible for these occurrences.
When comparing the properties of the systems with and without engulfment, we found that systems that register an engulfment event at any point in time tend to form in more massive and more metallic discs. Under these conditions, giant planets are more likely to form, and though the presence of these planets can affect planet engulfment, they are not the sole reason behind these events. Through a simple model, we also determined the chemical composition of the planetary material, both the planets that were engulfed and the ones that remain in the system. We note that, in general, the engulfed planets have a higher amount of refractories than the remaining planets, while the latter are richer in volatiles, in particular oxygen. This could hint at these planets having formed in different places (inside and outside the ice line).
In order to account for the physical processes happening in the stellar interior when determining the impact of planet engulfment on the stellar surface composition, we employed stellar models computed with Cesam2k20 (Morel & Lebreton 2008; Marques et al. 2013; Deal et al. 2018). We simulated nine cases of planets with varying masses being engulfed by their host star at different points in time and analysed the variation in the chemical composition in the stellar surface. Our results show that engulfment events happening while the protoplanetary disc is present leave no chemical imprint, as the convective layer ensures the total dilution of any material. At later stages, when the disc has already dissipated, the variation in the chemical composition increases with time due to the convective layer shrinking as the star evolves. Moreover, since the engulfed planet will have a higher mass as it has had more time to evolve, the impact on the stellar chemical composition will likewise be greater. For instance, for events happening around 60 Myr, in order to still see a variation of σ[Fe/H] > 0.02 dex after 3 Gyr, we need an engulfment of a M > 10 M⊕ planet.
When looking at engulfment events that might generate an observable chemical imprint in the stellar surface and considering that the majority of stars in the solar neighbourhood are older than 3 Gyr, we find an engulfment rate that cannot exceed 20% for the optimistic case of being able to detect any variation above 0.02 dex in the stellar composition. Furthermore, if the detection threshold for planet engulfment is raised to 0.06 dex instead of 0.02 dex, this rate will decrease even more.
Stellar characterisation (e.g. chemical composition, mass, radius) is needed to infer information about orbiting planets, like their density or internal structure. Nonetheless, through engulfment events, planets can also impact the stellar chemical composition, making the star-planet connection a bi-directional one.
Acknowledgements
This work was financed by Portuguese funds through FCT – Fundação para a Ciência e a Tecnologia in the framework of the project 2022.06962.PTDC (EXO-Terra, DOI 10.54499/2022.06962.PTDC). Cofunded by the European Union (ERC, FIERCE, 101052347). Views and opinions expressed are however those of the author(s) only and do not necessarily reflect those of the European Union or the European Research Council. Neither the European Union nor the granting authority can be held responsible for them. This work was supported by FCT – Fundação para a Ciência e a Tecnologia through national funds and by FEDER through COMPETE2020 – Programa Operacional Competitividade e Internacionalização by these grants: UIDB/04434/2020; UIDP/04434/2020. B.M.T.B.S. is supported by an FCT fellowship, grant number 2022.11805.BD. M.D. acknowledges support by CNES, focused on PLATO. S.G.S. acknowledges the support from FCT through Investigador FCT contract nr. CEECIND/00826/2018 and POPH/FSE (EC). C.M. acknowledges support from the Swiss National Science Foundation under grant 200021_204847 “PlanetsInTime”. Parts of this work have been carried out within the framework of the NCCR PlanetS supported by the Swiss National Science Foundation under grants 51NF40_182901 and 51NF40_205606.
References
- Adibekyan, V., & Delgado-Mena, E. 2017, Astron. Nachr., 338, 442 [NASA ADS] [CrossRef] [Google Scholar]
- Adibekyan, V., & Dorn, C. 2021, Science, 374, 330 [NASA ADS] [CrossRef] [Google Scholar]
- Adibekyan, V. Z., & González Hernández, J. I. 2014, A&A, 564, L15 [NASA ADS] [CrossRef] [EDP Sciences] [Google Scholar]
- Adibekyan, V. Z., & Sousa, S. G. 2012, A&A, 545, A32 [CrossRef] [EDP Sciences] [Google Scholar]
- Adibekyan, V., Sousa, S. G., & Santos, N. C. 2018, in Astrophysics and Space Science Proceedings, 49, Asteroseismology and Exoplanets: Listening to the Stars and Searching for New Worlds, eds. T. L. Campante, N. C. Santos, & M. J. P. F. G. Monteiro, 225 [Google Scholar]
- Alibert, Y., & Carron, F. 2013, A&A, 558, A109 [NASA ADS] [CrossRef] [EDP Sciences] [Google Scholar]
- Alibert, Y., Mordasini, C., & Benz, W. 2004, A&A, 417, L25 [NASA ADS] [CrossRef] [EDP Sciences] [Google Scholar]
- Alibert, Y., Mordasini, C., Benz, W., & Winisdoerffer, C. 2005, A&A, 434, 343 [NASA ADS] [CrossRef] [EDP Sciences] [Google Scholar]
- Angulo, C. 1999, in American Institute of Physics Conference Series, 495, 365 [NASA ADS] [Google Scholar]
- Asplund, M., Grevesse, N., Sauval, A. J., & Scott, P. 2009, ARA&A, 47, 481 [NASA ADS] [CrossRef] [Google Scholar]
- Asplund, M., Amarsi, A. M., & Grevesse, N. 2021, A&A, 653, A141 [NASA ADS] [CrossRef] [EDP Sciences] [Google Scholar]
- Azevedo Silva, T., & Demangeon, O. D. S. 2022, A&A, 657, A68 [NASA ADS] [CrossRef] [EDP Sciences] [Google Scholar]
- Barros, S. C. C., & Akinsanmi, B. 2022, A&A, 657, A52 [NASA ADS] [CrossRef] [EDP Sciences] [Google Scholar]
- Baturin, V. A., Gorshkov, A. B., & Ayukov, S. V. 2006, Astron. Rep., 50, 1001 [NASA ADS] [CrossRef] [Google Scholar]
- Behmard, A., Dai, F., Brewer, J. M., Berger, T. A., & Howard, A. W. 2023a, MNRAS, 521, 2969 [NASA ADS] [CrossRef] [Google Scholar]
- Behmard, A., Sevilla, J., & Fuller, J. 2023b, MNRAS, 518, 5465 [Google Scholar]
- Benz, W., Ida, S., Alibert, Y., Lin, D., & Mordasini, C. 2014, in Protostars and Planets VI, eds. H. Beuther, R. S. Klessen, C. P. Dullemond, & T. Henning, 691 [Google Scholar]
- Bond, J. C., O’Brien, D. P., & Lauretta, D. S. 2010, ApJ, 715, 1050 [Google Scholar]
- Bonsor, A., & Jofré, P. 2021, MNRAS, 503, 1877 [NASA ADS] [CrossRef] [Google Scholar]
- Booth, R. A., & Owen, J. E. 2020, MNRAS, 493, 5079 [NASA ADS] [CrossRef] [Google Scholar]
- Brown, J. M., Garaud, P., & Stellmach, S. 2013, ApJ, 768, 34 [NASA ADS] [CrossRef] [Google Scholar]
- Burn, R., & Schlecker, M. 2021, A&A, 656, A72 [NASA ADS] [CrossRef] [EDP Sciences] [Google Scholar]
- Canuto, V. M., Goldman, I., & Mazzitelli, I. 1996, ApJ, 473, 550 [NASA ADS] [CrossRef] [Google Scholar]
- Chen, T., & Guestrin, C. 2016, in Proceedings of the 22nd ACM SIGKDD International Conference on Knowledge Discovery and Data Mining, KDD’16 (New York, NY, USA: ACM), 785 [Google Scholar]
- Church, R. P., Mustill, A. J., & Liu, F. 2020, MNRAS, 491, 2391 [NASA ADS] [Google Scholar]
- Cortes, C., & Vapnik, V. 1995, Mach. Learn., 20, 273 [Google Scholar]
- Cowley, C. R., & Yüce, K. 2022, MNRAS, 512, 3684 [CrossRef] [Google Scholar]
- Cox, D. R. 1958, J. Roy. Statist. Soc. B (Methodological), 20, 215 [CrossRef] [Google Scholar]
- Davies, M. B., Adams, F. C. 2014, in Protostars and Planets VI, eds. H. Beuther, R. S. Klessen, C. P. Dullemond, & T. Henning, 787 [Google Scholar]
- Deal, M., & Alecian, G. 2018, A&A, 618, A10 [NASA ADS] [CrossRef] [EDP Sciences] [Google Scholar]
- Deal, M., Richard, O., & Vauclair, S. 2015, A&A, 584, A105 [NASA ADS] [CrossRef] [EDP Sciences] [Google Scholar]
- Dittkrist, K. M., Mordasini, C., Klahr, H., Alibert, Y., & Henning, T. 2014, A&A, 567, A121 [NASA ADS] [CrossRef] [EDP Sciences] [Google Scholar]
- Dorn, C., & Khan, A. 2015, A&A, 577, A83 [NASA ADS] [CrossRef] [EDP Sciences] [Google Scholar]
- Emsenhuber, A., & Mordasini, C. 2021a, A&A, 656, A69 [NASA ADS] [CrossRef] [EDP Sciences] [Google Scholar]
- Emsenhuber, A., & Mordasini, C. 2021b, A&A, 656, A70 [NASA ADS] [CrossRef] [EDP Sciences] [Google Scholar]
- Ferguson, J. W., & Alexander, D. R. 2005, ApJ, 623, 585 [NASA ADS] [CrossRef] [Google Scholar]
- Fortier, A., Alibert, Y., Carron, F., Benz, W., & Dittkrist, K. M. 2013, A&A, 549, A44 [NASA ADS] [CrossRef] [EDP Sciences] [Google Scholar]
- Fouchet, L., Alibert, Y., Mordasini, C., & Benz, W. 2012, A&A, 540, A107 [NASA ADS] [CrossRef] [EDP Sciences] [Google Scholar]
- Fressin, F., Torres, G. 2013, ApJ, 766, 81 [NASA ADS] [CrossRef] [Google Scholar]
- Fulton, B. J., & Rosenthal, L. J. 2021, ApJS, 255, 14 [NASA ADS] [CrossRef] [Google Scholar]
- Gondoin, P. 2023, A&A, 678, A39 [NASA ADS] [CrossRef] [EDP Sciences] [Google Scholar]
- Gonzalez, G. 1997, MNRAS, 285, 403 [Google Scholar]
- González Hernández, J. I., & Israelian, G. 2010, ApJ, 720, 1592 [CrossRef] [Google Scholar]
- González Hernández, J. I., Israelian, G. 2011, in The Astrophysics of Planetary Systems: Formation, Structure, and Dynamical Evolution, 276, eds. A. Sozzetti, M. G. Lattanzi, & A. P. Boss, 422 [Google Scholar]
- González Hernández, J. I., & Delgado-Mena, E. 2013, A&A, 552, A6 [NASA ADS] [CrossRef] [EDP Sciences] [Google Scholar]
- Grunblatt, S. K., & Saunders, N. 2022, AJ, 163, 120 [NASA ADS] [CrossRef] [Google Scholar]
- Haywood, M., Di Matteo, P., Lehnert, M. D., Katz, D., & Gómez, A. 2013, A&A, 560, A109 [NASA ADS] [CrossRef] [EDP Sciences] [Google Scholar]
- Hirose, K. 2010, Sci. Am., 302, 76 [NASA ADS] [CrossRef] [Google Scholar]
- Ho, T. K. 1995, in Proceedings of 3rd International Conference on Document Analysis and Recognition, 1, IEEE, 278 [Google Scholar]
- Iglesias, C. A., & Rogers, F. J. 1996, ApJ, 464, 943 [NASA ADS] [CrossRef] [Google Scholar]
- Imbriani, G., & Costantini, H. 2004, A&A, 420, 625 [NASA ADS] [CrossRef] [EDP Sciences] [Google Scholar]
- Jin, S., & Mordasini, C. 2014, ApJ, 795, 65 [NASA ADS] [CrossRef] [Google Scholar]
- Krishna Swamy, K. S. 1966, ApJ, 145, 174 [Google Scholar]
- Kunitomo, M., Guillot, T., Ida, S., & Takeuchi, T. 2018, A&A, 618, A132 [NASA ADS] [CrossRef] [EDP Sciences] [Google Scholar]
- Lin, C., & Douglas, N. 2008, Sci. Am., 298, 50 [CrossRef] [Google Scholar]
- Lin, J., Dotter, A., Ting, Y.-S., & Asplund, M. 2018, MNRAS, 477, 2966 [CrossRef] [Google Scholar]
- Liu, F., & Bitsch, B. 2021, MNRAS, 508, 1227 [NASA ADS] [CrossRef] [Google Scholar]
- Liu, F., & Ting, Y.-S. 2024, Nature, 627, 501 [NASA ADS] [CrossRef] [Google Scholar]
- Liu, F., Asplund, M., Ramirez, I., Yong, D., & Melendez, J. 2014, MNRAS, 442, L51 [CrossRef] [Google Scholar]
- Lodders, K. 2003, ApJ, 591, 1220 [Google Scholar]
- Mack, Claude E., I., Stassun, K. G., Schuler, S. C., Hebb, L., & Pepper, J. A. 2016, ApJ, 818, 54 [NASA ADS] [CrossRef] [Google Scholar]
- Malhotra, R. 1999, Nature, 402, 599 [NASA ADS] [CrossRef] [Google Scholar]
- Marboeuf, U., Thiabaud, A., Alibert, Y., Cabral, N., & Benz, W. 2014, A&A, 570, A36 [NASA ADS] [CrossRef] [EDP Sciences] [Google Scholar]
- Marques, J. P., & Goupil, M. J. 2013, A&A, 549, A74 [NASA ADS] [CrossRef] [EDP Sciences] [Google Scholar]
- Meléndez, J., Asplund, M., Gustafsson, B., & Yong, D. 2009, ApJ, 704, L66 [Google Scholar]
- Michaud, G., & Proffitt, C. R. 1993, in Astronomical Society of the Pacific Conference Series, 40, IAU Colloq. 137: Inside the Stars, eds. W. W. Weiss, & A. Baglin, 246 [Google Scholar]
- Michaud, G., Alecian, G., & Richer, J. 2015, Atomic Diffusion in Stars (Springer Cham) [CrossRef] [Google Scholar]
- Mishra, L., & Alibert, Y. 2021, A&A, 656, A74 [NASA ADS] [CrossRef] [EDP Sciences] [Google Scholar]
- Mizuno, H. 1980, Prog. Theoret. Phys., 64, 544 [NASA ADS] [CrossRef] [Google Scholar]
- Mordasini, C. 2018, in Handbook of Exoplanets, eds. H. J. Deeg, & J. A. Belmonte, 143 [Google Scholar]
- Mordasini, C., Alibert, Y., & Benz, W. 2009, A&A, 501, 1139 [CrossRef] [EDP Sciences] [Google Scholar]
- Mordasini, C., Alibert, Y., Klahr, H., & Henning, T. 2012a, A&A, 547, A111 [NASA ADS] [CrossRef] [EDP Sciences] [Google Scholar]
- Mordasini, C., & Alibert, Y. 2012b, A&A, 547, A112 [NASA ADS] [CrossRef] [EDP Sciences] [Google Scholar]
- Morel, P., & Lebreton, Y. 2008, Ap&SS, 316, 61 [Google Scholar]
- Nagar, T., Spina, L., & Karakas, A. I. 2020, ApJ, 888, L9 [Google Scholar]
- Oh, S., & Price-Whelan, A. M. 2018, ApJ, 854, 138 [NASA ADS] [CrossRef] [Google Scholar]
- Önehag, A., Gustafsson, B., & Korn, A. 2014, A&A, 562, A102 [NASA ADS] [CrossRef] [EDP Sciences] [Google Scholar]
- Paardekooper, S. J., Baruteau, C., & Kley, W. 2011, MNRAS, 410, 293 [NASA ADS] [CrossRef] [Google Scholar]
- Pinsonneault, M. H., DePoy, D. L., & Coffee, M. 2001, ApJ, 556, L59 [Google Scholar]
- Ramírez, I., & Khanal, S. 2019, MNRAS, 490, 2448 [CrossRef] [Google Scholar]
- Ramírez, I., Meléndez, J., & Asplund, M. 2009, A&A, 508, L17 [NASA ADS] [CrossRef] [EDP Sciences] [Google Scholar]
- Ramírez, I., Asplund, M., Baumann, P., Meléndez, J., & Bensby, T. 2010, A&A, 521, A33 [Google Scholar]
- Ramírez, I., Meléndez, J., Cornejo, D., Roederer, I. U., & Fish, J. R. 2011, ApJ, 740, 76 [Google Scholar]
- Richer, J., Michaud, G., & Turcotte, S. 2000, ApJ, 529, 338 [Google Scholar]
- Rogers, F. J., & Nayfonov, A. 2002, ApJ, 576, 1064 [Google Scholar]
- Rowan, D., & Meschiari, S. 2016, ApJ, 817, 104 [NASA ADS] [CrossRef] [Google Scholar]
- Saffe, C., & Jofré, E. 2017, A&A, 604, L4 [NASA ADS] [CrossRef] [EDP Sciences] [Google Scholar]
- Saffe, C., Flores, M., & Buccino, A. 2015, A&A, 582, A17 [NASA ADS] [CrossRef] [EDP Sciences] [Google Scholar]
- Santos, N. C., & Adibekyan, V. 2017, A&A, 608, A94 [NASA ADS] [CrossRef] [EDP Sciences] [Google Scholar]
- Schlecker, M., & Pham, D. 2021, A&A, 656, A73 [NASA ADS] [CrossRef] [EDP Sciences] [Google Scholar]
- Schuler, S. C., & Flateau, D. 2011, ApJ, 732, 55 [CrossRef] [Google Scholar]
- Semenova, E., & Bergemann, M. 2020, A&A, 643, A164 [NASA ADS] [CrossRef] [EDP Sciences] [Google Scholar]
- Smith, V. V., Cunha, K., & Lazzaro, D. 2001, AJ, 121, 3207 [NASA ADS] [CrossRef] [Google Scholar]
- Spina, L., & Palla, F. 2015, A&A, 582, L6 [NASA ADS] [CrossRef] [EDP Sciences] [Google Scholar]
- Spina, L., & Randich, S. 2014, A&A, 567, A55 [NASA ADS] [CrossRef] [EDP Sciences] [Google Scholar]
- Spina, L., & Sharma, P. 2021, Nat. Astron., 5, 1163 [NASA ADS] [CrossRef] [Google Scholar]
- Stahler, S. W., & Palla, F. 2004, The Formation of Stars, 1st edn. (Wiley) [CrossRef] [Google Scholar]
- Théado, S., Vauclair, S., Alecian, G., & LeBlanc, F. 2009, ApJ, 704, 1262 [Google Scholar]
- Thiabaud, A., & Marboeuf, U. 2014, A&A, 562, A27 [NASA ADS] [CrossRef] [EDP Sciences] [Google Scholar]
- Unterborn, C. T., Dismukes, E. E., & Panero, W. R. 2016, ApJ, 819, 32 [Google Scholar]
- Vauclair, S., & Théado, S. 2012, ApJ, 753, 49 [Google Scholar]
- Wang, H. S., Lineweaver, C. H., & Ireland, T. R. 2019, Icarus, 328, 287 [NASA ADS] [CrossRef] [Google Scholar]
As per The Extrasolar Planets Encyclopaedia, consulted on 04/06/2024.
All Tables
Fraction of planets engulfed in each phase, cumulative percentage of systems with at least one engulfment event, and number of systems with planet engulfment for each phase.
Average percentage mass fraction of elements in engulfed planets (top) and remaining planets (bottom).
Variation in [Fe/H] caused by engulfment of 2,5, and 10 M⊕ at 60 Myr and 4.5 Gyr, and evolution of the chemical signature after 1 Gyr and 3 Gyr.
Fraction of systems that register engulfment of planetary bodies with masses above a minimum value (2, 5, or 10 M⊕), during time intervals from a fixed point (60 Myr; 1, 2, 3, 4, or 5 Gyr) until 10 Gyr.
All Figures
|
Fig. 1 Percentage of systems with at least one engulfment event, for the 10 Gyr. |
| In the text | |
|
Fig. 2 Number of engulfment events at different points in time over 10 Gyr, on a logarithmic scale. The solid line represents the KDE of the distribution. |
| In the text | |
|
Fig. 3 Total mass engulfed by the star, for each system, on a logarithmic scale. The solid line represents the KDE of the distribution. |
| In the text | |
|
Fig. 4 Average mass engulfed by the star per event, for each system. The solid line represents the KDE of the distribution. |
| In the text | |
|
Fig. 5 2D histogram representing the timing and amount of material engulfed by the central star, for 1000 systems and across 10 Gyr. |
| In the text | |
|
Fig. 6 Initial conditions of the protoplanetary disc, for engulfing and non-engulfing systems. We show the initial mass of solids (planetesimals) in the disc (top left), and initial mass of gas disc (top right). On the bottom, we show metallicity (bottom left) and disc lifetime (bottom right). |
| In the text | |
|
Fig. 7 Total mass engulfed depending on initial conditions of the disc, for engulfing systems. |
| In the text | |
|
Fig. 8 Fraction of systems with engulfment depending on the maximum planetary mass within the system at 10 Gyr, the minimum orbital distance of planets at 10 Gyr, the disc lifetime, the initial metallicity, and the initial mass of planetesimals in the disc, on a linear scale (blue) and a logarithmic scale (red). |
| In the text | |
|
Fig. 9 Variation in iron abundance on the stellar surface due to an engulfment event occurring at 8 Myr (blue), 60 Myr (orange), or 4.5 Gyr (green). Included are the cases of an engulfed planet with a mass of 2 M⊕ (solid line), 5 M⊕ (dashed line), or 10 M⊕ (dotted line). The solid black line models the evolution of the solar composition. |
| In the text | |
Current usage metrics show cumulative count of Article Views (full-text article views including HTML views, PDF and ePub downloads, according to the available data) and Abstracts Views on Vision4Press platform.
Data correspond to usage on the plateform after 2015. The current usage metrics is available 48-96 hours after online publication and is updated daily on week days.
Initial download of the metrics may take a while.