| Issue |
A&A
Volume 693, January 2025
|
|
|---|---|---|
| Article Number | A60 | |
| Number of page(s) | 20 | |
| Section | Extragalactic astronomy | |
| DOI | https://doi.org/10.1051/0004-6361/202450243 | |
| Published online | 06 January 2025 | |
The JWST-PRIMAL archival survey
A JWST/NIRSpec reference sample for the physical properties and Lyman-α absorption and emission of ∼600 galaxies at z = 5.0 − 13.4
1
Cosmic Dawn Center (DAWN), Denmark
2
Niels Bohr Institute, University of Copenhagen, Jagtvej 128, 2200 Copenhagen N, Denmark
3
Department of Astronomy, University of Geneva, Chemin Pegasi 51, 1290 Versoix, Switzerland
4
Institute for Astronomy, University of Edinburgh, Royal Observatory, Edinburgh EH9 3HJ, UK
5
Stockholm University, Department of Astronomy and Oskar Klein Centre for Cosmoparticle Physics, AlbaNova University Centre, SE-10691 Stockholm, Sweden
6
Department of Physics and Astronomy, The Johns Hopkins University, 3400 N Charles St., Baltimore, MD 21218, USA
7
Space Telescope Science Institute (STScI), 3700 San Martin Drive, Baltimore, MD 21218, USA
8
Kapteyn Astronomical Institute, University of Groningen, 9700 AV, Groningen, The Netherlands
9
Scuola Normale Superiore, Piazza dei Cavalieri 7, 56126 Pisa, Italy
10
New Mexico State University, Las Cruces, 88003 NM, USA
11
Department of Astronomy, University of Massachusetts Amherst, Amherst, MA 01002, United States
12
DTU Space, Technical University of Denmark, Elektrovej, Building 328, 2800 Kgs. Lyngby, Denmark
13
Center for Relativistic Astrophysics, School of Physics, Georgia Institute of Technology, 837 State Street, Atlanta, GA 30332, USA
14
Centre for Astrophysics and Cosmology, Science Institute, University of Iceland, Dunhagi 5, 107 Reykjavik, Iceland
15
Instituto de Estudios Astrofísicos, Facultad de Ingeniería y Ciencias, Universidad Diego Portales, Av. Ejército 441, Santiago 8370191, Chile
16
Department of Physics and Astronomy, University of California, Riverside, 900 University Avenue, Riverside, CA 92521, USA
17
Institute of Science and Technology Austria (ISTA), Am Campus 1, 3400 Klosterneuburg, Austria
18
MIT Kavli Institute for Astrophysics and Space Research, 77 Massachusetts Ave., Cambridge, MA 02139, USA
19
Department of Astronomy, University of Florida, 211 Bryant Space Sciences Center, Gainesville, FL 32611, USA
20
Astrophysics Research Institute, Liverpool John Moores University, Liverpool L35 UG, UK
21
School of Physics and Astronomy, University of Leicester, University Road, Leicester LE1 7RH, UK
22
European Southern Observatory, Karl-Schwarzschild-Str. 2, 85748 Garching, Germany
23
Kavli Institute for Cosmology, University of Cambridge, Madingley Road, Cambridge CB3 0HA, UK
24
Cavendish Laboratory, University of Cambridge, 19 JJ Thomson Avenue, Cambridge CB3 0HE, UK
⋆ Corresponding author; This email address is being protected from spambots. You need JavaScript enabled to view it.
Received:
4
April
2024
Accepted:
11
September
2024
Abstract
Context. One of the surprising early findings with JWST has been the discovery of a strong “roll-over” or a softening of the absorption edge of Lyα in a large number of galaxies at z ≳ 6, in addition to systematic offsets from photometric redshift estimates and fundamental galaxy scaling relations. This has been interpreted as strong cumulative damped Lyα absorption (DLA) wings from high column densities of neutral atomic hydrogen (H I), signifying major gas accretion events in the formation of these galaxies.
Aims. To explore this new phenomenon systematically, we assembled the JWST/NIRSpec PRImordial gas Mass AssembLy (PRIMAL) legacy survey of 584 galaxies at z = 5.0 − 13.4, designed to study the physical properties and gas in and around galaxies during the reionization epoch.
Methods. We characterized this benchmark sample in full and spectroscopically derived the galaxy redshifts, metallicities, star formation rates, and ultraviolet (UV) slopes. We defined a new diagnostic, the Lyα damping parameter DLyα, to measure and quantify the net effect of Lyα emission strength, the H I fraction in the intergalactic medium, or the local H I column density for each source. The JWST-PRIMAL survey is based on the spectroscopic DAWN JWST Archive (DJA-Spec). We describe DJA-Spec in this paper, detailing the reduction methods, the post-processing steps, and basic analysis tools. All the software, reduced spectra, and spectroscopically derived quantities and catalogs are made publicly available in dedicated repositories.
Results. We find that the fraction of galaxies showing strong integrated DLAs with NHI > 1021 cm−2 only increases slightly from ≈60% at z ≈ 6 up to ≈65 − 90% at z > 8. Similarly, the prevalence and prominence of Lyα emission is found to increase with decreasing redshift, in qualitative agreement with previous observational results. Strong Lyα emitters (LAEs) are predominantly found to be associated with low-metallicity and UV faint galaxies. By contrast, strong DLAs are observed in galaxies with a variety of intrinsic physical properties, but predominantly at high redshifts and low metallicities.
Conclusions. Our results indicate that strong DLAs likely reflect a particular early assembly phase of reionization-era galaxies, at which point they are largely dominated by pristine H I gas accretion. At z = 8 − 10, this gas gradually cools and forms into stars that ionize their local surroundings, forming large ionized bubbles and producing strong observed Lyα emission at z < 8.
Key words: galaxies: evolution / galaxies: formation / galaxies: general / galaxies: high-redshift / galaxies: ISM / dark ages / reionization / first stars
NASA Hubble Fellow.
© The Authors 2024
 Open Access article, published by EDP Sciences, under the terms of the Creative Commons Attribution License (https://creativecommons.org/licenses/by/4.0), which permits unrestricted use, distribution, and reproduction in any medium, provided the original work is properly cited.
This article is published in open access under the Subscribe to Open model. This email address is being protected from spambots. You need JavaScript enabled to view it. to support open access publication.
1. Introduction
The first epoch of galaxy formation is believed to have occurred at z ∼ 15 − 20 (Hashimoto et al. 2018; Robertson 2022), some 100 − 200 million years after the Big Bang. This process was primarily driven by the accretion and gravitational collapse of primordial, neutral gas onto dark matter halos (White & Rees 1978; Blumenthal et al. 1984; White & Frenk 1991; Kereš et al. 2005; Schaye et al. 2010; Dayal & Ferrara 2018), which eventually led to the formation of stars in galaxies. The strong ultraviolet (UV) radiation originating from the first stars and supermassive black holes gradually ionized their immediate and then large-scale surroundings, initiating the reionization epoch, which is currently estimated to have ended by z ≈ 5 − 6 (e.g., Stark 2016; Dayal & Ferrara 2018; Keating et al. 2020; Robertson 2022; Bosman et al. 2022; Fan et al. 2023). When these first stars ended their lives as supernovae, the pristine gas was chemically enriched with elements that formed through explosive nucleosynthesis (Hoyle 1954; Cameron 1957; Woosley & Weaver 1995). Charting these independent components, their interplay through the “baryon cycle” (Tumlinson et al. 2017; Péroux & Howk 2020), and their evolution with cosmic time is at the heart of contemporary galaxy formation and evolution studies.
The launch of the James Webb Space Telescope (JWST) (Gardner et al. 2006, 2023) has now enabled us to peer deep into this early cosmic epoch, probing the rest-frame optical and UV emission of galaxies, potentially all the way back to redshifts z ≳ 15 (Castellano et al. 2022; Naidu et al. 2022; Harikane et al. 2023; Atek et al. 2023; Donnan et al. 2023; Bouwens et al. 2023; Wang et al. 2023b; Austin et al. 2023). This leap in near-infrared (NIR) capability now enables detailed characterization of the physical properties and baryonic components of galaxies, reaching the first epoch of galaxy formation, the cosmic dawn. This epoch seems to contain a larger population of more luminous (MUV < −20) and more massive galaxies than expected from theoretical models (Labbé et al. 2023; Finkelstein et al. 2023; Franco et al. 2023; Harikane et al. 2023; Adams et al. 2024; Casey et al. 2024; Bouwens et al. 2023; Chemerynska et al. 2024; McLeod et al. 2024). Various possibilities have been considered to resolve this discrepancy, including a varying initial mass function (IMF; Haslbauer et al. 2022; Trinca et al. 2023, though see Rasmussen Cueto et al. 2024), radiation pressure pushing dust away from star-forming regions (Ferrara et al. 2023), bursty star formation histories (Sun et al. 2023), or an unexpected overabundance of active galactic nuclei (AGN; Inayoshi et al. 2022; Pacucci et al. 2022; Dayal et al. 2024). The apparent discrepancy may be exaggerated by selection biases toward the youngest, most highly star-forming galaxies with more bursty star formation histories at z > 10 (Mason et al. 2023; Mirocha & Furlanetto 2023; Shen et al. 2023), making the galaxies appear temporarily brighter in the UV. As neutral gas accretion is the primary driver and fuel for star formation, a robust measure of this component is key to resolving the debate.
Recent JWST spectroscopic studies have pushed the limit of the most distant galaxies confirmed to z ≈ 11–13 (Curtis-Lake et al. 2023; Wang et al. 2023a; Fujimoto et al. 2023b; Arrabal Haro et al. 2023; Harikane et al. 2024; Zavala et al. 2024; Castellano et al. 2024). The metal content of galaxies during the reionization epoch can now also be readily measured based on direct Te-based methods for sufficiently bright galaxies (e.g., Schaerer et al. 2022; Arellano-Córdova et al. 2022; Taylor et al. 2022; Brinchmann 2023; Curti et al. 2023; Katz et al. 2023; Rhoads et al. 2023; Trump et al. 2023; Heintz et al. 2023a; Nakajima et al. 2023; Sanders et al. 2024) or inferred through rest-frame optical strong-line calibrations (Heintz et al. 2023b; Langeroodi et al. 2023; Curti et al. 2024; Matthee et al. 2023). These observations show a substantial offset from the fundamental-metallicity relation (FMR, Mannucci et al. 2010; Lara-López et al. 2010b; Curti et al. 2020; Sanders et al. 2021) established at z ≈ 0 − 3 by up to 0.5 dex at z > 7 (Heintz et al. 2023b), suggesting copious pristine H I gas inflows onto galaxies at this epoch before chemical enrichment from star formation can catch up to equilibrium (e.g., Torrey et al. 2018). The exact redshift for this transition is still debated (Curti et al. 2024; Nakajima et al. 2023).
Constraining the inflow of neutral, pristine H I gas is key to understanding the assembly of the primordial matter and the buildup of stars and metals in the first galaxies. However, the circumstantial evidence from the FMR for excessive H I gas accretion needs to be corroborated by directly measuring the neutral, atomic hydrogen (H I) – the key missing element in the baryonic matter budget of high-redshift galaxies. Due to the weakness of the hyperfine H I 21 cm line, H I has historically been measured at redshifts z ≳ 2 through Lyman-α (Lyα) absorption in bright background sources such as quasars (Wolfe et al. 1986, 2005; Prochaska & Wolfe 2009; Noterdaeme et al. 2012; Péroux & Howk 2020) or gamma-ray bursts (Jakobsson et al. 2006; Totani et al. 2006; Prochaska et al. 2007; Fynbo et al. 2009; Tanvir et al. 2019; Heintz et al. 2023c). However, these only probe H I in narrow, pencil-beam sightlines and often at large impact parameters. Lyα absorption has also been observed directly in integrated spectra of Lyman-break galaxies at z ≈ 3 (Pettini et al. 2000; Shapley et al. 2003; Steidel et al. 2010; Cooke & O’Meara 2015; Lin et al. 2023), but only in rare, extreme cases.
Recently, Heintz et al. (2024) reported the discovery of extremely strong (NHI ≳ 1022 cm−2) damped Lyα absorption systems (DLAs) in star-forming galaxies at z > 8 (see also Umeda et al. 2023; D’Eugenio et al. 2024; Chen et al. 2023; Hainline et al. 2024a). These seem to represent a galaxy population showing more prominent and substantially more prevalent DLAs than observed in Lyman-break galaxies at z ≈ 3 (e.g. Shapley et al. 2003). The shape of the Lyα damping wings of galaxies had until these discoveries mainly been thought to trace the bulk H I of the intergalactic medium (IGM) at z ≳ 6 (Miralda-Escudé 1998; McQuinn et al. 2008), and had been used to infer the reionization history of the Universe with JWST spectroscopy (Chen 2023; Keating et al. 2023a,b; Umeda et al. 2023). The discovery of these massive interstellar or circumgalactic H I gas reservoirs carry important implications for our study of the early Universe: they constitute the first direct evidence for the mass accretion of primordial intergalactic gas into ordinary galaxies, that is, these DLAs represent the creation of the baryonic component of galaxies. They also strongly affect observations of early galaxies because they change the shape of the Lyα damping wings, altering and complicating inferences on the state of the bulk IGM. Further, they hinder the escape of ionizing photons (Laursen et al. 2011; Verhamme et al. 2015; Steidel et al. 2018; Hu et al. 2023; Hayes & Scarlata 2023), and may also be responsible for the bias in photometric redshifts compared to spectroscopic measurements (Heintz et al. 2024; Finkelstein et al. 2024; Fujimoto et al. 2023a; Hainline et al. 2024b) of galaxies during the reionization era. Their discovery, however, also presents a fortuitous new avenue to directly probe the buildup of pristine H I in galaxies at this critical epoch.
In this work, we systematically characterize these effects by measuring the prevalence and prominence of strong Lyα emission and damped Lyα absorption in a large spectroscopic sample of star-forming galaxies at z = 5.0 − 13.4 observed with JWST/NIRSpec. The observational data for these galaxies are all presented here as part of the DAWN JWST Archive (DJA), which includes fully reduced and post-processed 1D and 2D spectra of all public JWST/NIRSpec data. The large JWST/NIRSpec archive forms the basis of the JWST/NIRSpec PRImordial gas Mass AssembLy (PRIMAL) legacy survey presented here. In this first part of the survey we aim to disentangle the Lyα damping wings produced from H I gas in the immediate surroundings of galaxies (ISM or CGM) from the effects of an increasingly neutral IGM, and establish statistical correlations for these features and the presence of Lyα emission with the physical properties of the galaxies. We further make the reduced spectra, source catalogs, and the spectroscopically derived results for each galaxy in the JWST-PRIMAL sample publicly available on dedicated webpages.
We have structured the paper as follows. In Sect. 2 we present the observations, describe the spectroscopic reduction and post-processing, and outline the JWST-PRIMAL sample compilation. In Sect. 3, we detail the spectroscopic analysis of Lyα, the nebular emission line fluxes and equivalent widths, and the inferred physical properties of the sample galaxies. In Sect. 4, we consider the cosmic evolution of galaxy DLAs and Lyα emitters and quantify the physical correlations driving or hampering the observed Lyα emission and excess damped Lyα absorption. In Sect. 5, we discuss and conclude our work and provide a future outlook. All the spectroscopic data products and the analysis and results presented in this work are made publicly available on dedicated webpages. Throughout the paper, we assume concordance flat ΛCDM cosmology, with H0 = 67.4 km s−1 Mpc−1, Ωm = 0.315, and ΩΛ = 0.685 (Planck Collaboration VI 2020).
2. Observations, data processing, and sample selection
2.1. The DAWN JWST Archive (DJA) – Spectroscopy
The data considered in this work are processed as part of the DAWN JWST Archive (DJA), an online repository containing reduced images, photometric catalogs, and spectroscopic data for public JWST data products1. Here, we detail the spectroscopic data reduction and post-processing only, but see Valentino et al. (2023) for details on the imaging and photometric data. The DJA spectroscopic archive (DJA-Spec) is, at the time of writing, comprised of observations taken from some of the large Early Release Science (ERS), General Observer (GO) and Guaranteed Time (GTO) Cycle 1 & 2 programs, such as CEERS (ERS-1345; Finkelstein et al. 2023), GLASS-DDT (DDT-2756; Treu et al. 2022; Roberts-Borsani et al. 2023) (ERS-1324; Treu et al. 2022), JADES (GTO-1180, 1210, GO-3215; Bunker et al. 2024; Eisenstein et al. 2023), and UNCOVER (GO-2561; Bezanson et al. 2022). Many of the spectra analyzed in this work have been presented in dedicated survey papers cited above and in others (e.g., Arrabal Haro et al. 2023; Atek et al. 2024; Cameron et al. 2023), which also describe the sample selection and observational design of the different programs. With DJA-Spec we reduce and extract all of the spectra from this diverse array of observational programs with a single standardized pipeline.
2.2. DJA spectroscopic reduction and data processing
All data processing is performed with the publicly available GRIZLI (Brammer 2023a)2 and MSAEXP (Brammer 2023b)3 software modules, with the procedure as follows. The spectroscopic analysis begins with reprocessing the individual uncalibrated (uncal) exposures retrieved from the Mikulski Archive for Space Telescopes (MAST) with the JWST https://jwst-pipeline.readthedocs.io/en/latest/jwst/pipeline/calwebbdetector1.htmlcalwebb-detector14. The pipeline is executed with the default parameters, but with snowblind5 run between the jump and ramp_fit steps for improved masking of the bright cosmic ray “snowballs” (Rigby et al. 2023). We remove a column average from the count-rate (rate) files produced by the first step to remove the 1/f noise. We also find that scaling the read noise extension of the calibrated count-rate images by a factor of order ≈1.4 derived separately for each exposure is necessary to explain the variance of pixels in un-illuminated portions of the NIRSpec detectors. The corrected rate files are then run through the https://jwst-pipeline.readthedocs.io/en/latest/jwst/pipeline/calwebbspec2.html pipeline with its default parameters up through the photometric calibration (photom) step. The products at this stage are flux- and wavelength-calibrated 2D spectra for every source indicated with an open shutter in the attached MSA metadata, in a frame cut out from the original detector pixel grid with curved spectral traces. These 2D https://stdatamodels.readthedocs.io/en/latest/api/jwst.datamodels.SlitModel.htmljwst.datamodels.SlitModel cutouts are saved to individual multi-extension FITS files, and it is here that the subsequent processing with MSAEXP departs significantly from the standard JWST pipeline.
The sky background of each source spectrum is removed by taking differences of the 2D cutout spectra taken at different “nod” positions of the telescope. Typically there are three nod offsets that shift the source by  within the MSA slitlet (the so-called 3-Shutter-Slitlet pattern), though the pipeline calculates the groupings automatically to handle other configurations of the heterogeneous archival observations. Average 2D source and sky spectra (and associated variance images) are calculated from exposures at a given nod position and from those at all other offset positions, respectively. We fit a 2D Gaussian profile to the source − sky spectra where the width is the quadrature sum of a free parameter and the wavelength-dependent width of the point spread function estimated from WebbPSF (Perrin et al. 2014)6 and where a centroid shift is fit starting from an initial guess provided by the exposure MSA metadata and the catalog used to design the MSA mask. We note that the distribution of the centroid shifts follows approximately a Gaussian with σNMAD = 0.55 pix (50 mas), which, while consistent with the expected precision of the input catalog astrometry and telescope pointing, is nontrivial and measurable and required for robust extraction of the 1D spectra. The sky-subtracted 2D spectra cutout at different offset positions are combined in a single rectified frame with orthogonal wavelength and cross-dispersion pixel axes by binning with a 2D histogram algorithm. Finally, the one-dimensional spectra and uncertainties are extracted with “optimal” weighting (Horne 1986) using the fitted 2D Gaussian profile. We note that Roberts-Borsani et al. (2024) have recently used the same pipeline presented here and developed for this work, presenting a similar effort to spectroscopically characterize galaxies at z > 5 observed with NIRSpec Prism. We do not perform a photometric correction of the spectra, which is either nonexistent or comprised of a varying depth and filter configuration, but note that both the absolute and color-gradient of the final 1D spectra typically match to within 10 − 15% of the photometric data points, when available (see also Schaerer et al. 2024).
Currently (Apr. 2, 2024) DJA-Spec includes 7,319 individual combined spectra taken with the NIRSpec Prism/CLEAR and 1,665 combined spectra with NIRSpec medium and high-resolution gratings. A full overview can be found on the dedicated webpage7, where the following data are available: best-fit and inspected redshifts, the median signal-to-noise ratios (S/N) of the spectra, grades from visual inspection on the quality of the spectra, Hubble Space Telescope (HST) and JWST/NIRCam imaging thumbnails, and optimally reduced and extracted 2D and 1D spectra. We find that, depending on the survey, ∼60 − 70% secure spectroscopic redshifts can be extracted for the sources in a given mask.
In this work, we focus on the JWST/NIRSpec Prism spectroscopic data from DJA due to the higher continuum sensitivity which is essential for quantifying the evidence for Lyα emission or absorption damping wings. JWST’s NIRSpec Prism configuration covers the entire near-infrared passband from 0.6 μm to 5.3 μm, with a varying spectral resolution from the minimum ℛ ≈ 30 at 1.1 μm to ℛ ≈ 330 in the reddest end (Jakobsen et al. 2022). We have carefully reduced and processed the spectra in DJA in a homogeneous way, limiting any biases between reduction and calibration codes across surveys. Further, this optimizes the consistency and uniformity of the JWST-PRIMAL sample measurements and the DJA-Spec sample as a whole.
2.3. JWST-PRIMAL sample selection
The main objective of this paper is to accurately model the Lyα damping wings and/or measure strong Lyα emission, and spectroscopically derive the physical properties of galaxies during the reionization epoch. For this, we require the following criteria for the sources to enter our archival JWST-PRIMAL sample:
-
A robust, spectroscopic redshift measurement at z > 5.0 from a minimum of one emission line detected at > 3σ (in addition to the Lyα break).
-
An integrated signal-to-noise over the redshifted Lyα and rest-frame UV (1550 Å) regions of S/N > 3.
-
Flux density measurements over the entire NIRSpec Prism wavelength coverage from 0.6 − 5.3 μm.
These criteria ensure that the redshift of the foreground H I gas absorber, from interstellar to intergalactic scales, and the shape of the Lyα line profile can be accurately measured. Further, the requirement of the full spectral coverage enables a full characterization of each source in the JWST-PRIMAL sample, including robust spectroscopic modeling of the stellar continuum and rest-frame UV spectral slope, emission line fluxes and equivalent widths EWs, and direct constraints on the star formation rates (SFRs), metallicities, and ionization parameters for all sources.
In total, 584 sources from DJA-Spec meet these criteria. Fig. 1 shows the absolute UV magnitude, MUV, as a function of redshift for the JWST-PRIMAL sources and compared to the underlying DJA-Spec sample (at z > 2). Table 1 summarizes the target list, including their coordinates, original program and source ID, and emission-line redshifts.
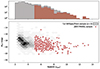 |
Fig. 1. Absolute rest-frame UV magnitude (MUV) as a function of the spectroscopic redshift for the JWST/NIRSpec Prism sources at z > 2 from DJA with robust spectroscopic redshifts (grade 3) shown in gray. The JWST-PRIMAL sources are highlighted by the red squares, selected by requiring zspec > 5.0, an integrated S/N > 3 around the redshifted Lyα wavelength region, and full NIRSpec Prism spectroscopic wavelength coverage from 0.6–5.3 μm as outlined in Sect. 2.3. |
Archival references for the JWST-PRIMAL sample.
3. Analysis and results
Here we detail the spectroscopic measurements derived for the full JWST-PRIMAL sample. We focus on the Lyα damping wings, but also detail the measurements and basic physical properties of the sample galaxies. All the spectroscopically derived quantities are made available on a dedicated webpage8.
3.1. The Lyman-α damping parameter
During the reionization epoch at z ≳ 5, several factors add to the line shape of Lyα on integrated galaxy spectra: They can show strong Lyα emission (LAE; Matthee et al. 2018; Mason et al. 2018; Witstok et al. 2024a), damping wings from an increasingly neutral IGM (Miralda-Escudé 1998; Keating et al. 2023a; Chen 2023), excess continuum flux in the wings related to the size of the immediate ionized bubbles (McQuinn et al. 2008; Castellano et al. 2016, 2018; Fujimoto et al. 2023b; Umeda et al. 2023; Hayes & Scarlata 2023), strong damped Lyα absorption (DLA) from local H I gas (Heintz et al. 2024; D’Eugenio et al. 2024), intrinsic variations due to a changing velocity and density distribution of gas and dust in the ISM and CGM (Dayal et al. 2011; Verhamme et al. 2015, 2017; Gronke et al. 2017; Hutter et al. 2023) or even possibly be dominated by two-photon emission processes (Steidel et al. 2016; Chisholm et al. 2019; Cameron et al. 2024), though see Terp et al. (2024). Many of these effects are degenerate, so we have to disentangle them statistically. For this, we define a new simple diagnostic, which we denote the Lyα damping parameter:
 (1)
(1)
which is the equivalent width (EW) of the transmitted flux density, Fλ over the wavelength region covered by the instrumentally broadened Lyα transition. The continuum flux, Fcont, over the same region is estimated by extrapolating the rest-frame UV slope, βUV, which is derived directly in each spectra from rest-frame 1400 − 2600 Å (see Sect. 3.4 for further details). This approximation of the stellar continuum is generally consistent with models of the continuum flux using galaxy templates (Heintz et al. 2024). We define the integration limits from λLyα,low = 1180 Å to λLyα,up = 1350 Å (rest-frame) to capture most of the damping feature for the most extreme cases and to simultaneously limit the contamination from absorption or emission lines at longer wavelengths. We tested various lower limits and found this to be the bluest wavelength at which information is not lost at the resolution of NIRSpec Prism. We note that for potential strong AGN, there may be a contribution from the N Vλ1238, 1242 doublet emission in this wavelength range. These features are generally not resolved and appear to contribute minimially to the continuum spectra in the majority of sources.
A set of physical models, shown as imprints on the Lyα transmission curves, are visualized in Fig. 2 including: varying ionized bubble sizes from Rb = 1 − 50 cMpc, neutral hydrogen fractions of the IGM from xHI = 0.1 − 1.0, and DLA H I column densities NHI = 1021 − 1022 cm−2, all affecting the shape of the Lyα damping wings. The IGM models are based on the prescription by Miralda-Escudé (1998), using the approximation described in Totani et al. (2006), and the UV bubble sizes are included by varying the upper bound of the IGM integration region, such that zIGM, upper < zgal (e.g., McQuinn et al. 2008). These models are only meant as simply illustrations to guide the interpretation of DLyα. A more careful comparison of the effect of the IGM on the Lyα damping wing and the DLyα measure from simulations is provided in Sect. 5.2. The DLAs with varying H I column densities are derived from the Voigt-profile approximation by Tepper-García (2006). The corresponding Lyα damping parameter DLyα is listed for each model. The UV bubble and DLA models all assume a benchmark IGM fraction of x H I = 0.5, and may therefore vary with the same scatter in DLyα as observed for the IGM-only models.
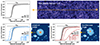 |
Fig. 2. Schematic highlighting the intrinsic physical models affecting the shape of the Lyα transmission from an example galaxy at z = 9.0, all convolved by the nominal JWST/NIRSpec Prism spectral resolution. The default model with xHI = 0.5 is shown at the top left, where the grey-shaded region represents the effect of a partly (xHI = 0.01) to fully neutral (xHI = 1.0) IGM. For illustrative purposes the expected IGM density field at z = 9 is shown in the top right, extracted from the ASTRAEUS simulations. In the bottom panels are shown the combined effects of the default IGM model and various sizes of the ionized UV bubble (left, blue: Rb = 1, 10, 50 cMpc) and DLAs from local H I gas reservoirs (right, red: NHI = 1021, 1022, 1023 cm−2). The integration region for DLyα is marked by the top line in all the Lyα transmission curve figures and is defined to encapsulate all the predicted physical scenarios. |
We derive damping parameters for the full sample in the range DLyα = −400 to 150 Å, with mean and median values for the full sample of 52.6 Å and 59.0 Å, respectively. We define four parameter spaces probing different physical regimes: (i) cases with excess continuum flux suggesting contributions from ionized bubbles or weak LAEs have DLyα = 0–35 Å; (ii) the effect on the Lyα damping wings of an increasing neutral IGM results in DLyα = 35–55 Å; (iii) excess damped Lyα absorption from local H I (with NHI > 1021 cm−2) have DLyα > 55 Å; and (iv) strong LAEs are typically observed with DLyα < 0 Å. Fig. 3 shows three example spectra from the JWST-PRIMAL sample. One shows an example of a broad Lyα damping wing consistent with local H I absorption with DLyα = 61.9 ± 3.6 Å, consistent with NHI ≈ 1022 cm−2. Another shows strong Lyα emission with a measured DLyα = −60.1 ± 8.0 Å.
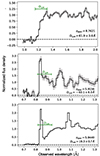 |
Fig. 3. Three examples of normalized NIRSpec Prism spectra from the JWST-PRIMAL sample. The top panel shows an example of a strong DLA from local H I absorption, the middle panel a strong LAE, and the bottom panel a combination of both. The redshifts, DLyα measurements, and DLyα integration regions are highlighted for each case. |
This simple diagnostic now allows us to quantify the number of sources in each distinct population. We caution, however, that the low spectral resolution of the JWST/NIRSpec Prism configuration may conceal weak Lyα emission in the continuum, which requires higher resolution spectroscopy to resolve (see e.g. the case for GN-z11; Bunker et al. 2023). This will likely cause a slight decrease in DLyα. Further, as demonstrated in the bottom panel of Fig. 3, rare cases (≲1% of the sample) that show both a substantial damped Lyα broadening and simultaneously a strong Lyα emission line will not be accurately identified, here with DLyα = 19.3 ± 0.7 Å, misleadingly suggesting mild excess Lyα continuum flux (the continuum flux of this particular source might be dominated by two-photon nebular emission, e.g., Cameron et al. 2024, but see Terp et al. 2024). The JWST/NIRSpec shutter may also not cover the regions of the strongest Lyα emission, thereby underestimating the total Lyα photon output of the target source (Jiang et al. 2023; Ning et al. 2024). The DLyα parameter is thus most powerful in identifying the most extreme cases, such as strong Lyα emitters or galaxy DLAs with NHI > 1021 cm−2, which uniquely have DLyα < 0 Å and DLyα > 50 Å, respectively.
3.2. Line flux measurements
For each source in the JWST-PRIMAL sample, we measure the spectroscopic redshifts from the most prominent nebular emission lines, when detected, including: the [O II] λλ3726, 3729 and [O III] λλ4960, 5008 doublets, [Ne III] λ3870, He Iλ3889, the [S II] λλ6718, 6732 doublet, and the Balmer lines Hα, Hβ, Hγ, and Hδ. The [O II] λλ3726, 3729 and [S II] λλ6718, 6732 doublets are unresolved at all wavelengths in the NIRSpec Prism spectra, whereas the [O III] λλ4960, 5008 doublet is marginally resolved at z ≈ 6 and fully resolved at z ≳ 7.5 due to the increasing spectral resolution with wavelength in this particular configuration. Hα and [N II] λ6585 are unresolved at all redshifts. [Ne III] λ3870 and He Iλ3889 are also generally unresolved, except for the highest redshifts at z ≳ 10. Due to the broad wavelength coverage (0.6 − 5.3μm), Hα and [S II] λλ6718, 6732 can be detected up to z ≈ 7, Hβ and the [O III] λλ4960, 5008 doublet up to z ≈ 9.5, and Lyα can be detected at all redshifts from z ≳ 4. The auroral [O III] λ4363 line is also in the majority of cases blended with Hγ but becomes resolved at z ≳ 9.5, enabling robust measurements of this important transition (Heintz et al. 2024; Hsiao et al. 2023). Unfortunately, the [O III] λλ4960, 5008 doublet is redshifted out of the NIRSpec Prism coverage at approximately the same redshifts, hindering direct Te-based metallicity measurements with the JWST/NIRSpec Prism configuration, except for a narrow redshift range (z ≈ 9.3 − 9.5).
To determine the physical properties of the star-forming regions in each of the target galaxies, we measure or derive upper bounds on the line fluxes for each of these nebular emission lines when covered by the spectra. We fit the continuum around the lines with a simple polynomial and superimpose a set of redshifted Gaussian line profiles at the rest-frame wavelength of each transition and fit for the redshift zspec, line equivalent widths (EWs) and fluxes. The line widths (full-width-at-half-maximum; FWHM) are in most cases directly proportional to the line-spread function of the NIRSpec Prism configuration (Jakobsen et al. 2022) and is modeled as such. For each case, we tie zspec and the FWHM corrected by the spectral resolution, effectively assuming that the nebular emission lines all originate from the same H II regions. An example of the line model fits is shown in Fig. 4. All the main identified lines, their derived line fluxes, or 2σ upper limits, are summarized in Table 2 for the JWST-PRIMAL sample and provided in full online9, which also includes an expanded line list.
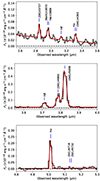 |
Fig. 4. Example of line flux modeling for one of the PRIMAL sources at z = 6.6345. The JWST/NIRSpec Prism spectrum is shown in black and the associated error spectrum in gray. The best fit continuum and Gaussian line model is shown in red. |
Line flux measurements for the most prominent nebular emission lines JWST-PRIMAL sample.
3.3. [O III]+Hβ equivalent widths
A simple diagnostic of the specific star formation rate (sSFR) of galaxies is the emission line [O III]+Hβ EWs. These have been found to increase with increasing redshifts (Khostovan et al. 2016; Endsley et al. 2021; Matthee et al. 2023), and toward lower stellar masses and metallicities (Malkan et al. 2017; Reddy et al. 2018b), due to the more intense ionization fields and active star formation in early galaxies. We derive the [O III]+Hβ EW for each of the sources in our sample that have these lines covered by the spectra (311 sources at z < 9.5). As demonstrated in Fig. 5, we integrate the flux density over the spectral region covering the Hβ and [O III] λλ4960, 5008 lines, normalized by the continuum flux, and correct the redshifted EWs to the rest frame. For each source, we extrapolate the continuum flux at the position of the lines by fitting a set of polynomials to the spectral regions covering the entirety of the line complex.
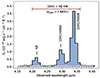 |
Fig. 5. Example of a [O III]+Hβ line equivalent width measurement. The blue-shaded region marks the lines integrated over, also represented by the top red bar. The continuum flux is measured by fitting a linear polynomial to the spectrum on each side of the lines. |
In Fig. 6, we show the [O III]+Hβ EW distribution of the full JWST-PRIMAL sample and divided into redshift bins: z = 5.0–6.0, z = 6.0–7.0, z = 7.0–8.0, and z = 8.0–9.5. The median of the full distribution is 1045 Å, with 16th and 84th distribution percentiles from 356 Å to 2543 Å. We observe no apparent evolution with redshift (p-value is 0.07 from a two-sided KS test between the highest and lowest redshift bins), but note that the number statistics is largely dominated by the lowest redshift bins. We also compare the full distribution to the much larger, albeit photometrically derived distribution from the CEERS survey of galaxies at z = 6.5–8.0 (Endsley et al. 2023). The two distributions are in good agreement, though the peak of the spectroscopic distribution is slightly shifted towards higher EWs. We note that the spectroscopically derived [O III]+Hβ EWs are much more accurate than photometric estimates, however, the latter potentially being underestimated by up to ≈30% (Duan et al. 2023). The fact that EW distribution of the JWST-PRIMAL sample is only slightly shifted, but otherwise follow the same distribution, indicates that there are no strong biases in our spectroscopic sample toward strong emission-line sources from the underlying galaxy population.
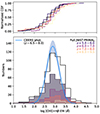 |
Fig. 6. [O III]+Hβ emission line equivalent width distribution (bottom) and normalized cumulative distribution function (top). The full sample up to z ≈ 9.5, where these lines can be detected, is shown by the black step function, and divided into redshift bins as indicated by the colors. The observed distribution of the spectroscopic JWST-PRIMAL sample is compared to the larger photometric CEERS survey results from Endsley et al. (2023). |
3.4. Ultraviolet spectral slopes, magnitudes, and luminosities
The UV spectral slope, βUV, where Fλ ∝ λβUV, of the stellar continuum at wavelengths λrest = 1250–2600 Å encodes key information regarding dust attenuation (Calzetti et al. 1994; Meurer et al. 1999), stellar metallicity (Cullen et al. 2021), the average stellar population age (Zackrisson et al. 2011), and the escape fraction of ionizing photons (Chisholm et al. 2022) from galaxies. The minimum value expected for standard stellar populations with a Galactic IMF and with negligible dust attenuation is βUV ≈ −2.5 (Cullen et al. 2017; Reddy et al. 2018a). Steeper spectral power-law indices of βUV ≈ −3.0 would require a very recent onset of star formation (≲2 Myr) or near-pristine, neutral gas and negligible nebular processing. JWST has enabled measurements of βUV of galaxies at z > 10, hinting at even steeper spectral slopes, particularly for the faintest, less massive systems (Topping et al. 2023; Cullen et al. 2023; Austin et al. 2024). These results have, however, been inferred from photometric data alone, which may be contaminated by varying Lyα or metal emission (or absorption) line strengths or even low-luminosity AGN.
Here, we measure βUV directly from the spectra for each of the JWST-PRIMAL sources at z = 5.0–13.4, carefully masking any identified emission lines or broad Lyα absorption troughs. We use the emcee minimizer within the LMFit framework and recover the parameter covariances to estimate the median and 16th to 84th percentiles of the posterior distributions on βUV and the normalization constant derived at UV 1550 Å rest-frame, mUV of the best-fit model, Fλ = FUV, 1550λβ. An example of one of the model fits is shown in Fig. 7. For our full sample, we recover UV continuum slopes ranging from βUV = −1 down to a few cases with βUV ≲ −3.0. This suggests that this set of rare galaxies are particularly dust- and metal-poor (Zgas/Z⊙ < 1%), have mean stellar populations with ages ≲2 Myr (e.g., Cullen et al. 2024), and likely have ionizing photon escape fractions of ≳10% (Chisholm et al. 2022). In Fig. 8, we show the derived βUV spectral slopes as a function of redshift. We observe a marginal tendency for galaxies to have steeper UV slopes at higher redshifts, though still consistent with a non-evolution within the scatter in the sample distributions. We further note that distribution of dust and H II regions may account for the large scatter in the population around the expected slope for a standard stellar population with negligible dust and maximum nebular continuum contribution (e.g., Calzetti et al. 1994; Vijayan et al. 2024).
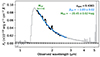 |
Fig. 7. Example of spectral fitting of the UV power-law index, βUV, where Fλ ∝ λβUV, of the stellar continuum. The grey curve shows the full NIRSpec Prism spectrum of a galaxy at z = 9.4383, with the error spectrum shown by the dotted line. The black part of the spectrum highlights the rest-frame fitting region from λrest = 1250 − 2600 Å. The top green bar marks the integration region for the MUV measurements, λ = 1400 − 1700 Å in the rest frame. |
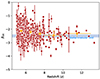 |
Fig. 8. Galaxy UV spectral slope, βUV, as a function of redshift. The red points mark the JWST-PRIMAL sample from this work, and the shown quantities are all derived directly from the NIRSpec Prism spectroscopy. The yellow hexagons show the mean βUV in bins denoted by the horizontal errorbars, and the vertical errorbars represent the 16th to 84th percentile of the distribution in the respective bins. The blue shaded region represents the minimum value βUV = −2.6 to −2.4 for a standard stellar population with negligible dust and maximum nebular continuum contribution (see Sect. 3.4 and Cullen et al. 2024). |
To determine the UV luminosity, LUV, and absolute magnitude, MUV, for each source we derive the flux density and corresponding UV magnitude, mUV at rest-frame 1550 Å from the spectral power-law model. We convert the apparent mUV to the intrinsic, absolute brightness, MUV, via MUV = mUV − μ(z)+2.5 × log(1 + z), where μ(z) is the distance modulus at a given redshift derived from the astropy.cosmology module. The derived MUV for each source are summarized in Table 3, not corrected for potential magnification factors for galaxies drawn from lensing cluster surveys. Our full sample spans absolute UV magnitudes of MUV = −22 to −16 mag, respectively (see Fig. 1).
Spectroscopically derived physical properties of the JWST-PRIMAL sample.
3.5. Star formation rate
The Balmer recombination lines originating from star-forming H II regions, Hα in particular, are robust tracers of star formation on short (≲20 Myr) timescales. The SFR has been found to increase at a given stellar mass (Whitaker et al. 2012; Speagle et al. 2014; Salmon et al. 2015; Thorne et al. 2021; Sandles et al. 2022) and rest-frame UV size (van der Wel et al. 2014; Ward et al. 2023; Langeroodi & Hjorth 2023) for galaxies at increasing redshifts, following the evolution in the peak of the stellar mass halo mass relation with redshift (e.g., Behroozi et al. 2019). The SFR can now be measured directly from the Balmer recombination lines for galaxies at z > 6 with JWST, revealing intense star-forming galaxies during the reionization epoch (e.g., Heintz et al. 2023b; Shapley et al. 2023; Fujimoto et al. 2023a; Sanders et al. 2024; Nakajima et al. 2023; Curti et al. 2024). Given that Hα is only detected for the subset of the sample at z < 7, and may be contaminated by [N II], we instead derive the SFR based on Hβ for the majority of sources at z < 10 as:
 (2)
(2)
following Kennicutt (1998), but here assuming the more top-heavy initial mass function (IMF) from Kroupa (2001), which is likely more representative of the high-redshift galaxy population (e.g., Steinhardt et al. 2023). We derive the Hβ line luminosity via LHβ = FHβ × 4πDL2(z) with DL(z) the luminosity distance at the given redshift and assume fHα/Hβ = 2.86 from the Case B recombination scenario at Te = 104 K (Osterbrock & Ferland 2006). We propagate the uncertainty of ≈20–30% from the exact choice of the IMF in the relation, in addition to the dependence on the electron density and temperature of the H II region which is only of the order ≲5%.
For the sources at z > 10, where Hβ is redshifted out of the NIRSpec Prism spectral coverage, we instead rely on the [O II] λ3727 line strength
![Mathematical equation: $$ \begin{aligned} \mathrm{SFR_{[OII]}} (M_\odot \,\mathrm{yr}^{-1}) = 1.0\times 10^{-41} L_{\rm [OII]} (\mathrm{erg\,s^{-1}}) ~~ (z>10) \end{aligned} $$](/articles/aa/full_html/2025/01/aa50243-24/aa50243-24-eq9.gif) (3)
(3)
again following Kennicutt (1998), and assuming the Kroupa (2001) IMF. For the full sample, we derive SFRs in the range 0.1–100 M⊙ yr−1, not corrected for the relevant magnification factors or dust extinction, as summarized in Table 3. The SFRs can also be derived from overall UV luminosity of the sources following Madau & Dickinson (2014), where
 (4)
(4)
assuming 10% solar metallicity which traces star formation on a longer timescale (∼100 Myr) compared to the Balmer lines (∼10 Myr, see Calzetti 2013). We find that the SFRUV estimate is consistent with that derived from the Balmer recombination lines or [O II] for the full sample, when allowing for up to AV ≈ 0.5 mag of dust attenuation.
3.6. Gas-phase metallicity
One of the most fundamental characteristics of galaxies is their metallicity. This is notoriously difficult to measure directly, in particular for the highest redshift galaxies, motivating the use of strong-line diagnostics of the most prominent nebular emission lines (see e.g. Kewley et al. 2019; Maiolino & Mannucci 2019, for recent reviews). In rare cases, the auroral [O III] λ4363 emission line can be detected directly, which enables Te sensitive measurements of the gas-phase metallicity (known as the direct Te-method), typically quantified as the oxygen abundance, 12 + log(O/H) (e.g., Izotov et al. 2006). This particular feature has now been detected in star-forming galaxies at z > 6 with JWST (e.g., Schaerer et al. 2022; Curti et al. 2023; Heintz et al. 2023a; Nakajima et al. 2023; Sanders et al. 2024), even out to z ≈ 10 (Hsiao et al. 2023; Heintz et al. 2023b, 2024). The auroral [O III] λ4363 line feature, however, will only be resolved from Hγ in the minority of sources due to the increasing spectral resolution towards the red end of the spectra.
We therefore base our main metallicity measurements on strong-line calibrations. To preserve the homogeneity of the measurements, we use a single set of line diagnostics from Sanders et al. (2024) for the different line ratios, derived for galaxies at z = 2–9 through the direct Te-method. Specifically, we consider the strong-line ratios: O3= [O III] λ5008/Hβ, O2= [O II] λ3727/Hβ, R23= ([O III] λλ4960, 5008 + [O II] λ3727) / Hβ, Ne3O2= [Ne III] λ3870 / [O II] λ3727, and O32= [O III] λ5008/ [O II] λ3727, which are available at most of the targeted redshifts. Based on the line-flux measurements and errors (representing the likelihood distributions of fluxes), we construct the probability density function (PDF) for each diagnostic ratio where the width denotes the scatter in the relation. We then combine the PDFs from the available calibrations, inversely weighted by their scatter, for each individual source to determine the gas-phase metallicity through the median and 16th to 84th percentiles of the joint PDF, as illustrated in Fig. 9. This more conservative approach takes into account the added uncertainty from sources with potential high ionization parameters, typically quantified via O32, thus minimizing the uncertainty from assuming a single line-ratio.
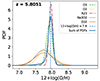 |
Fig. 9. Example of joint gas-phase metallicity estimate for one of the sources. The blue-colored function shows the normalized joint probability density function (PDF) based on the normalized PDFs of the individual line-ratio diagnostics from Sanders et al. (2024). The blue dashed line marks the median of the joint PDF. |
We derive gas-phase metallicities ranging from 12 + log(O/H) = 6.5 to 8.2, corresponding to 0.6% to 30% of solar abundance, respectively (given 12 + log(O/H)⊙ = 8.69; Asplund et al. 2009). The relevant line fluxes used for these measurements are provided in Table 2 and the derived metallicities are listed for each source in Table 3.
4. Lyman-α emission and absorption in galaxies during the reionization epoch
With the spectroscopically derived physical properties for the full set of JWST-PRIMAL sample sources we can now investigate and chart the redshift evolution and the physical driver of strong galaxy DLAs produced by massive H I gas reservoirs to prominent ionized bubbles and Lyα emission during the reionization epoch.
4.1. Charting DLyα as a function of redshift
To obtain a first overview of the prevalence and prominence of DLAs and LAEs across time in the reionization epoch, we show DLyα as a function of redshift for the full sample in Fig. 10. This represents the evolution from z = 13.4 to z = 5.0, corresponding to approx. 300 Myr to 1 Gyr after the Big Bang. The DLyα parameter space has been color-coded to highlight the regimes driven by the physical models for the expected dominant contribution to the observed Lyα transmission curve. The number statistics of sources located in each region are summarized in Table 4, divided into redshift bins of z = 5.0–6.0 (354 sources), z = 6.0–7.0 (169), z = 7.0–8.0 (103), z = 8.0–10.0 (46), and z = 10.0–13.4 (17).
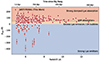 |
Fig. 10. Lyα damping parameter, DLyα, for the full JWST-PRIMAL sample as a function of redshift. The corresponding age of the Universe assuming the cosmological parameters from Planck Collaboration VI (2020) is given at the top. The colored backgrounds indicate the typical physical regimes probed for a given DLyα: Strong Lyα emission (DLyα < 0 Å; blue), extended ionized bubbles or weak Lyα emission (DLyα = 0–35 Å; orange), IGM absorption from xHI = 0–1 (DLyα = 35–55 Å; green), and strong galaxy integrated DLAs with NHI > 1021 cm−2 from local H I gas (DLyα > 55 Å; red). |
Lyα absorption vs. emission statistics.
We find that there are 56 strong LAEs in the full JWST-PRIMAL sample (i.e., 8%), based on DLyα < 0 Å. None of these are found at z > 9. At z < 8, we find that 46 out of 533 of sources show strong LAEs (9%) in approximately equal fractions from z = 5.0–6.0, z = 6.0–7.0, and z = 7.0–8.0, albeit with the most prominent LAEs quantified by the lowest DLyα at z < 7. This fraction of LAEs could be as high as ≈20 − 25% if we include all sources with excess Lyα flux as potential weakly emitting LAEs. These results are slightly lower than found previous literature studies, showing a typical fraction of LAEs of ≈30% at z ≈ 6–8 (e.g., Saxena et al. 2023; Nakane et al. 2023; Simmonds et al. 2023; Witstok et al. 2024a; Jung et al. 2023; Jones et al. 2024; Witten et al. 2024; Napolitano et al. 2024). However, they were also found to be much more sparsely populated beyond z ≳ 8 (though see Tang et al. 2023; Bunker et al. 2023; Fujimoto et al. 2023b; Witstok et al. 2024b), consistent with our results, and as also recovered by simulations (Hutter et al. 2023). We caution that the presence or fraction of LAEs are typically reported based on the intrinsic Lyα line EW, LyαEW,0 ≳ 20 − 25 Å, which likely causes the observed discrepancy. These findings would also naturally explain the null detections of LAEs at z = 8.8 in large photometric surveys using narrow-band imaging such as the UltraVISTA (e.g., Laursen et al. 2019).
Similarly, we consider the redshift evolution of strong DLAs, here classified as sources with DLyα > 55 Å, corresponding to H I column densities NHI ≳ 1021 cm−2. Here, we exclude the strong LAEs to avoid biasing the result due to the known redshift evolution of the fraction of LAEs as also recovered here. We find that the fraction of galaxy DLAs only slightly increases from ≈55% at z ≈ 5 − 6 up to ≈65–90% at z > 8. A similar conclusion is reached by Umeda et al. (2023), who find an ubiquitous presence of extremely strong DLAs (NHI ≳ 1022 cm−2) at z > 10. This evolution is more clearly highlighted in Fig. 11 where we show the histograms of DLyα for the five different redshift ranges, demonstrating higher prevalence of galaxy-integrated DLAs at increasing redshifts. These results are in sharp contrast to previous studies of Lyman-break galaxies near the peak of cosmic star formation at z ∼ 2–3 (Pettini et al. 2000; Steidel et al. 2010), where only a small subset of the population (< 25%) show integrated galaxy line-of-sight H I column densities of NHI ≈ 3 × 1020 cm−2 (Shapley et al. 2003). This corroborates our findings here of an increasing probability of having high H I column densities or larger fraction of DLAs at higher redshifts, down to z ≈ 2–3. This may indicate that we are probing the epoch of first-galaxy assembly with excessive amounts of accreting or overdense pristine H I gas that are yet to be processed into stars or ionized by the first stellar sources. Indeed, the average gas mass density of galaxies have been inferred to increase by an order of magnitude through accretion from z = 10 to 6 (see Walter et al. 2020; Heintz et al. 2022, and Sect. 5 for further discussion). Fig. 11 also demonstrates an excess of galaxies with strong LAEs (DLyα < 00 Å) at z = 5.0–6.0 from the full distribution, distinct for the epoch when the universe is fully ionized.
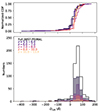 |
Fig. 11. Histogram of the Lyα damping parameter, DLyα, distribution (bottom) and normalized cumulative distribution function (top). The full JWST-PRIMAL sample is represented by the black step function, and divided into sub-bins according to their redshift as indicated by the colors. Strong DLAs are more prevalent in galaxy spectra at increasing redshift. |
We note that the fraction of ≳70% galaxy DLAs at z > 9 may be a lower bound, given that our selection criteria on the S/NLyα will preferentially be biased towards strong Lyα emission. On the other hand, fainter, less massive sources are likely to have stronger Lyα EWs (Saxena et al. 2024) and contribute to most of the ionizing photons (Lin et al. 2024). To investigate this, we compare DLyα to the spectroscopically derived MUV in Fig. 12. We confirm the trend of the intrinsically faintest sources showing the highest Lyα EWs, with the strongest LAEs with DLyα < −100 Å showing luminosities predominantly at MUV > −19 mag. This further suggests that the large H I gas overdensities are preferentially located close to bright, massive sources. In the following sections, we further investigate the underlying physical properties driving the prevalence and prominence of strong Lyα emission and absorption in these reionization era sources.
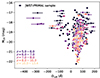 |
Fig. 12. Absolute UV brightness, MUV, of the JWST-PRIMAL sources as a function of DLyα. The sources with the highest Lyα EWs (negative DLyα) are observed to represent the UV faintest galaxy population at z > 5. |
4.2. The role of stellar ionization fields on Lyα emission and absorption
The intense UV radiation fields produced by younger, more massive stars are likely to play a key role in the ionization of H I and the production and escape of Lyα photons. To test this and quantify it in terms of our observations, we compare DLyα to two common tracers of active star formation and high ionization: The [O III]+Hβ EW, and the ionization parameter O32 = [O III] λ5008 / [O II] λ3727 in Fig. 13. We find no apparent correlations between DLyα and any of the two quantities. For example, strong galaxy DLAs are observed in galaxies spanning the entire dynamical range of [O III]+Hβ EWs and O32 ionization. Similarly, strong LAEs are observed in galaxies spanning [O III]+Hβ EWs of 100 − 104 Å, and are not directly associated with sources with high or low O32 ratios. This is at odds with studies of local “green pea” galaxies at z ≈ 0, believed to be robust analogs to high-z star-forming galaxies, that find that larger Lyα emission EWs and escape fractions are commensurate with higher, more intense stellar ionization fields (Yang et al. 2017; Jaskot et al. 2019; Hayes et al. 2023). We note, however, that the galaxies at z > 8 predominantly show high DLyα absorption and O32 ionization and instead typically represent the large-scale environment or H I gas covering fraction at these redshifts. Consequently, our results disfavor a scenario where the H I abundance (or the lack thereof) is driven by the ionization output of the stellar sources in the galaxy.
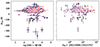 |
Fig. 13. Correlations of DLyα with the galaxy properties that represent the average the specific SFR ([O III]+Hβ EW, left), and the intensity of the stellar ionization field (O32 = [O III] λ5008 / [O II] λ3727, right). The square symbols show the JWST-PRIMAL sources at z < 9.5, where [O III] can be detected, and a color-coded according to their redshift (identical to Fig. 12). |
4.3. Gas-phase metallicity and Lyα absorption and emission
The gas-phase metallicity of galaxies is one of the key regulators of the gas cooling efficiency, the ionization state of the gas, and the escape fraction of Lyα and LyC photons. Lower metallicities are often associated with higher ionization and temperatures, effectively reducing the observed line-of-sight H I column density. By contrast, high metallicity and likely thereby also high dust content, will enable less efficient ionization of H I and as a consequence more efficiently scatter the output ionizing photons, effectively suppressing the intrinsic and observed escape fraction of Lyα photons (Dayal et al. 2011; Henry et al. 2015; Dijkstra et al. 2016; Verhamme et al. 2017; Yang et al. 2017; Izotov et al. 2018; Jaskot et al. 2019). We therefore expect a strong correlation between the gas-phase metallicity and DLyα for our high-redshift sample sources.
To test this scenario, we show DLyα as a function of gas-phase metallicity, 12 + log(O/H), for each of the sources in the JWST-PRIMAL sample in Fig. 14. The strongest LAEs (DLyα < 0 Å) are predominantly observed in galaxies with low metallicities, and ubiquitously found at 12 + log(O/H) < 7.7, corresponding to < 10% solar metallicity. These results are consistent with the expectations that prominent Lyα emission can only escape from low-metallicity systems. By contrast, we find that galaxies with strong DLAs (DLyα > 50 Å) span the entire dynamical range of inferred metallicities, 12 + log(O/H) = 6.5–8.2 (i.e. 0.6–30% solar).
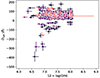 |
Fig. 14. Gas-phase metallicity, 12 + log(O/H), as a function of the Lyα damping parameter, DLyα. The strength of the Lyα absorption is observed to increase with increasing metallicity, whereas Lyα emission is most efficiently produced or allowed to escape in low-metallicity galaxies. |
4.4. The impact of galaxy DLAs on the reionization history
One of the major implications of high H I-cloumn density DLAs observed in galaxy-integrated spectra at z ≳ 6 is their effect on the escape fraction of Lyα and LyC photons, key to constrain the reionization history and topology. Numerical modelling and reionization simulations have previously only taken IGM absorption into account when predicting the radiative transfer and transmission of Lyα (e.g., Laursen et al. 2019; Hutter et al. 2023). These overabundant local H I gas reservoirs are likely to be the main component in the transfer of ionizing photons, at least in the early evolutionary stages of galaxies, so quantifying this additional local ISM or CGM absorption is vital to draw robust conclusions and physically interpret the output and impact of galaxy-wide DLAs in simulations.
To gauge this effect, we first compare DLyα to the βUV spectral slopes of each galaxy in Fig. 15. βUV has been found to be strongly correlated with the escape fraction of Lyman Continuum (LyC) photons,  , in low-redshift galaxy samples (Chisholm et al. 2022; Flury et al. 2022) and for a small, LyC-leaking region in the Sunburst arc at z = 2.4 (Kim et al. 2023). We color-grade the βUV parameter space with the empirical relation presented in their paper Chisholm et al. (2022, their Eq. 11), highlighting the inferred escape fractions from
  to 50%. We find no apparent correlations between βUV or the inferred
  with the strength of the Lyα emission or DLA absorption. This indicates that the hardness of the UV spectral shape is not the main driver of the ionization of H I, and that larger H I abundances do not translate directly into lower escape fractions of ionizing photons. This is somewhat at odds with theoretical predictions and local observations, since both Lyα and LyC photons are affected by resonant scattering from abundant interstellar or circumgalactic H I gas columns (e.g., Flury et al. 2022; Xu et al. 2022; Begley et al. 2024), though other recent high-redshift results confirm the same scenario (Napolitano et al. 2023; Saxena et al. 2024). We caution, however, that the relations for
  derived from the local galaxy sample at z ≈ 0.3 studied by Chisholm et al. (2022) may not be universally representative for galaxies at z ≳ 6 (Choustikov et al. 2024; Pahl et al. 2024). Since the high-z galaxy population show even more abundant H I gas reservoirs than galaxies at equivalent metallicities or O32 ionization parameters (Heintz et al. 2024), the escape fraction of Lyα and LyC photons is likely correspondingly lower. Indeed, comparing the sources from Chisholm et al. (2022) that are mostly absorbed by the neutral H I gas, the inferred LyC escape fraction could be ∼10× lower.
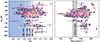 |
Fig. 15. Comparison of DLyα to the spectral βUV slope (left) and the ionizing photon production efficiency, ξion (right). The JWST-PRIMAL sources are shown by the red squares and color-coded according to redshift (identical to Fig. 12). The light- to dark-blue colored regions in the left panel indicates increasing escape fractions of LyC photons, |


To more directly relate the amount of photons capable of ionizing H I to the presence and strength of Lyα emission or DLAs, we also compare the ionizing photon production efficiency, ξion, to DLyα in Fig. 15. ξion can be derived through the Balmer recombination line strengths, such as Hβ, since these accurately trace the ionizing photon production rate from massive stars on short (≲10 Myr) timescales (Bouwens et al. 2016). Following Matthee et al. (2023), we define
 (5)
(5)
where cHβ = 4.86 × 10⁻¹³ erg is the Hβ line-emission coefficient, assuming a Case B recombination scenario with Te = 104 K (e.g., Schaerer 2003). We find from Fig. 15 that galaxies with strong DLAs (DLyα > 50 Å) occupy most of the probed ξion parameter space, though with a median of log(ξion/Hz erg−1) = 25.55, higher than the canonical values, log(ξion/Hz erg−1) = 25.1 − 25.3 (Robertson et al. 2013; Atek et al. 2024). The large scatter in ξion at DLyα > 50 Å could indicate bursty star formation, particularly since ξion traces massive O-stars, and may reflect typical younger stellar populations that are yet to ionize the neutral H I gas in their local surroundings. By contrast, galaxies that are strong LAEs tend to exhibit high ionizing photon production efficiencies, occupying the region with log(ξion/Hz erg−1) > 25.5, higher than the canonical value. Since these are predominantly found at z < 8, we argue that it is mainly this particular subset of galaxies with high ξion and late in the reionization epoch that provides the strongest contribution to this last phase transition.
5. Discussion
To place our results into context of the large-scale efforts to quantify the galaxy mass assembly and reionization timeline, we describe in this section a physical scenario connecting the observed prevalence and prominence of Lyα emission and DLA absorption from abundant, pristine H I gas in galaxies through redshift and as a function of their intrinsic physical properties. We further quantify the effect on DLyα from the neutral hydrogen fraction based on more sophisticated IGM simulations and estimate the effect of strong galaxy DLAs on photometric redshifts measurements at z > 8, which appear to be systematically overestimated.
5.1. H I gas assembly and reionization across cosmic time
In this work, we quantified the strength of DLA absorption (Lyα emission) via the positive (negative) strength of DLyα. We found that galaxies with high DLyα, indicating substantial H I gas column densities in the ISM or CGM of galaxies, are ubiquitously observed at z > 9 and in galaxies spanning the entire dynamical range of physical properties probed here. The fact that there appears to be no correlation between the amount of local H I gas (or the lack thereof) and the ionizing output of the galaxies themselves may suggest that DLAs trace particularly young galaxies, at all redshifts, that are yet to ionize the surrounding H I gas or convert it into molecules and eventually stars. For galaxies with DLyα > 50 Å, equivalent to NHI > 1021 cm−2, the absorbing H I gas is completely self-shielding of ionizing photons, even with substantial clumping with density variations down ΔNHI ≈ 10−3 supporting this scenario.
On the contrary, strong LAEs are only observed at z ≲ 8. This indicates that only after z ≈ 8 − 9, on average, is the surrounding large-scale IGM sufficiently ionized for a prominent fraction of Lyα photons to escape. Indeed, the observed redshift evolution of DLyα is in good qualitative agreement with the evolution of the Lyα escape fraction, as compiled by Saxena et al. (2024), Hayes & Scarlata (2023). Consequently, this favors more late and rapid reionization models (e.g., Naidu et al. 2020), over a smooth, early transition (e.g., Finkelstein et al. 2019). A similar rapid evolution seems to be suggested by damped Lyα wings in quasar spectra (Greig et al. 2017, 2019; Davies et al. 2018; Bañados et al. 2018; Yang et al. 2020; Wang et al. 2021; Ocvirk et al. 2021; Ďurovčíková et al. 2020, 2024) and Lyα emission statistics of galaxies (Ouchi et al. 2010; Sobacchi & Mesinger 2015; Mason et al. 2018, 2019), indicating a near-fully neutral IGM at z ≈ 8.
The strong LAEs are predominantly associated with UV faint (MUV > −19 mag) galaxies with high ionizing photon production efficiencies, log(ξion/Hz erg−1) > 25.5. This could either indicate that these particular systems were the most efficient at ionizing their immediate surroundings, or that viewing angles play a larger effect at low (z < 8) redshifts compared to their higher redshift counterparts. In this scenario, galaxies at z > 8 are deeply embedded into dense, neutral gas overdensities with large covering fraction, showing strong absorption independent of the viewing angle. At lower redshifts, low-density NHI channels are carved by ionizing photons and we thus observe a broader span in DLyα at z < 8. This scenario would be commensurate with the non-dependence of the strength of LAEs with the O32 ionization parameter, [O III]+Hβ EW, the βUV spectral slope and the inferred escape fraction of LyC photons. In fact, strongly directionally dependent escape of ionizing radiation has been proposed by simulations (Cen & Kimm 2015; Rosdahl et al. 2022; Yeh et al. 2023). Since only ≈10 − 20% of the galaxies at z < 8 have strong LAEs, we argue that it is either this particular subset of faint, low mass galaxies that drive reionization or that ionizing photons from galaxies at this epoch will only be able to escape through the ≲20% low-density sightlines.
5.2. Insights into the DLyα parameter from simulations
So far, the IGM regime of DLyα has been investigated assuming a homogeneously ionized IGM with an average value of the ionized fraction xHI everywhere. It is therefore interesting to investigate how the DLyα parameter evolves in simulations of patchy reionization, to better understand the allowed range of DLyα and what some limitations may be.
Attenuation by the intergalactic medium is expected to play a significant role in regulating visibility of Lyα emission until the Universe was fully reionized (McQuinn et al. 2007), and will impact the DLyα parameter to some extent over all of the regimes identified in Fig. 10. A full comparison of observed and simulated DLyα across the whole parameter space would therefore require detailed modelling of the redshift evolution of ionized bubbles, as well as the detailed shape and of the Lyα emission profile (e.g., Hayes & Scarlata 2023). We instead focus here on identifying the allowed range of DLyα for which attenuation by the IGM dominates the measurement. We measure DLyα from IGM transmission spectra normalized by the continuum, i.e., with no contribution from Lyα emission.
First, we show how the Lyα transmission curves change based on the residual fraction of H I inside an ionized bubble. As discussed in several works, even a small amount of neutral gas can completely saturate absorption of the Lyα forest (Mesinger & Haiman 2007; Mason et al. 2018; Keating et al. 2023a). The difference in accounting for this residual neutral gas is shown in Fig. 16, which shows IGM transmission curves calculated using the Miralda-Escudé (1998) analytic model. In the top left panel, the bubbles are assumed to be completely ionized, allowing for transmission on the blue side of Lyα. When this neutral gas is accounted for, a sharp cutoff in IGM transmission blueward of the Lyα emission is observed. The bottom panel shows the same transmission profiles, but now convolved with the NIRSpec PRISM instrumental profile. It is difficult to statistically disentangle the difference between the models with different bubble sizes once the residual H I is included.
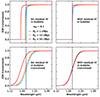 |
Fig. 16. Impact of considering residual neutral hydrogen on IGM transmission curves for models with ionized bubble sizes of 1 cMpc (blue), 10 cMpc (orange) and 50 cMpc (red) and a volume-averaged IGM neutral fraction xHI = 0.1 at redshift 9. The vertical black dashed line marks the observed Lyα wavelength at this redshift. The left column shows IGM damping wings calculated using the Miralda-Escudé (1998) model, assuming that the bubbles are completely ionized. The right column shows the effect of accounting for a small amount of residual neutral gas in the bubbles, which can completely saturate the absorption in the Lyα forest. The top panel shows the models before convolving with the NIRSpec PRISM instrumental profile and the bottom panel shows the models after convolution. |
Based on these results, we estimate an allowed range of IGM-dominated DLyα parameters, shown in Fig. 17. The lower value of DLyα is given by a step function, where there is no transmission blueward of Lyα and complete transmission redward of LyαṪhis mimics the limit of large bubbles containing a small amount of residual H I. The upper value of DLyα is calculated from the Miralda-Escudé (1998) analytic model assuming the Universe is completely neutral and assuming a bubble size Rb = 0 cMpc. We see that the maximum value of DLyα grows with redshift, due to the evolution of the mean density of the Universe (Keating et al. 2023b).
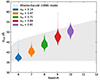 |
Fig. 17. Redshift evolution of the damping parameter for continuum-normalized spectra dominated by IGM absorption. The grey shaded region shows the range of damping parameters calculated from a step function at the observed Lyα wavelength (which sets the lower limit) and the IGM damping wing calculated using the Miralda-Escudé (1998) model in a completely neutral Universe (which sets the upper limit). The colored violin plots represent the distribution of damping parameters measured from IGM damping wings generated from the Sherwood-Relics simulation of an inhomogeneously reionized IGM as presented in Keating et al. (2023a). The volume-averaged H I fraction xHI for each simulation snapshot is indicated in the legend. |
For comparison, we also measure IGM-dominated DLyα parameters directly from damping wings constructed from a simulation of inhomogeneous reionization. We use the spectra presented and described in Keating et al. (2023a), which were generated from sightlines through a simulation from the Sherwood-Relics simulation suite (Puchwein et al. 2023). We analyze results from five snapshots from this simulation at z = 6 − 10. The distributions of DLyα parameters we measure are shown as the violin plots in Fig. 17. We find that the range of allowed IGM DLyα parameters is well captured by the grey shaded region we defined. At z = 6, some sightlines have smaller DLyα parameters as the Lyα forest starts to show transmission at this redshift. At z = 10, some sightlines have larger DLyα parameters due to effects not captured in the analytic model for IGM damping wings, such as dense clumps of gas close to the host halo or the effect of infalling material. In general, however, the range of DLyα parameters for which the reionization of the IGM plays a dominant role are in good agreement with the range of DLyα = 35–50 Å as defined in Section 3.1. However, we note that the IGM will also play an important role in regulating the fraction of flux transmitted by galaxies showing evidence of Lyα emission, and hence falling into the regime of smaller values of DLyα.
5.3. The effect of Lyα damping wings on high-z photometric redshift estimates
Some of the first efforts to photometrically identify high-redshift galaxy candidates seemed to generally overpredict their redshifts when compared to the subsequent spectroscopic redshift determination of the sources at z > 8 based on strong nebular emission lines (e.g., Finkelstein et al. 2024; Fujimoto et al. 2023a; Hainline et al. 2024b; Steinhardt et al. 2023; Serjeant & Bakx 2023). In Heintz et al. (2024), we proposed that this may due to the strong damping wings observed in the large fraction fraction of galaxies at these redshifts, suppressing the derived flux density in the blue-most photometric bands and thereby mimicking a slightly larger Lyα “break redshift” (e.g., Arrabal Haro et al. 2023).
To test this, we show the derived photometric redshifts for the subset of sources where these are available in the DJA (Valentino et al. 2023)10 relative to the spectroscopically derived redshifts in Fig. 18. We find that the photometric redshifts are systematically overestimated for galaxies at z > 8, with median zphot − zspec = 0.11. Considering only the galaxies with strong DLAs (DLyα > 50 Å) the discrepancy become slightly larger, with median zphot − zspec = 0.15. To optimize future photometric redshift estimates, the effects of strong Lyα damping wings needs to be incorporated into spectral energy distribution fitting algorithms such as EAZY (Brammer et al. 2008).
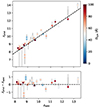 |
Fig. 18. Photometric redshift, zphot, estimates relative to the spectroscopic redshifts, zspec, for the JWST-PRIMAL sample at z > 8. The sources are color-coded as a function of DLyα, as indicated by the colorbar. The photometric redshifts systematically overpredicts the actual spectroscopically derived redshifts with median zphot − zspec = 0.11 (zphot − zspec = 0.15 for DLyα > 50 Å). |
6. Summary and future outlook
In this work, we have compiled and systematically characterized 584 sources observed with JWST/NIRSpec during the reionization epoch, at z = 5.0–13.4, introducing the JWST-PRIMAL archival legacy survey. The main goal was to statistically quantify the presence and redshift evolution of strong damped Lyα absorption in galaxies, signifying abundant local H I gas reservoirs. To disentangle these systems from sources with damping parameters probing mainly a largely neutral IGM, or residing in extended ionized bubbles, we defined a new simple diagnostic, the Lyα damping parameter, DLyα. This allowed us to statistically chart the H I gas assembly history, the onset and prevalence of strong Lyα-emitting galaxies and to explore the main underlying physical properties driving the emission and escape of ionizing and Lyα photons.
We found that the majority (≈65 − 90%) of galaxies at z > 8 are dominated by large H I gas reservoirs in their local surroundings (ISM or CGM) with galaxy-integrated H I column densities, NHI > 1021 cm−2. These strong galaxy DLAs appear to exist throughout the reionization epoch, even though the fraction was observed to decrease to ≈60% by z = 6 of the overall galaxy population. Similar H I column densities have been theoretically predicted from cosmological simulations (e.g., Finlator et al. 2018; D’Odorico et al. 2018; Pallottini et al. 2022). Further, we found that these strong DLA galaxies represent a large variety of intrinsic physical properties in terms of their UV luminosity, gas-phase metallicity 12 + log(O/H), UV spectral slope βUV, nebular [O III]+Hβ line EWs, O32 ionization parameters, and ionizing photon production efficiency, ξion. We thus surmised that strong galaxy DLAs are a sign of early galaxies in the process of formation, actively accreting and assembling large amount of primordial H I gas, that are yet to be ionized or processed into molecular gas and stars.
From the measured redshift evolution of DLyα we were able to quantify the onset and increasing strength of Lyα, enabling us to decode the reionization history directly. We found that at z ≈ 8–10 galaxy spectra mainly probe a substantially neutral CGM, whereas evidence for low Lyα escape or significant ionized bubbles around these galaxies were only observed at later cosmic times (z < 8). The fraction of LAEs was estimated to be ≈20% at z = 6. The strongest LAEs at z > 7 have been found to reside in particular overdense or ionized regions (Saxena et al. 2023; Witstok et al. 2024a; Witten et al. 2024). From theoretical considerations and cosmological simulations (Pallottini et al. 2022), we expect most of the galaxies studied here to be formed within the first 200–300 Myr of cosmic time at z ≈ 18–14 and rapidly build up their stellar mass and on-going star formation via substantial H I gas accretion and assembly. Over the next 100–300 Myr, down to z = 8 − 100,
The emergence of these sources showing strong “roll-overs” near the Lyα edge in the first era of JWST/NIRSpec Prism spectra have important practical implications for future studies and observations: First, they complicate statistical inferences of the reionization history by tracing the increasing neutral fraction of the IGM from galaxy damping wing measurements (Keating et al. 2023a). Here, we provided the first step forward to statistically model the galaxy DLA population which will eventually be possible to remove to uncover the underlying IGM damping effects. Second, the first efforts in photometrically identifying high-redshift galaxy candidates seemed to show a systematic positive offset in zphot − zspec towards higher redshifts (Finkelstein et al. 2024; Fujimoto et al. 2023a; Hainline et al. 2024b; Steinhardt et al. 2023; Serjeant & Bakx 2023). This may naturally be explained by the increasing fraction of galaxies with stronger Lyα damping wings at higher redshifts. This we quantified here and estimated a mean of 0.2 dex overestimations of the photometric redshifts of galaxies at z > 8. This effect would need to be incorporated into photo-z codes to optimize the accuracy on the zphot priors for the earliest galaxy population.
The next natural avenues to explore the early galaxy DLAs in more depth are to examine the effect of clustering, their correlations with physical sizes and SFR surface densities, and the H I gas content; a potential cause of the observed offset in the otherwise fundamental-metallicity relation (FMR). Similar to how strong LAEs are typically found to reside in high-density groups of galaxies, galaxy DLAs may trace overdense regions via their early assembly of H I. Moreover, the subset of galaxies showing strong DLAs integrated over their relative small UV sizes indicate exceptional dense gas surface densities (Kennicutt & Evans 2012). This, in combination with the inferred SFRs, may be key to understand the intense star formation and bright UV luminosities of early z > 9 galaxies (e.g., Finkelstein et al. 2023; Franco et al. 2023; Harikane et al. 2023; Adams et al. 2024; Casey et al. 2024; Bouwens et al. 2023; Chemerynska et al. 2024; Mason et al. 2023; McLeod et al. 2024). Finally, the discovered offset from the FMR towards lower metallicities of galaxies at z = 7–10 have been interpreted as evidence for excessive pristine H I gas inflow (Heintz et al. 2023b), which have later been confirmed with larger galaxy samples, though the exact redshift for this transition is still debated (e.g., Curti et al. 2024; Nakajima et al. 2023). This scenario will be possible to test directly by correlating the H I column densities of galaxies to their offset from the FMR, moving the 3D plane of galaxy properties to 4 dimensions. Obtaining higher-resolution spectroscopic data of these sources will further help quantifying the H I covering fraction and disentangle the effects on the Lyα transmission curve from weak Lyα emission to extended ionized bubbles and expand the probed physical properties to include the electron densities and temperatures of the gas.
While previous efforts with ALMA to quantify the H I gas mass content using far-infrared tracers such as [C II]−158μm and [O I]−63, 145μm have been successfully applied to galaxies in the epoch of reionization (Heintz et al. 2021, 2022; Vizgan et al. 2022; Liang et al. 2024; Wilson et al. 2024), the results presented here provide the most direct and statistical census of the abundance and assembly of the primordial H I gas in early Universe. This naturally paves the way and provide an important benchmark for next-generation radio facilities, targeting H I of the first galaxies through the 21-cm transition, such as the square kilometre array (SKA; Dewdney et al. 2009).
JWST pipeline version 1.12.5; CRDS_CONTEXT = jwst_1180.pmap
The wavelength-dependent PSF is included in the MSAEXP repository.
Available at https://dawn-cph.github.io/dja/imaging/v7/
Acknowledgments
We would like to thank the referee for a detailed and constructive report, greatly improving the presentation of the results in this work. We would like to thank Peter Jakobsen for his vision and heroic endeavor in optimally designing the JWST/NIRSpec instrument and some of its first on-sky observations and for enlightening discussions about the intricacies of the NIRSpec data. Further, we would like to thank John Chisholm for helpful clarifications and discussions related to the escape fraction of ionizing photons and Aayush Saxena for enlightening conversations on the escape and absorption of Lyman-α photons. This work has received funding from the Swiss State Secretariat for Education, Research and Innovation (SERI) under contract number MB22.00072. The Cosmic Dawn Center (DAWN) is funded by the Danish National Research Foundation under grant DNRF140. The data products presented herein were retrieved from the DAWN JWST Archive (DJA). DJA is an initiative of the Cosmic Dawn Center, which is funded by the Danish National Research Foundation under grant DNRF140. P.D. acknowledge support from the NWO grant 016.VIDI.189.162 (“ODIN") and warmly thanks the European Commission’s and University of Groningen’s CO-FUND Rosalind Franklin program. Support from the ERC Advanced Grant INTERSTELLAR H2020/740120 is kindly acknowledged (A.F.). S.G. acknowledges financial support from the Villum Young Investigator grants 37440 and 13160 and the Cosmic Dawn Center. M.K. was supported by the ANID BASAL project FB210003. G.E.M. acknowledges financial support from the Villum Young Investigator grants 37440 and 13160 and the Cosmic Dawn Center. J.W. acknowledges support from the Science and Technology Facilities Council (STFC), by the ERC through Advanced Grant 695671 “QUENCH”, by the UKRI Frontier Research grant RISEandFALL. Support for this work was provided by NASA through the NASA Hubble Fellowship grant HST-HF2-51515.001-A awarded by the Space Telescope Science Institute, which is operated by the Association of Universities for Research in Astronomy, Incorporated, under NASA contract NAS5-26555. F.C. acknowledges support from a UKRI Frontier Research Guarantee Grant (PI Cullen; grant reference EP/X021025/1). J.H.W. acknowledges support by NSF grant AST-2108020 and NASA grants 80NSSC20K0520 and 80NSSC21K1053. NRT acknowledges support through STFC consolidated grant ST/W000857/1. M.J.H. is supported by the Swedish Research Council, VetenskapsrÅdet, and is fellow of the Knut & Alice Wallenberg foundation. This work is based in part on observations made with the NASA/ESA/CSA James Webb Space Telescope. The data were obtained from the Mikulski Archive for Space Telescopes (MAST) at the Space Telescope Science Institute, which is operated by the Association of Universities for Research in Astronomy, Inc., under NASA contract NAS 5-03127 for JWST. Software: This work made use of and acknowledge the following software: NumPy (Harris et al. 2020), Matplotlib (Hunter 2007), LMfit (Newville et al. 2014), SciPy (Virtanen et al. 2020), grizli (Brammer 2023a), Astrodrizzle (Gonzaga et al. 2012), and MsaExp (v0.3; Brammer 2023b).
Data availability
All the data presented in this work are made publicly available through DJA: https://dawn-cph.github.io/dja/, and are made easy to inspect and query in a dedicated webpage: https://s3.amazonaws.com/msaexp-nirspec/extractions/nirspec_graded_v2.html. The spectroscopic data have been processed using the custom-made reduction pipeline MSAEXP, publicly available here: https://github.com/gbrammer/msaexp. All the data and catalogs related to JWST-PRIMAL are also available on a dedicated webpage: https://github.com/keheintz/jwst-primal.
References
- Adams, N. J., Conselice, C. J., Austin, D., et al. 2024, ApJ, 965, 169 [NASA ADS] [CrossRef] [Google Scholar]
- Arellano-Córdova, K. Z., Berg, D. A., Chisholm, J., et al. 2022, ApJ, 940, L23 [CrossRef] [Google Scholar]
- Arrabal Haro, P., Dickinson, M., Finkelstein, S. L., et al. 2023, Nature, 622, 707 [NASA ADS] [CrossRef] [Google Scholar]
- Asplund, M., Grevesse, N., Sauval, A. J., & Scott, P. 2009, ARA&A, 47, 481 [NASA ADS] [CrossRef] [Google Scholar]
- Atek, H., Chemerynska, I., Wang, B., et al. 2023, MNRAS, 524, 5486 [NASA ADS] [CrossRef] [Google Scholar]
- Atek, H., Labbé, I., Furtak, L. J., et al. 2024, Nature, 626, 975 [NASA ADS] [CrossRef] [Google Scholar]
- Austin, D., Adams, N., Conselice, C. J., et al. 2023, ApJ, 952, L7 [NASA ADS] [CrossRef] [Google Scholar]
- Austin, D., Conselice, C. J., & Adams, N. J. 2024, arXiv e-prints [arXiv:2404.10751] [Google Scholar]
- Bañados, E., Venemans, B. P., Mazzucchelli, C., et al. 2018, Nature, 553, 473 [Google Scholar]
- Begley, R., Cullen, F., McLure, R. J., et al. 2024, MNRAS, 527, 4040 [Google Scholar]
- Behroozi, P., Wechsler, R. H., Hearin, A. P., & Conroy, C. 2019, MNRAS, 488, 3143 [NASA ADS] [CrossRef] [Google Scholar]
- Bezanson, R., Labbe, I., Whitaker, K. E., et al. 2022, arXiv e-prints [arXiv:2212.04026] [Google Scholar]
- Blumenthal, G. R., Faber, S. M., Primack, J. R., & Rees, M. J. 1984, Nature, 311, 517 [Google Scholar]
- Bosman, S. E. I., Davies, F. B., Becker, G. D., et al. 2022, MNRAS, 514, 55 [NASA ADS] [CrossRef] [Google Scholar]
- Bouwens, R. J., Smit, R., Labbé, I., et al. 2016, ApJ, 831, 176 [Google Scholar]
- Bouwens, R. J., Stefanon, M., Brammer, G., et al. 2023, MNRAS, 523, 1036 [NASA ADS] [CrossRef] [Google Scholar]
- Brammer, G. 2023a, https://doi.org/10.5281/zenodo.1146904 [Google Scholar]
- Brammer, G. 2023b, https://doi.org/10.5281/zenodo.7299500 [Google Scholar]
- Brammer, G. B., van Dokkum, P. G., & Coppi, P. 2008, ApJ, 686, 1503 [Google Scholar]
- Brinchmann, J. 2023, MNRAS, 525, 2087 [NASA ADS] [CrossRef] [Google Scholar]
- Bunker, A. J., Saxena, A., Cameron, A. J., et al. 2023, A&A, 677, A88 [NASA ADS] [CrossRef] [EDP Sciences] [Google Scholar]
- Bunker, A. J., Cameron, A. J., Curtis-Lake, E., et al. 2024, A&A, 690, A288 [NASA ADS] [CrossRef] [EDP Sciences] [Google Scholar]
- Calzetti, D. 2013, Secular Evolution of Galaxies (Cambridge, UK: Cambridge University Press), 419 [CrossRef] [Google Scholar]
- Calzetti, D., Kinney, A. L., & Storchi-Bergmann, T. 1994, ApJ, 429, 582 [Google Scholar]
- Cameron, A. G. W. 1957, PASP, 69, 201 [NASA ADS] [CrossRef] [Google Scholar]
- Cameron, E. 2011, PASA, 28, 128 [Google Scholar]
- Cameron, A. J., Saxena, A., Bunker, A. J., et al. 2023, A&A, 677, A115 [NASA ADS] [CrossRef] [EDP Sciences] [Google Scholar]
- Cameron, A. J., Katz, H., Witten, C., et al. 2024, MNRAS, 534, 523 [NASA ADS] [CrossRef] [Google Scholar]
- Casey, C. M., Akins, H. B., Shuntov, M., et al. 2024, ApJ, 965, 98 [NASA ADS] [CrossRef] [Google Scholar]
- Castellano, M., Dayal, P., Pentericci, L., et al. 2016, ApJ, 818, L3 [NASA ADS] [CrossRef] [Google Scholar]
- Castellano, M., Pentericci, L., Vanzella, E., et al. 2018, ApJ, 863, L3 [CrossRef] [Google Scholar]
- Castellano, M., Fontana, A., Treu, T., et al. 2022, ApJ, 938, L15 [NASA ADS] [CrossRef] [Google Scholar]
- Castellano, M., Napolitano, L., Fontana, A., et al. 2024, ApJ, 972, 143 [Google Scholar]
- Cen, R., & Kimm, T. 2015, ApJ, 801, L25 [Google Scholar]
- Chemerynska, I., Atek, H., Furtak, L. J., et al. 2024, MNRAS, 531, 2615 [NASA ADS] [CrossRef] [Google Scholar]
- Chen, H. 2023, arXiv e-prints [arXiv:2307.04797] [Google Scholar]
- Chen, Z., Stark, D. P., Mason, C., et al. 2023, arXiv e-prints [arXiv:2311.13683] [Google Scholar]
- Chisholm, J., Rigby, J. R., Bayliss, M., et al. 2019, ApJ, 882, 182 [Google Scholar]
- Chisholm, J., Saldana-Lopez, A., Flury, S., et al. 2022, MNRAS, 517, 5104 [CrossRef] [Google Scholar]
- Choustikov, N., Katz, H., Saxena, A., et al. 2024, MNRAS, 532, 2463 [NASA ADS] [CrossRef] [Google Scholar]
- Cooke, J., & O’Meara, J. M. 2015, ApJ, 812, L27 [NASA ADS] [CrossRef] [Google Scholar]
- Cullen, F., McLure, R. J., Khochfar, S., Dunlop, J. S., & Dalla Vecchia, C. 2017, MNRAS, 470, 3006 [NASA ADS] [CrossRef] [Google Scholar]
- Cullen, F., Shapley, A. E., McLure, R. J., et al. 2021, MNRAS, 505, 903 [CrossRef] [Google Scholar]
- Cullen, F., McLure, R. J., McLeod, D. J., et al. 2023, MNRAS, 520, 14 [NASA ADS] [CrossRef] [Google Scholar]
- Cullen, F., McLeod, D. J., McLure, R. J., et al. 2024, MNRAS, 531, 997 [NASA ADS] [CrossRef] [Google Scholar]
- Curti, M., Mannucci, F., Cresci, G., & Maiolino, R. 2020, MNRAS, 491, 944 [Google Scholar]
- Curti, M., D’Eugenio, F., Carniani, S., et al. 2023, MNRAS, 518, 425 [Google Scholar]
- Curti, M., Maiolino, R., Curtis-Lake, E., et al. 2024, A&A, 684, A75 [NASA ADS] [CrossRef] [EDP Sciences] [Google Scholar]
- Curtis-Lake, E., Carniani, S., Cameron, A., et al. 2023, Nat. Astron., 7, 622 [NASA ADS] [CrossRef] [Google Scholar]
- Davies, F. B., Hennawi, J. F., Bañados, E., et al. 2018, ApJ, 864, 142 [NASA ADS] [CrossRef] [Google Scholar]
- Dayal, P., & Ferrara, A. 2018, Phys. Rep., 780, 1 [Google Scholar]
- Dayal, P., Maselli, A., & Ferrara, A. 2011, MNRAS, 410, 830 [NASA ADS] [CrossRef] [Google Scholar]
- Dayal, P., Volonteri, M., Greene, J. E., et al. 2024, A&A submitted [arXiv:2401.11242] [Google Scholar]
- D’Eugenio, F., Maiolino, R., Carniani, S., et al. 2024, A&A, 689, A152 [NASA ADS] [CrossRef] [EDP Sciences] [Google Scholar]
- Dewdney, P. E., Hall, P. J., Schilizzi, R. T., & Lazio, T. J. L. W. 2009, IEEE Proc., 97, 1482 [Google Scholar]
- Dijkstra, M., Gronke, M., & Venkatesan, A. 2016, ApJ, 828, 71 [Google Scholar]
- D’Odorico, V., Feruglio, C., Ferrara, A., et al. 2018, ApJ, 863, L29 [Google Scholar]
- Donnan, C. T., McLeod, D. J., Dunlop, J. S., et al. 2023, MNRAS, 518, 6011 [Google Scholar]
- Duan, Q., Conselice, C. J., Li, Q., et al. 2023, arXiv e-prints, [arXiv:2309.14961] [Google Scholar]
- Ďurovčíková, D., Katz, H., Bosman, S. E. I., et al. 2020, MNRAS, 493, 4256 [CrossRef] [Google Scholar]
- Ďurovčíková, D., Eilers, A. C., Chen, H., et al. 2024, arXiv e-prints [arXiv:2401.10328] [Google Scholar]
- Eisenstein, D. J., Willott, C., Alberts, S., et al. 2023, arXiv e-prints [arXiv:2306.02465] [Google Scholar]
- Endsley, R., Stark, D. P., Chevallard, J., & Charlot, S. 2021, MNRAS, 500, 5229 [Google Scholar]
- Endsley, R., Stark, D. P., Whitler, L., et al. 2023, MNRAS, 524, 2312 [NASA ADS] [CrossRef] [Google Scholar]
- Fan, X., Bañados, E., & Simcoe, R. A. 2023, ARA&A, 61, 373 [NASA ADS] [CrossRef] [Google Scholar]
- Ferrara, A., Pallottini, A., & Dayal, P. 2023, MNRAS, 522, 3986 [NASA ADS] [CrossRef] [Google Scholar]
- Finkelstein, S. L., D’Aloisio, A., Paardekooper, J.-P., et al. 2019, ApJ, 879, 36 [Google Scholar]
- Finkelstein, S. L., Bagley, M. B., Ferguson, H. C., et al. 2023, ApJ, 946, L13 [NASA ADS] [CrossRef] [Google Scholar]
- Finkelstein, S. L., Leung, G. C. K., Bagley, M. B., et al. 2024, ApJ, 969, L2 [NASA ADS] [CrossRef] [Google Scholar]
- Finlator, K., Keating, L., Oppenheimer, B. D., Davé, R., & Zackrisson, E. 2018, MNRAS, 480, 2628 [CrossRef] [Google Scholar]
- Flury, S. R., Jaskot, A. E., Ferguson, H. C., et al. 2022, ApJ, 930, 126 [NASA ADS] [CrossRef] [Google Scholar]
- Franco, M., Akins, H. B., Casey, C. M., et al. 2023, arXiv e-prints [arXiv:2308.00751] [Google Scholar]
- Fujimoto, S., Arrabal Haro, P., Dickinson, M., et al. 2023a, ApJ, 949, L25 [NASA ADS] [CrossRef] [Google Scholar]
- Fujimoto, S., Wang, B., Weaver, J., et al. 2023b, arXiv e-prints, [arXiv:2308.11609] [Google Scholar]
- Fynbo, J. P. U., Jakobsson, P., Prochaska, J. X., et al. 2009, ApJS, 185, 526 [NASA ADS] [CrossRef] [Google Scholar]
- Gardner, J. P., Mather, J. C., Clampin, M., et al. 2006, Space Sci. Rev., 123, 485 [Google Scholar]
- Gardner, J. P., Mather, J. C., Abbott, R., et al. 2023, PASP, 135, 068001 [NASA ADS] [CrossRef] [Google Scholar]
- Gonzaga, S., Hack, W., Fruchter, A., & Mack, J. 2012, The DrizzlePac Handbook, HST Data Handbook [Google Scholar]
- Greig, B., Mesinger, A., Haiman, Z., & Simcoe, R. A. 2017, MNRAS, 466, 4239 [Google Scholar]
- Greig, B., Mesinger, A., & Bañados, E. 2019, MNRAS, 484, 5094 [NASA ADS] [CrossRef] [Google Scholar]
- Gronke, M., Dijkstra, M., McCourt, M., & Oh, S. P. 2017, A&A, 607, A71 [NASA ADS] [CrossRef] [EDP Sciences] [Google Scholar]
- Hainline, K. N., D’Eugenio, F., & Jakobsen, P. 2024a, arXiv e-prints, [arXiv:2404.04325] [Google Scholar]
- Hainline, K. N., Johnson, B. D., Robertson, B., et al. 2024b, ApJ, 964, 71 [CrossRef] [Google Scholar]
- Harikane, Y., Ouchi, M., Oguri, M., et al. 2023, ApJS, 265, 5 [NASA ADS] [CrossRef] [Google Scholar]
- Harikane, Y., Nakajima, K., Ouchi, M., et al. 2024, ApJ, 960, 56 [NASA ADS] [CrossRef] [Google Scholar]
- Harris, C. R., Millman, K. J., van der Walt, S. J., et al. 2020, Nature, 585, 357 [NASA ADS] [CrossRef] [Google Scholar]
- Hashimoto, T., Laporte, N., Mawatari, K., et al. 2018, Nature, 557, 392 [NASA ADS] [CrossRef] [Google Scholar]
- Haslbauer, M., Kroupa, P., Zonoozi, A. H., & Haghi, H. 2022, ApJ, 939, L31 [NASA ADS] [CrossRef] [Google Scholar]
- Hayes, M. J., & Scarlata, C. 2023, ApJ, 954, L14 [NASA ADS] [CrossRef] [Google Scholar]
- Hayes, M. J., Runnholm, A., Scarlata, C., Gronke, M., & Rivera-Thorsen, T. E. 2023, MNRAS, 520, 5903 [NASA ADS] [CrossRef] [Google Scholar]
- Heintz, K. E., Watson, D., Oesch, P. A., Narayanan, D., & Madden, S. C. 2021, ApJ, 922, 147 [NASA ADS] [CrossRef] [Google Scholar]
- Heintz, K. E., Oesch, P. A., Aravena, M., et al. 2022, ApJ, 934, L27 [NASA ADS] [CrossRef] [Google Scholar]
- Heintz, K. E., Giménez-Arteaga, C., Fujimoto, S., et al. 2023a, ApJ, 944, L30 [NASA ADS] [CrossRef] [Google Scholar]
- Heintz, K. E., Brammer, G. B., Giménez-Arteaga, C., et al. 2023b, Nat. Astron., 7, 1517 [NASA ADS] [CrossRef] [Google Scholar]
- Heintz, K. E., De Cia, A., Thöne, C. C., et al. 2023c, A&A, 679, A91 [NASA ADS] [CrossRef] [EDP Sciences] [Google Scholar]
- Heintz, K. E., Watson, D., Brammer, G., et al. 2024, Science, 384, 890 [NASA ADS] [CrossRef] [Google Scholar]
- Henry, A., Scarlata, C., Martin, C. L., & Erb, D. 2015, ApJ, 809, 19 [Google Scholar]
- Horne, K. 1986, PASP, 98, 609 [Google Scholar]
- Hoyle, F. 1954, ApJS, 1, 121 [NASA ADS] [CrossRef] [Google Scholar]
- Hsiao, T. Y. Y., Abdurro’uf, Coe, D., et al. 2023, arXiv e-prints [arXiv:2305.03042] [Google Scholar]
- Hu, W., Martin, C. L., Gronke, M., et al. 2023, ApJ, 956, 39 [CrossRef] [Google Scholar]
- Hunter, J. D. 2007, Comput. Sci. Eng., 9, 90 [NASA ADS] [CrossRef] [Google Scholar]
- Hutter, A., Trebitsch, M., Dayal, P., et al. 2023, MNRAS, 524, 6124 [NASA ADS] [CrossRef] [Google Scholar]
- Inayoshi, K., Harikane, Y., Inoue, A. K., Li, W., & Ho, L. C. 2022, ApJ, 938, L10 [NASA ADS] [CrossRef] [Google Scholar]
- Izotov, Y. I., Stasińska, G., Meynet, G., Guseva, N. G., & Thuan, T. X. 2006, A&A, 448, 955 [CrossRef] [EDP Sciences] [Google Scholar]
- Izotov, Y. I., Worseck, G., Schaerer, D., et al. 2018, MNRAS, 478, 4851 [Google Scholar]
- Jakobsen, P., Ferruit, P., Alves de Oliveira, C., et al. 2022, A&A, 661, A80 [NASA ADS] [CrossRef] [EDP Sciences] [Google Scholar]
- Jakobsson, P., Fynbo, J. P. U., Ledoux, C., et al. 2006, A&A, 460, L13 [NASA ADS] [CrossRef] [EDP Sciences] [Google Scholar]
- Jaskot, A. E., Dowd, T., Oey, M. S., Scarlata, C., & McKinney, J. 2019, ApJ, 885, 96 [Google Scholar]
- Jiang, H., Wang, X., Cheng, C., et al. 2023, arXiv e-prints [arXiv:2312.04151] [Google Scholar]
- Jones, G. C., Bunker, A. J., Saxena, A., et al. 2024, A&Amp;A, 683, A238 [NASA ADS] [CrossRef] [EDP Sciences] [Google Scholar]
- Jung, I., Finkelstein, S. L., Arrabal Haro, P., et al. 2023, arXiv e-prints [arXiv:2304.05385] [Google Scholar]
- Katz, H., Saxena, A., Cameron, A. J., et al. 2023, MNRAS, 518, 592 [Google Scholar]
- Keating, L. C., Weinberger, L. H., Kulkarni, G., et al. 2020, MNRAS, 491, 1736 [NASA ADS] [CrossRef] [Google Scholar]
- Keating, L. C., Bolton, J. S., Cullen, F., et al. 2023a, arXiv e-prints [arXiv:2308.05800] [Google Scholar]
- Keating, L. C., Puchwein, E., Bolton, J. S., Haehnelt, M. G., & Kulkarni, G. 2023b, arXiv e-prints [arXiv:2308.11709] [Google Scholar]
- Kennicutt, R. C. Jr 1998, ARA&A, 36, 189 [NASA ADS] [CrossRef] [Google Scholar]
- Kennicutt, R. C., & Evans, N. J. 2012, ARA&A, 50, 531 [NASA ADS] [CrossRef] [Google Scholar]
- Kereš, D., Katz, N., Weinberg, D. H., & Davé, R. 2005, MNRAS, 363, 2 [Google Scholar]
- Kewley, L. J., Nicholls, D. C., & Sutherland, R. S. 2019, ARA&A, 57, 511 [Google Scholar]
- Khostovan, A. A., Sobral, D., Mobasher, B., et al. 2016, MNRAS, 463, 2363 [Google Scholar]
- Kim, K. J., Bayliss, M. B., Rigby, J. R., et al. 2023, ApJ, 955, L17 [NASA ADS] [CrossRef] [Google Scholar]
- Kroupa, P. 2001, MNRAS, 322, 231 [NASA ADS] [CrossRef] [Google Scholar]
- Labbé, I., van Dokkum, P., Nelson, E., et al. 2023, Nature, 616, 266 [CrossRef] [Google Scholar]
- Langeroodi, D., & Hjorth, J. 2023, arXiv e-prints [arXiv:2307.06336] [Google Scholar]
- Langeroodi, D., Hjorth, J., Chen, W., et al. 2023, ApJ, 957, 39 [NASA ADS] [CrossRef] [Google Scholar]
- Lara-López, M. A., Cepa, J., Bongiovanni, A., et al. 2010a, A&A, 521, L53 [CrossRef] [EDP Sciences] [Google Scholar]
- Lara-López, M. A., Cepa, J., Bongiovanni, A., et al. 2010b, A&A, 519, A31 [NASA ADS] [CrossRef] [EDP Sciences] [Google Scholar]
- Laursen, P., Sommer-Larsen, J., & Razoumov, A. O. 2011, ApJ, 728, 52 [Google Scholar]
- Laursen, P., Sommer-Larsen, J., Milvang-Jensen, B., Fynbo, J. P. U., & Razoumov, A. O. 2019, A&A, 627, A84 [NASA ADS] [CrossRef] [EDP Sciences] [Google Scholar]
- Liang, L., Feldmann, R., Murray, N., et al. 2024, MNRAS, 528, 499 [NASA ADS] [CrossRef] [Google Scholar]
- Lin, X., Cai, Z., Zou, S., et al. 2023, ApJ, 944, L59 [NASA ADS] [CrossRef] [Google Scholar]
- Lin, Y.-H., Scarlata, C., Williams, H., et al. 2024, MNRAS, 527, 4173 [Google Scholar]
- Madau, P., & Dickinson, M. 2014, ARA&A, 52, 415 [Google Scholar]
- Maiolino, R., & Mannucci, F. 2019, A&ARv, 27, 3 [Google Scholar]
- Malkan, M. A., Cohen, D. P., Maruyama, M., et al. 2017, ApJ, 850, 5 [NASA ADS] [CrossRef] [Google Scholar]
- Mannucci, F., Cresci, G., Maiolino, R., Marconi, A., & Gnerucci, A. 2010, MNRAS, 408, 2115 [NASA ADS] [CrossRef] [Google Scholar]
- Mason, C. A., Treu, T., Dijkstra, M., et al. 2018, ApJ, 856, 2 [Google Scholar]
- Mason, C. A., Fontana, A., Treu, T., et al. 2019, MNRAS, 485, 3947 [NASA ADS] [CrossRef] [Google Scholar]
- Mason, C. A., Trenti, M., & Treu, T. 2023, MNRAS, 521, 497 [NASA ADS] [CrossRef] [Google Scholar]
- Matthee, J., Sobral, D., Gronke, M., et al. 2018, A&A, 619, A136 [NASA ADS] [CrossRef] [EDP Sciences] [Google Scholar]
- Matthee, J., Mackenzie, R., Simcoe, R. A., et al. 2023, ApJ, 950, 67 [NASA ADS] [CrossRef] [Google Scholar]
- McLeod, D. J., Donnan, C. T., McLure, R. J., et al. 2024, MNRAS, 527, 5004 [Google Scholar]
- McQuinn, M., Hernquist, L., Zaldarriaga, M., & Dutta, S. 2007, MNRAS, 381, 75 [NASA ADS] [CrossRef] [Google Scholar]
- McQuinn, M., Lidz, A., Zaldarriaga, M., Hernquist, L., & Dutta, S. 2008, MNRAS, 388, 1101 [NASA ADS] [Google Scholar]
- Mesinger, A., & Haiman, Z. 2007, ApJ, 660, 923 [NASA ADS] [CrossRef] [Google Scholar]
- Meurer, G. R., Heckman, T. M., & Calzetti, D. 1999, ApJ, 521, 64 [Google Scholar]
- Miralda-Escudé, J. 1998, ApJ, 501, 15 [CrossRef] [Google Scholar]
- Mirocha, J., & Furlanetto, S. R. 2023, MNRAS, 519, 843 [Google Scholar]
- Naidu, R. P., Tacchella, S., Mason, C. A., et al. 2020, ApJ, 892, 109 [NASA ADS] [CrossRef] [Google Scholar]
- Naidu, R. P., Oesch, P. A., Setton, D. J., et al. 2022, arXiv e-prints [arXiv:2208.02794] [Google Scholar]
- Nakajima, K., Ouchi, M., Isobe, Y., et al. 2023, arXiv e-prints [arXiv:2301.12825] [Google Scholar]
- Nakane, M., Ouchi, M., Nakajima, K., et al. 2023, arXiv e-prints [arXiv:2312.06804] [Google Scholar]
- Napolitano, L., Pentericci, L., Calabrò, A., et al. 2023, A&A, 677, A138 [NASA ADS] [CrossRef] [EDP Sciences] [Google Scholar]
- Napolitano, L., Pentericci, L., Santini, P., et al. 2024, A&A, 688, A106 [NASA ADS] [CrossRef] [EDP Sciences] [Google Scholar]
- Newville, M., Stensitzki, T., Allen, D. B., & Ingargiola, A. 2014, https://doi.org/10.5281/zenodo.11813 [Google Scholar]
- Ning, Y., Cai, Z., Lin, X., et al. 2024, ApJ, 963, L38 [NASA ADS] [CrossRef] [Google Scholar]
- Noterdaeme, P., Petitjean, P., Carithers, W. C., et al. 2012, A&A, 547, L1 [NASA ADS] [CrossRef] [EDP Sciences] [Google Scholar]
- Ocvirk, P., Lewis, J. S. W., Gillet, N., et al. 2021, MNRAS, 507, 6108 [NASA ADS] [CrossRef] [Google Scholar]
- Osterbrock, D. E., & Ferland, G. J. 2006, Astrophysics of Gaseous Nebulae and Active Galactic Nuclei (CA: University Science Books) [Google Scholar]
- Ouchi, M., Shimasaku, K., Furusawa, H., et al. 2010, ApJ, 723, 869 [Google Scholar]
- Pacucci, F., Dayal, P., Harikane, Y., Inoue, A. K., & Loeb, A. 2022, MNRAS, 514, L6 [NASA ADS] [CrossRef] [Google Scholar]
- Pahl, A. J., Shapley, A. E., Steidel, C. C., et al. 2024, arXiv e-prints [arXiv:2401.09526] [Google Scholar]
- Pallottini, A., Ferrara, A., Gallerani, S., et al. 2022, MNRAS, 513, 5621 [NASA ADS] [Google Scholar]
- Péroux, C., & Howk, J. C. 2020, ARA&A, 58, 363 [CrossRef] [Google Scholar]
- Perrin, M. D., Sivaramakrishnan, A., Lajoie, C.-P., et al. 2014, Proc. SPIE, 9143, 91433X [NASA ADS] [CrossRef] [Google Scholar]
- Pettini, M., Steidel, C. C., Adelberger, K. L., Dickinson, M., & Giavalisco, M. 2000, ApJ, 528, 96 [Google Scholar]
- Planck Collaboration VI. 2020, A&A, 641, A6 [NASA ADS] [CrossRef] [EDP Sciences] [Google Scholar]
- Prochaska, J. X., & Wolfe, A. M. 2009, ApJ, 696, 1543 [Google Scholar]
- Prochaska, J. X., Chen, H.-W., Dessauges-Zavadsky, M., & Bloom, J. S. 2007, ApJ, 666, 267 [NASA ADS] [CrossRef] [Google Scholar]
- Puchwein, E., Bolton, J. S., Keating, L. C., et al. 2023, MNRAS, 519, 6162 [NASA ADS] [CrossRef] [Google Scholar]
- Rasmussen Cueto, E. R., Hutter, A., Dayal, P., et al. 2024, A&A, 686, A138 [NASA ADS] [CrossRef] [EDP Sciences] [Google Scholar]
- Reddy, N. A., Oesch, P. A., Bouwens, R. J., et al. 2018a, ApJ, 853, 56 [NASA ADS] [CrossRef] [Google Scholar]
- Reddy, N. A., Shapley, A. E., Sanders, R. L., et al. 2018b, ApJ, 869, 92 [NASA ADS] [CrossRef] [Google Scholar]
- Rhoads, J. E., Wold, I. G. B., Harish, S., et al. 2023, ApJ, 942, L14 [NASA ADS] [CrossRef] [Google Scholar]
- Rigby, J., Perrin, M., McElwain, M., et al. 2023, PASP, 135, 048001 [NASA ADS] [CrossRef] [Google Scholar]
- Roberts-Borsani, G., Treu, T., Chen, W., et al. 2023, Nature, 618, 480 [NASA ADS] [CrossRef] [Google Scholar]
- Roberts-Borsani, G., Treu, T., Shapley, A., et al. 2024, arXiv e-prints, [arXiv:2403.07103] [Google Scholar]
- Robertson, B. E. 2022, ARA&A, 60, 121 [NASA ADS] [CrossRef] [Google Scholar]
- Robertson, B. E., Furlanetto, S. R., Schneider, E., et al. 2013, ApJ, 768, 71 [Google Scholar]
- Rosdahl, J., Blaizot, J., Katz, H., et al. 2022, MNRAS, 515, 2386 [CrossRef] [Google Scholar]
- Salmon, B., Papovich, C., Finkelstein, S. L., et al. 2015, ApJ, 799, 183 [NASA ADS] [CrossRef] [Google Scholar]
- Sanders, R. L., Shapley, A. E., Jones, T., et al. 2021, ApJ, 914, 19 [CrossRef] [Google Scholar]
- Sanders, R. L., Shapley, A. E., Topping, M. W., Reddy, N. A., & Brammer, G. B. 2024, ApJ, 962, 24 [NASA ADS] [CrossRef] [Google Scholar]
- Sandles, L., Curtis-Lake, E., Charlot, S., Chevallard, J., & Maiolino, R. 2022, MNRAS, 515, 2951 [NASA ADS] [CrossRef] [Google Scholar]
- Saxena, A., Robertson, B. E., Bunker, A. J., et al. 2023, A&A, 678, A68 [NASA ADS] [CrossRef] [EDP Sciences] [Google Scholar]
- Saxena, A., Bunker, A. J., Jones, G. C., et al. 2024, A&A, 684, A84 [NASA ADS] [CrossRef] [EDP Sciences] [Google Scholar]
- Schaerer, D. 2003, A&A, 397, 527 [NASA ADS] [CrossRef] [EDP Sciences] [Google Scholar]
- Schaerer, D., Marques-Chaves, R., Barrufet, L., et al. 2022, A&A, 665, L4 [NASA ADS] [CrossRef] [EDP Sciences] [Google Scholar]
- Schaerer, D., Marques-Chaves, R., Xiao, M., & Korber, D. 2024, A&A, 687, L11 [NASA ADS] [CrossRef] [EDP Sciences] [Google Scholar]
- Schaye, J., Dalla Vecchia, C., Booth, C. M., et al. 2010, MNRAS, 402, 1536 [Google Scholar]
- Serjeant, S., & Bakx, T. J. L. C. 2023, Nat. Astron., 7, 1143 [NASA ADS] [CrossRef] [Google Scholar]
- Shapley, A. E., Steidel, C. C., Pettini, M., & Adelberger, K. L. 2003, ApJ, 588, 65 [Google Scholar]
- Shapley, A. E., Sanders, R. L., Reddy, N. A., Topping, M. W., & Brammer, G. B. 2023, ApJ, 954, 157 [NASA ADS] [CrossRef] [Google Scholar]
- Shen, X., Vogelsberger, M., Boylan-Kolchin, M., Tacchella, S., & Kannan, R. 2023, MNRAS, 525, 3254 [NASA ADS] [CrossRef] [Google Scholar]
- Simmonds, C., Tacchella, S., Maseda, M., et al. 2023, MNRAS, 523, 5468 [NASA ADS] [CrossRef] [Google Scholar]
- Sobacchi, E., & Mesinger, A. 2015, MNRAS, 453, 1843 [Google Scholar]
- Speagle, J. S., Steinhardt, C. L., Capak, P. L., & Silverman, J. D. 2014, ApJS, 214, 15 [Google Scholar]
- Stark, D. P. 2016, ARA&A, 54, 761 [Google Scholar]
- Steidel, C. C., Erb, D. K., Shapley, A. E., et al. 2010, ApJ, 717, 289 [Google Scholar]
- Steidel, C. C., Strom, A. L., Pettini, M., et al. 2016, ApJ, 826, 159 [NASA ADS] [CrossRef] [Google Scholar]
- Steidel, C. C., Bogosavljević, M., Shapley, A. E., et al. 2018, ApJ, 869, 123 [Google Scholar]
- Steinhardt, C. L., Kokorev, V., Rusakov, V., Garcia, E., & Sneppen, A. 2023, ApJ, 951, L40 [NASA ADS] [CrossRef] [Google Scholar]
- Sun, G., Faucher-Giguère, C.-A., Hayward, C. C., et al. 2023, ApJ, 955, L35 [CrossRef] [Google Scholar]
- Tang, M., Stark, D. P., Chen, Z., et al. 2023, MNRAS, 526, 1657 [NASA ADS] [CrossRef] [Google Scholar]
- Tanvir, N. R., Fynbo, J. P. U., de Ugarte Postigo, A., et al. 2019, MNRAS, 483, 5380 [Google Scholar]
- Taylor, A. J., Barger, A. J., & Cowie, L. L. 2022, ApJ, 939, L3 [NASA ADS] [CrossRef] [Google Scholar]
- Tepper-García, T. 2006, MNRAS, 369, 2025 [CrossRef] [Google Scholar]
- Terp, C., Heintz, K. E., Watson, D., et al. 2024, A&A, 690, A70 [NASA ADS] [CrossRef] [EDP Sciences] [Google Scholar]
- Thorne, J. E., Robotham, A. S. G., Davies, L. J. M., et al. 2021, MNRAS, 505, 540 [NASA ADS] [CrossRef] [Google Scholar]
- Topping, M. W., Stark, D. P., Endsley, R., et al. 2023, arXiv e-prints [arXiv:2307.08835] [Google Scholar]
- Torrey, P., Vogelsberger, M., Hernquist, L., et al. 2018, MNRAS, 477, L16 [Google Scholar]
- Totani, T., Kawai, N., Kosugi, G., et al. 2006, PASJ, 58, 485 [NASA ADS] [Google Scholar]
- Treu, T., Roberts-Borsani, G., Bradac, M., et al. 2022, ApJ, 935, 110 [NASA ADS] [CrossRef] [Google Scholar]
- Trinca, A., Schneider, R., Valiante, R., et al. 2023, arXiv e-prints [arXiv:2305.04944] [Google Scholar]
- Trump, J. R., Arrabal Haro, P., Simons, R. C., et al. 2023, ApJ, 945, 35 [NASA ADS] [CrossRef] [Google Scholar]
- Tumlinson, J., Peeples, M. S., & Werk, J. K. 2017, ARA&A, 55, 389 [Google Scholar]
- Umeda, H., Ouchi, M., Nakajima, K., et al. 2023, arXiv e-prints [arXiv:2306.00487] [Google Scholar]
- Valentino, F., Brammer, G., Gould, K. M. L., et al. 2023, ApJ, 947, 20 [NASA ADS] [CrossRef] [Google Scholar]
- van der Wel, A., Franx, M., van Dokkum, P. G., et al. 2014, ApJ, 788, 28 [Google Scholar]
- Verhamme, A., Orlitová, I., Schaerer, D., & Hayes, M. 2015, A&A, 578, A7 [NASA ADS] [CrossRef] [EDP Sciences] [Google Scholar]
- Verhamme, A., Orlitová, I., Schaerer, D., et al. 2017, A&A, 597, A13 [NASA ADS] [CrossRef] [EDP Sciences] [Google Scholar]
- Vijayan, A. P., Thomas, P. A., Lovell, C. C., et al. 2024, MNRAS, 527, 7337 [Google Scholar]
- Virtanen, P., Gommers, R., Oliphant, T. E., et al. 2020, Nature Methods, 17, 261 [CrossRef] [Google Scholar]
- Vizgan, D., Heintz, K. E., Greve, T. R., et al. 2022, ApJ, 939, L1 [NASA ADS] [CrossRef] [Google Scholar]
- Walter, F., Carilli, C., Neeleman, M., et al. 2020, ApJ, 902, 111 [Google Scholar]
- Wang, F., Yang, J., Fan, X., et al. 2021, ApJ, 907, L1 [Google Scholar]
- Wang, B., Fujimoto, S., Labbe, I., et al. 2023a, arXiv e-prints [arXiv:2308.03745] [Google Scholar]
- Wang, B., Leja, J., Labbé, I., et al. 2023b, arXiv e-prints [arXiv:2310.01276] [Google Scholar]
- Ward, E. M., de la Vega, A., Mobasher, B., et al. 2023, arXiv e-prints [arXiv:2311.02162] [Google Scholar]
- Whitaker, K. E., van Dokkum, P. G., Brammer, G., & Franx, M. 2012, ApJ, 754, L29 [Google Scholar]
- White, S. D. M., & Frenk, C. S. 1991, ApJ, 379, 52 [Google Scholar]
- White, S. D. M., & Rees, M. J. 1978, MNRAS, 183, 341 [Google Scholar]
- Wilson, S. N., Heintz, K. E., Jakobsson, P., et al. 2024, A&A, 685, A30 [NASA ADS] [CrossRef] [EDP Sciences] [Google Scholar]
- Witstok, J., Smit, R., Saxena, A., et al. 2024a, A&A, 682, A40 [NASA ADS] [CrossRef] [EDP Sciences] [Google Scholar]
- Witstok, J., Jakobsen, P., Maiolino, R., et al. 2024b, arXiv e-prints [arXiv:2408.16608] [Google Scholar]
- Witten, C., Laporte, N., Martin-Alvarez, S., et al. 2024, Nat. Astron., 8, 384 [Google Scholar]
- Wolfe, A. M., Turnshek, D. A., Smith, H. E., & Cohen, R. D. 1986, ApJS, 61, 249 [NASA ADS] [CrossRef] [Google Scholar]
- Wolfe, A. M., Gawiser, E., & Prochaska, J. X. 2005, ARA&A, 43, 861 [NASA ADS] [CrossRef] [Google Scholar]
- Woosley, S. E., & Weaver, T. A. 1995, ApJS, 101, 181 [Google Scholar]
- Xu, X., Henry, A., Heckman, T., et al. 2022, ApJ, 933, 202 [NASA ADS] [CrossRef] [Google Scholar]
- Yang, H., Malhotra, S., Gronke, M., et al. 2017, ApJ, 844, 171 [NASA ADS] [CrossRef] [Google Scholar]
- Yang, J., Wang, F., Fan, X., et al. 2020, ApJ, 904, 26 [Google Scholar]
- Yeh, J. Y. C., Smith, A., Kannan, R., et al. 2023, MNRAS, 520, 2757 [NASA ADS] [CrossRef] [Google Scholar]
- Zackrisson, E., Rydberg, C.-E., Schaerer, D., Östlin, G., & Tuli, M. 2011, ApJ, 740, 13 [NASA ADS] [CrossRef] [Google Scholar]
- Zavala, J. A., Castellano, M., Akins, H. B., et al. 2024, arXiv e-prints [arXiv:2403.10491] [Google Scholar]
All Tables
Line flux measurements for the most prominent nebular emission lines JWST-PRIMAL sample.
All Figures
|
Fig. 1. Absolute rest-frame UV magnitude (MUV) as a function of the spectroscopic redshift for the JWST/NIRSpec Prism sources at z > 2 from DJA with robust spectroscopic redshifts (grade 3) shown in gray. The JWST-PRIMAL sources are highlighted by the red squares, selected by requiring zspec > 5.0, an integrated S/N > 3 around the redshifted Lyα wavelength region, and full NIRSpec Prism spectroscopic wavelength coverage from 0.6–5.3 μm as outlined in Sect. 2.3. |
| In the text | |
|
Fig. 2. Schematic highlighting the intrinsic physical models affecting the shape of the Lyα transmission from an example galaxy at z = 9.0, all convolved by the nominal JWST/NIRSpec Prism spectral resolution. The default model with xHI = 0.5 is shown at the top left, where the grey-shaded region represents the effect of a partly (xHI = 0.01) to fully neutral (xHI = 1.0) IGM. For illustrative purposes the expected IGM density field at z = 9 is shown in the top right, extracted from the ASTRAEUS simulations. In the bottom panels are shown the combined effects of the default IGM model and various sizes of the ionized UV bubble (left, blue: Rb = 1, 10, 50 cMpc) and DLAs from local H I gas reservoirs (right, red: NHI = 1021, 1022, 1023 cm−2). The integration region for DLyα is marked by the top line in all the Lyα transmission curve figures and is defined to encapsulate all the predicted physical scenarios. |
| In the text | |
|
Fig. 3. Three examples of normalized NIRSpec Prism spectra from the JWST-PRIMAL sample. The top panel shows an example of a strong DLA from local H I absorption, the middle panel a strong LAE, and the bottom panel a combination of both. The redshifts, DLyα measurements, and DLyα integration regions are highlighted for each case. |
| In the text | |
|
Fig. 4. Example of line flux modeling for one of the PRIMAL sources at z = 6.6345. The JWST/NIRSpec Prism spectrum is shown in black and the associated error spectrum in gray. The best fit continuum and Gaussian line model is shown in red. |
| In the text | |
|
Fig. 5. Example of a [O III]+Hβ line equivalent width measurement. The blue-shaded region marks the lines integrated over, also represented by the top red bar. The continuum flux is measured by fitting a linear polynomial to the spectrum on each side of the lines. |
| In the text | |
|
Fig. 6. [O III]+Hβ emission line equivalent width distribution (bottom) and normalized cumulative distribution function (top). The full sample up to z ≈ 9.5, where these lines can be detected, is shown by the black step function, and divided into redshift bins as indicated by the colors. The observed distribution of the spectroscopic JWST-PRIMAL sample is compared to the larger photometric CEERS survey results from Endsley et al. (2023). |
| In the text | |
|
Fig. 7. Example of spectral fitting of the UV power-law index, βUV, where Fλ ∝ λβUV, of the stellar continuum. The grey curve shows the full NIRSpec Prism spectrum of a galaxy at z = 9.4383, with the error spectrum shown by the dotted line. The black part of the spectrum highlights the rest-frame fitting region from λrest = 1250 − 2600 Å. The top green bar marks the integration region for the MUV measurements, λ = 1400 − 1700 Å in the rest frame. |
| In the text | |
|
Fig. 8. Galaxy UV spectral slope, βUV, as a function of redshift. The red points mark the JWST-PRIMAL sample from this work, and the shown quantities are all derived directly from the NIRSpec Prism spectroscopy. The yellow hexagons show the mean βUV in bins denoted by the horizontal errorbars, and the vertical errorbars represent the 16th to 84th percentile of the distribution in the respective bins. The blue shaded region represents the minimum value βUV = −2.6 to −2.4 for a standard stellar population with negligible dust and maximum nebular continuum contribution (see Sect. 3.4 and Cullen et al. 2024). |
| In the text | |
|
Fig. 9. Example of joint gas-phase metallicity estimate for one of the sources. The blue-colored function shows the normalized joint probability density function (PDF) based on the normalized PDFs of the individual line-ratio diagnostics from Sanders et al. (2024). The blue dashed line marks the median of the joint PDF. |
| In the text | |
|
Fig. 10. Lyα damping parameter, DLyα, for the full JWST-PRIMAL sample as a function of redshift. The corresponding age of the Universe assuming the cosmological parameters from Planck Collaboration VI (2020) is given at the top. The colored backgrounds indicate the typical physical regimes probed for a given DLyα: Strong Lyα emission (DLyα < 0 Å; blue), extended ionized bubbles or weak Lyα emission (DLyα = 0–35 Å; orange), IGM absorption from xHI = 0–1 (DLyα = 35–55 Å; green), and strong galaxy integrated DLAs with NHI > 1021 cm−2 from local H I gas (DLyα > 55 Å; red). |
| In the text | |
|
Fig. 11. Histogram of the Lyα damping parameter, DLyα, distribution (bottom) and normalized cumulative distribution function (top). The full JWST-PRIMAL sample is represented by the black step function, and divided into sub-bins according to their redshift as indicated by the colors. Strong DLAs are more prevalent in galaxy spectra at increasing redshift. |
| In the text | |
|
Fig. 12. Absolute UV brightness, MUV, of the JWST-PRIMAL sources as a function of DLyα. The sources with the highest Lyα EWs (negative DLyα) are observed to represent the UV faintest galaxy population at z > 5. |
| In the text | |
|
Fig. 13. Correlations of DLyα with the galaxy properties that represent the average the specific SFR ([O III]+Hβ EW, left), and the intensity of the stellar ionization field (O32 = [O III] λ5008 / [O II] λ3727, right). The square symbols show the JWST-PRIMAL sources at z < 9.5, where [O III] can be detected, and a color-coded according to their redshift (identical to Fig. 12). |
| In the text | |
|
Fig. 14. Gas-phase metallicity, 12 + log(O/H), as a function of the Lyα damping parameter, DLyα. The strength of the Lyα absorption is observed to increase with increasing metallicity, whereas Lyα emission is most efficiently produced or allowed to escape in low-metallicity galaxies. |
| In the text | |
|
Fig. 15. Comparison of DLyα to the spectral βUV slope (left) and the ionizing photon production efficiency, ξion (right). The JWST-PRIMAL sources are shown by the red squares and color-coded according to redshift (identical to Fig. 12). The light- to dark-blue colored regions in the left panel indicates increasing escape fractions of LyC photons, |
| In the text | |
|
Fig. 16. Impact of considering residual neutral hydrogen on IGM transmission curves for models with ionized bubble sizes of 1 cMpc (blue), 10 cMpc (orange) and 50 cMpc (red) and a volume-averaged IGM neutral fraction xHI = 0.1 at redshift 9. The vertical black dashed line marks the observed Lyα wavelength at this redshift. The left column shows IGM damping wings calculated using the Miralda-Escudé (1998) model, assuming that the bubbles are completely ionized. The right column shows the effect of accounting for a small amount of residual neutral gas in the bubbles, which can completely saturate the absorption in the Lyα forest. The top panel shows the models before convolving with the NIRSpec PRISM instrumental profile and the bottom panel shows the models after convolution. |
| In the text | |
|
Fig. 17. Redshift evolution of the damping parameter for continuum-normalized spectra dominated by IGM absorption. The grey shaded region shows the range of damping parameters calculated from a step function at the observed Lyα wavelength (which sets the lower limit) and the IGM damping wing calculated using the Miralda-Escudé (1998) model in a completely neutral Universe (which sets the upper limit). The colored violin plots represent the distribution of damping parameters measured from IGM damping wings generated from the Sherwood-Relics simulation of an inhomogeneously reionized IGM as presented in Keating et al. (2023a). The volume-averaged H I fraction xHI for each simulation snapshot is indicated in the legend. |
| In the text | |
|
Fig. 18. Photometric redshift, zphot, estimates relative to the spectroscopic redshifts, zspec, for the JWST-PRIMAL sample at z > 8. The sources are color-coded as a function of DLyα, as indicated by the colorbar. The photometric redshifts systematically overpredicts the actual spectroscopically derived redshifts with median zphot − zspec = 0.11 (zphot − zspec = 0.15 for DLyα > 50 Å). |
| In the text | |
Current usage metrics show cumulative count of Article Views (full-text article views including HTML views, PDF and ePub downloads, according to the available data) and Abstracts Views on Vision4Press platform.
Data correspond to usage on the plateform after 2015. The current usage metrics is available 48-96 hours after online publication and is updated daily on week days.
Initial download of the metrics may take a while.