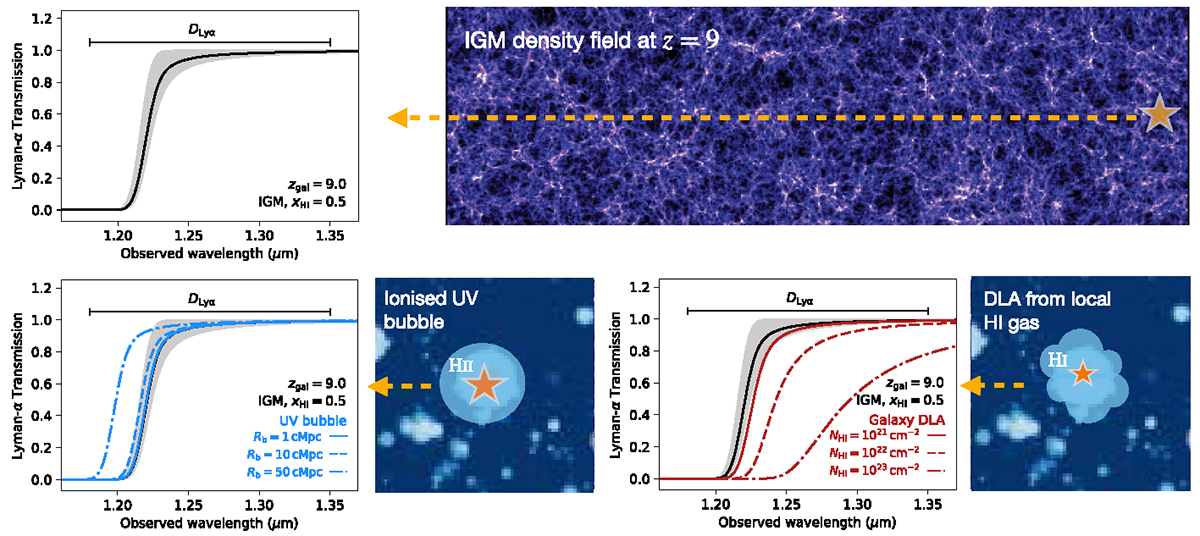
Fig. 2.
Download original image
Schematic highlighting the intrinsic physical models affecting the shape of the Lyα transmission from an example galaxy at z = 9.0, all convolved by the nominal JWST/NIRSpec Prism spectral resolution. The default model with xHI = 0.5 is shown at the top left, where the grey-shaded region represents the effect of a partly (xHI = 0.01) to fully neutral (xHI = 1.0) IGM. For illustrative purposes the expected IGM density field at z = 9 is shown in the top right, extracted from the ASTRAEUS simulations. In the bottom panels are shown the combined effects of the default IGM model and various sizes of the ionized UV bubble (left, blue: Rb = 1, 10, 50 cMpc) and DLAs from local H I gas reservoirs (right, red: NHI = 1021, 1022, 1023 cm−2). The integration region for DLyα is marked by the top line in all the Lyα transmission curve figures and is defined to encapsulate all the predicted physical scenarios.
Current usage metrics show cumulative count of Article Views (full-text article views including HTML views, PDF and ePub downloads, according to the available data) and Abstracts Views on Vision4Press platform.
Data correspond to usage on the plateform after 2015. The current usage metrics is available 48-96 hours after online publication and is updated daily on week days.
Initial download of the metrics may take a while.