Fig. 6.

Download original image
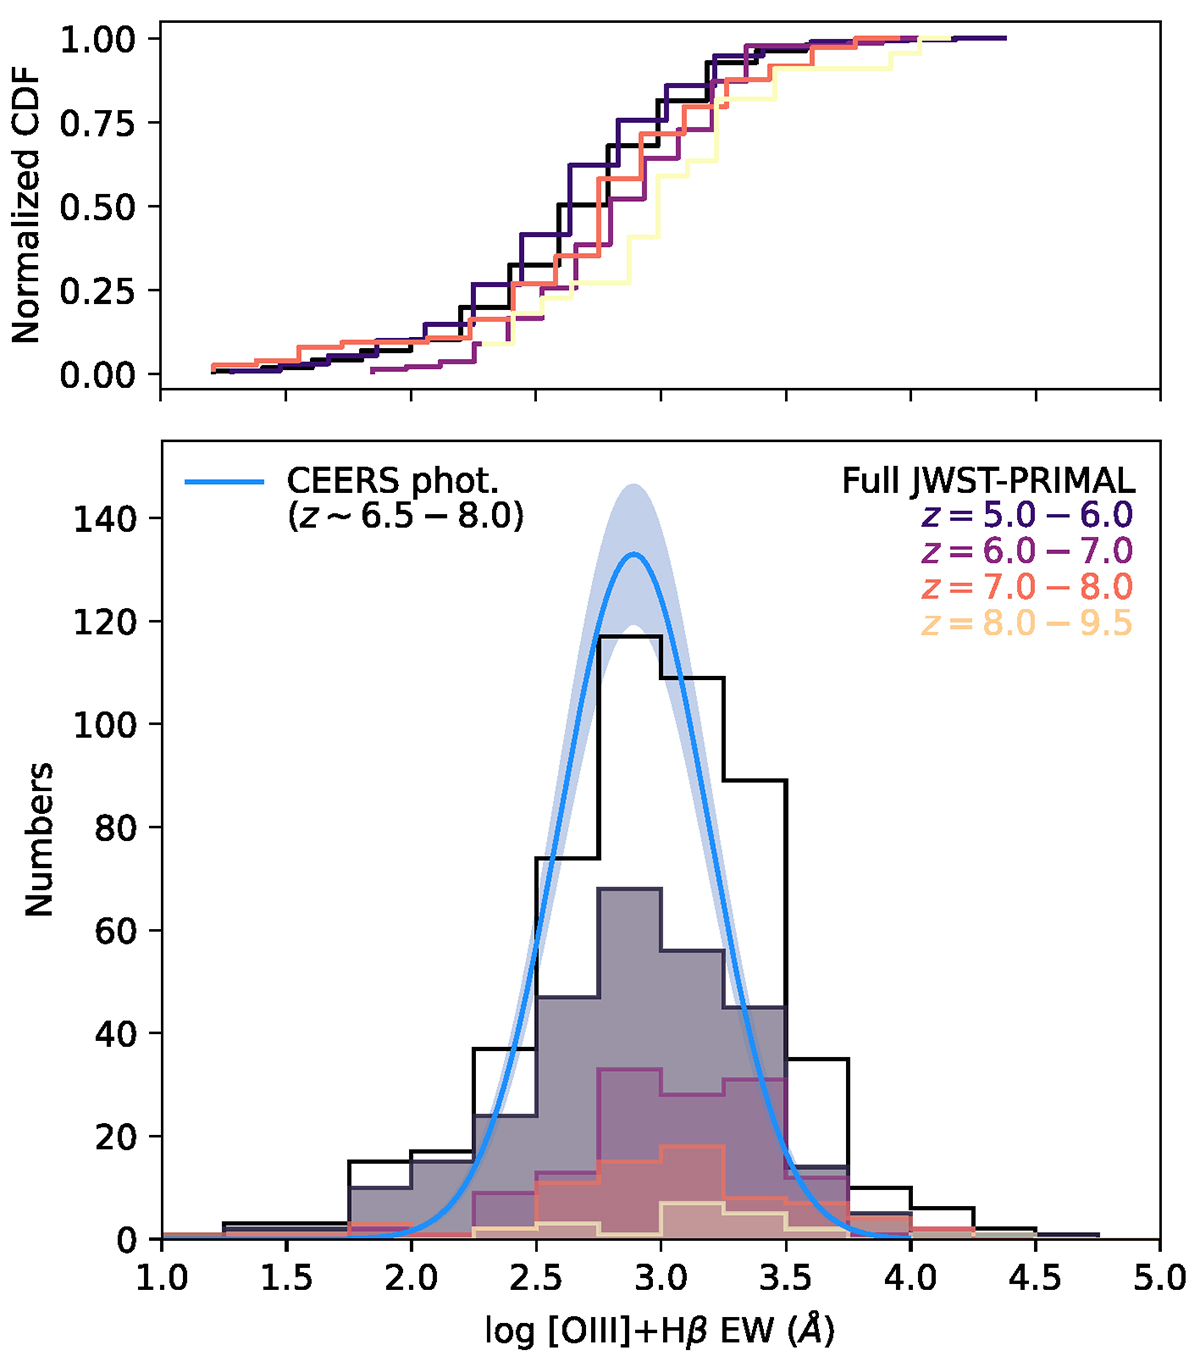
[O III]+Hβ emission line equivalent width distribution (bottom) and normalized cumulative distribution function (top). The full sample up to z ≈ 9.5, where these lines can be detected, is shown by the black step function, and divided into redshift bins as indicated by the colors. The observed distribution of the spectroscopic JWST-PRIMAL sample is compared to the larger photometric CEERS survey results from Endsley et al. (2023).
Current usage metrics show cumulative count of Article Views (full-text article views including HTML views, PDF and ePub downloads, according to the available data) and Abstracts Views on Vision4Press platform.
Data correspond to usage on the plateform after 2015. The current usage metrics is available 48-96 hours after online publication and is updated daily on week days.
Initial download of the metrics may take a while.


