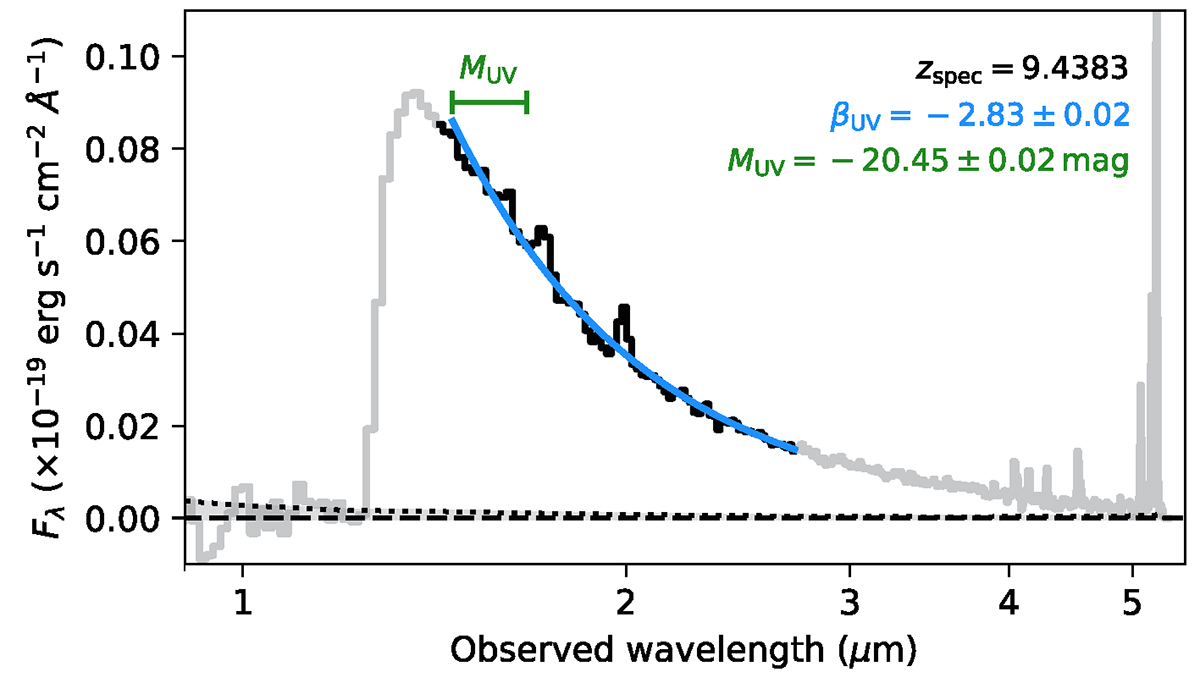
Fig. 7.
Download original image
Example of spectral fitting of the UV power-law index, βUV, where Fλ ∝ λβUV, of the stellar continuum. The grey curve shows the full NIRSpec Prism spectrum of a galaxy at z = 9.4383, with the error spectrum shown by the dotted line. The black part of the spectrum highlights the rest-frame fitting region from λrest = 1250 − 2600 Å. The top green bar marks the integration region for the MUV measurements, λ = 1400 − 1700 Å in the rest frame.
Current usage metrics show cumulative count of Article Views (full-text article views including HTML views, PDF and ePub downloads, according to the available data) and Abstracts Views on Vision4Press platform.
Data correspond to usage on the plateform after 2015. The current usage metrics is available 48-96 hours after online publication and is updated daily on week days.
Initial download of the metrics may take a while.