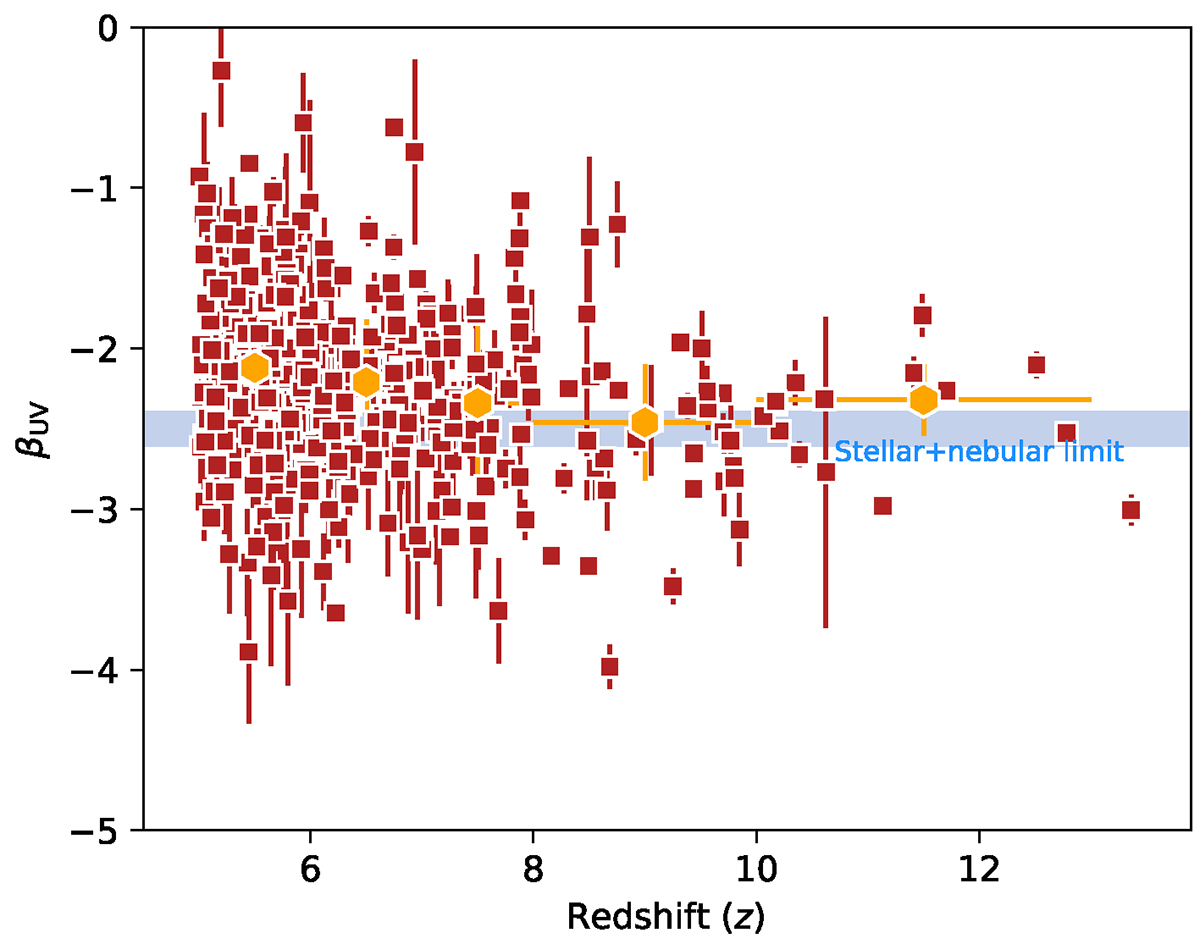
Fig. 8.
Download original image
Galaxy UV spectral slope, βUV, as a function of redshift. The red points mark the JWST-PRIMAL sample from this work, and the shown quantities are all derived directly from the NIRSpec Prism spectroscopy. The yellow hexagons show the mean βUV in bins denoted by the horizontal errorbars, and the vertical errorbars represent the 16th to 84th percentile of the distribution in the respective bins. The blue shaded region represents the minimum value βUV = −2.6 to −2.4 for a standard stellar population with negligible dust and maximum nebular continuum contribution (see Sect. 3.4 and Cullen et al. 2024).
Current usage metrics show cumulative count of Article Views (full-text article views including HTML views, PDF and ePub downloads, according to the available data) and Abstracts Views on Vision4Press platform.
Data correspond to usage on the plateform after 2015. The current usage metrics is available 48-96 hours after online publication and is updated daily on week days.
Initial download of the metrics may take a while.