Fig. 17.
Download original image
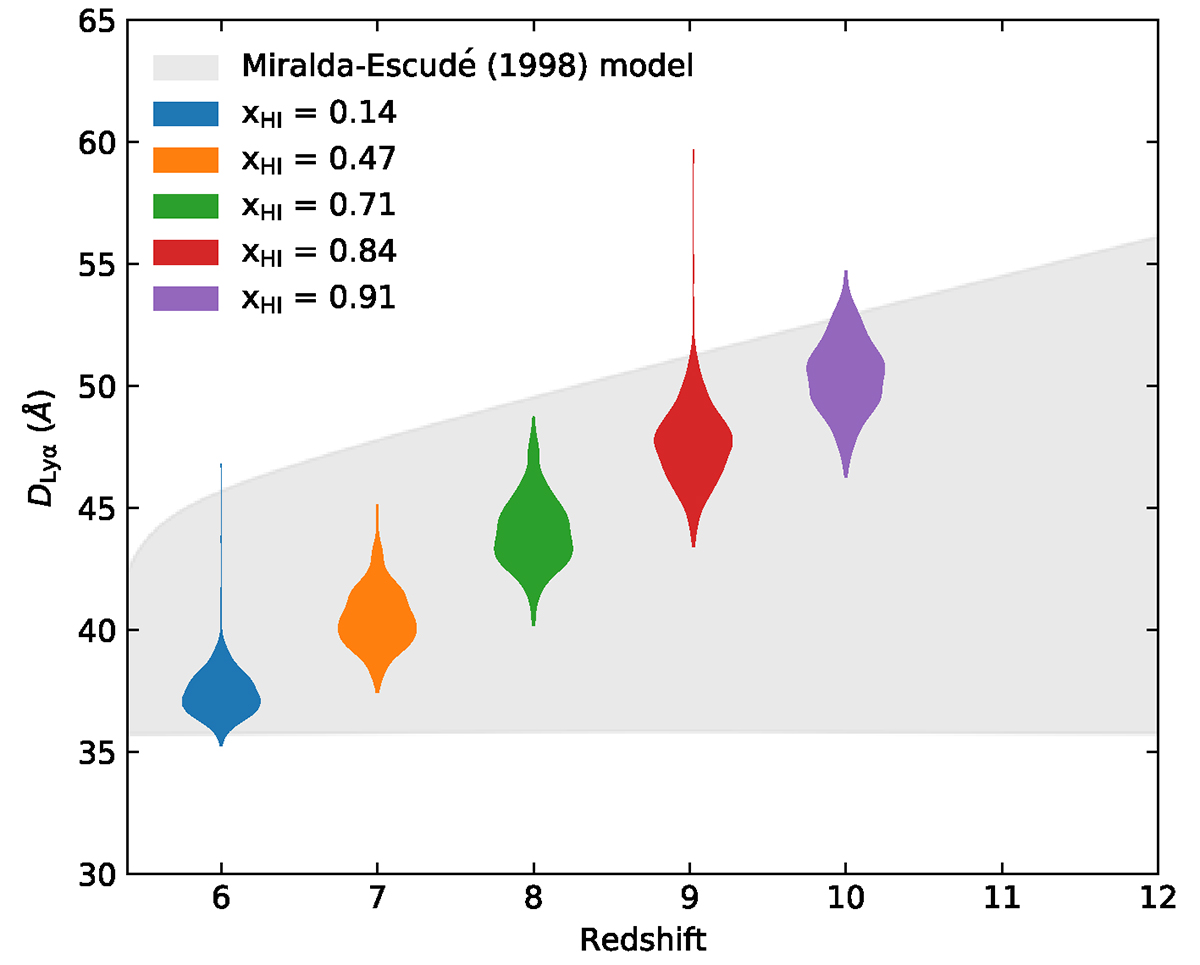
Redshift evolution of the damping parameter for continuum-normalized spectra dominated by IGM absorption. The grey shaded region shows the range of damping parameters calculated from a step function at the observed Lyα wavelength (which sets the lower limit) and the IGM damping wing calculated using the Miralda-Escudé (1998) model in a completely neutral Universe (which sets the upper limit). The colored violin plots represent the distribution of damping parameters measured from IGM damping wings generated from the Sherwood-Relics simulation of an inhomogeneously reionized IGM as presented in Keating et al. (2023a). The volume-averaged H I fraction xHI for each simulation snapshot is indicated in the legend.
Current usage metrics show cumulative count of Article Views (full-text article views including HTML views, PDF and ePub downloads, according to the available data) and Abstracts Views on Vision4Press platform.
Data correspond to usage on the plateform after 2015. The current usage metrics is available 48-96 hours after online publication and is updated daily on week days.
Initial download of the metrics may take a while.