Open Access
Fig. 4.
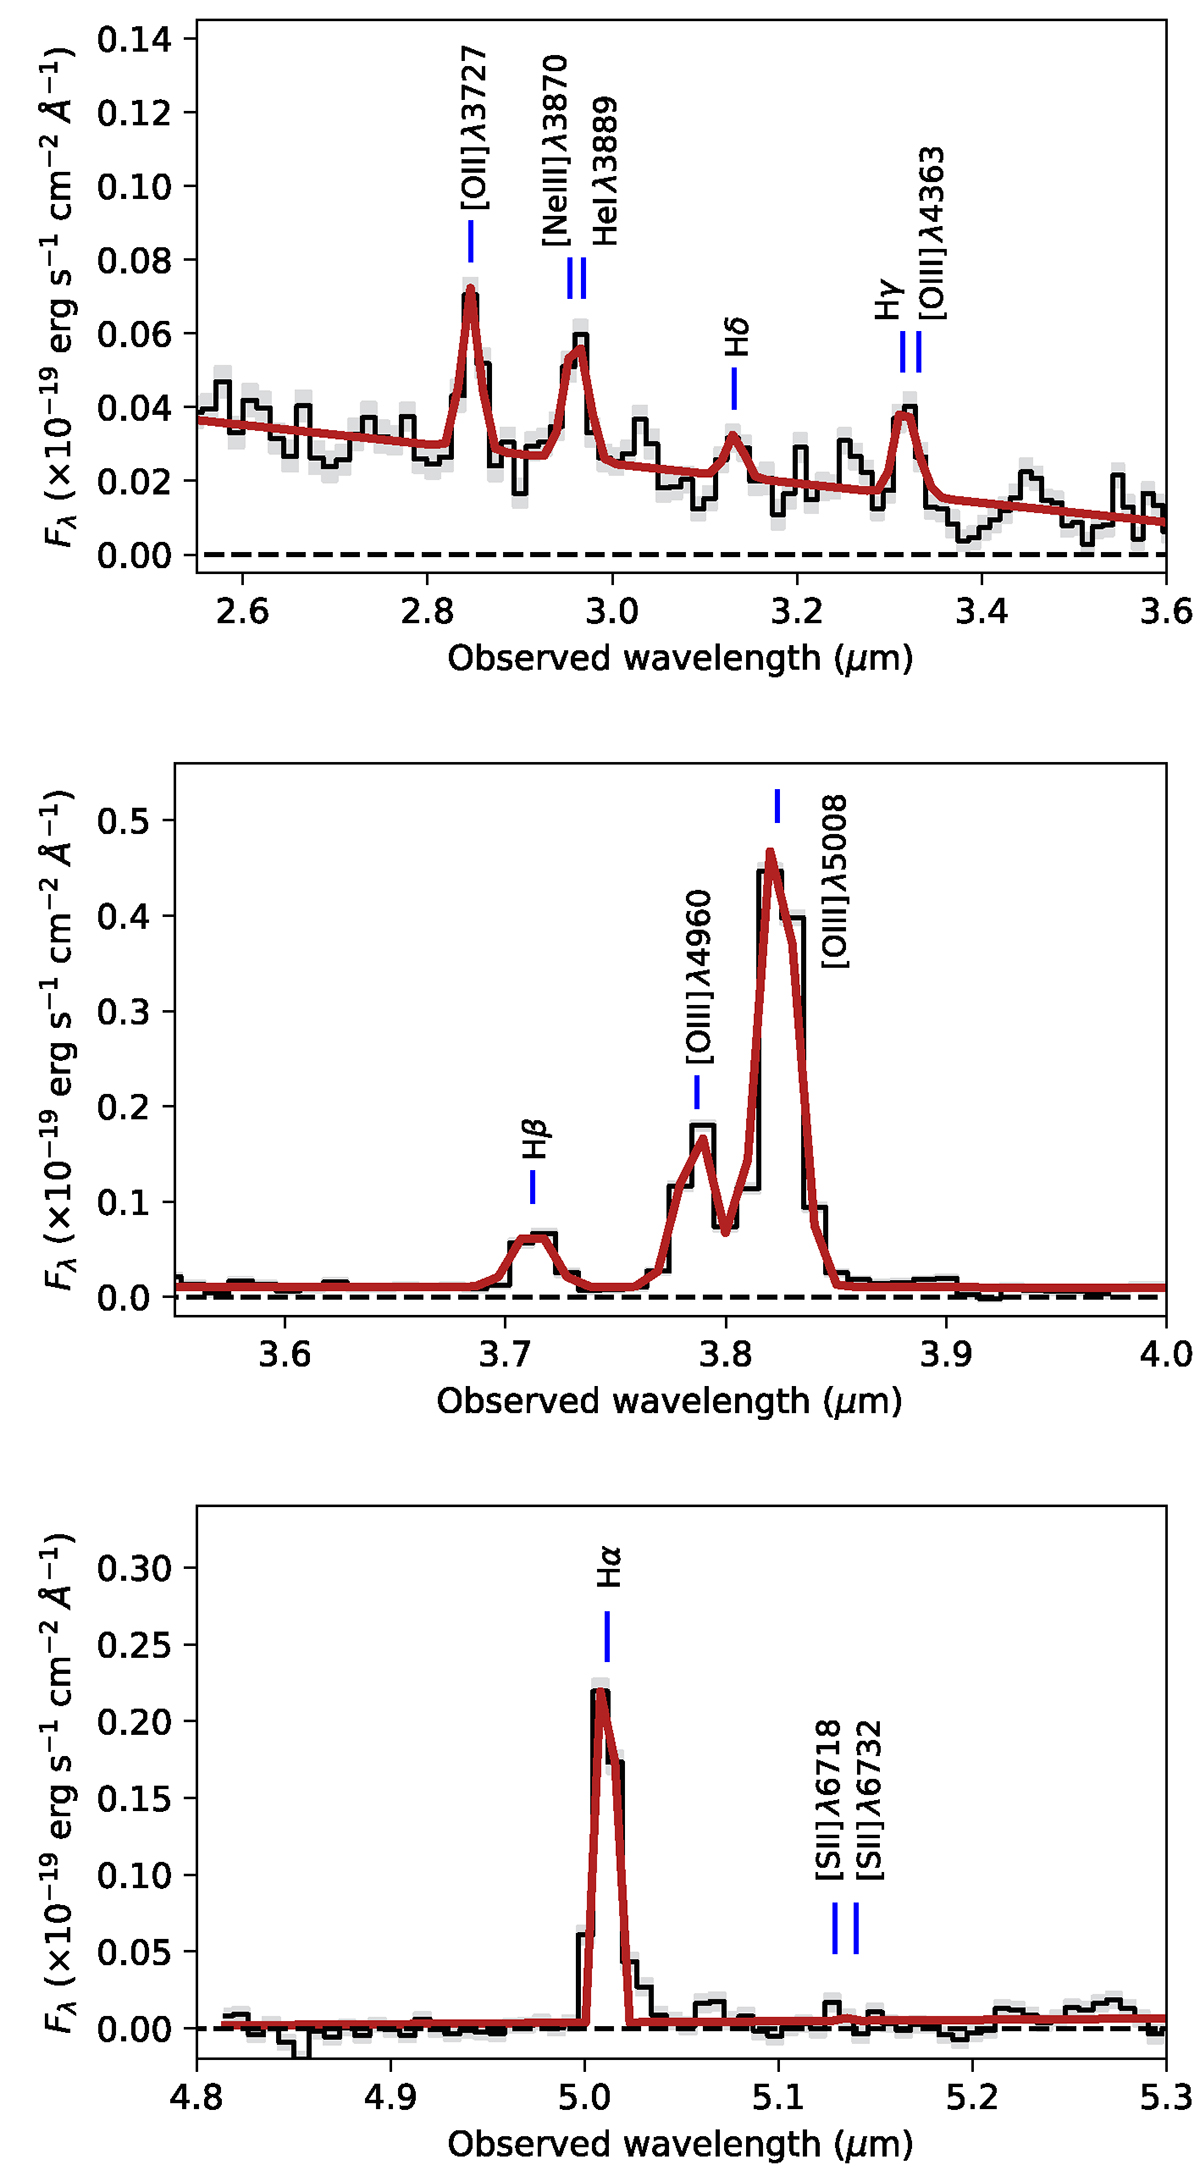
Download original image
Example of line flux modeling for one of the PRIMAL sources at z = 6.6345. The JWST/NIRSpec Prism spectrum is shown in black and the associated error spectrum in gray. The best fit continuum and Gaussian line model is shown in red.
Current usage metrics show cumulative count of Article Views (full-text article views including HTML views, PDF and ePub downloads, according to the available data) and Abstracts Views on Vision4Press platform.
Data correspond to usage on the plateform after 2015. The current usage metrics is available 48-96 hours after online publication and is updated daily on week days.
Initial download of the metrics may take a while.