Open Access
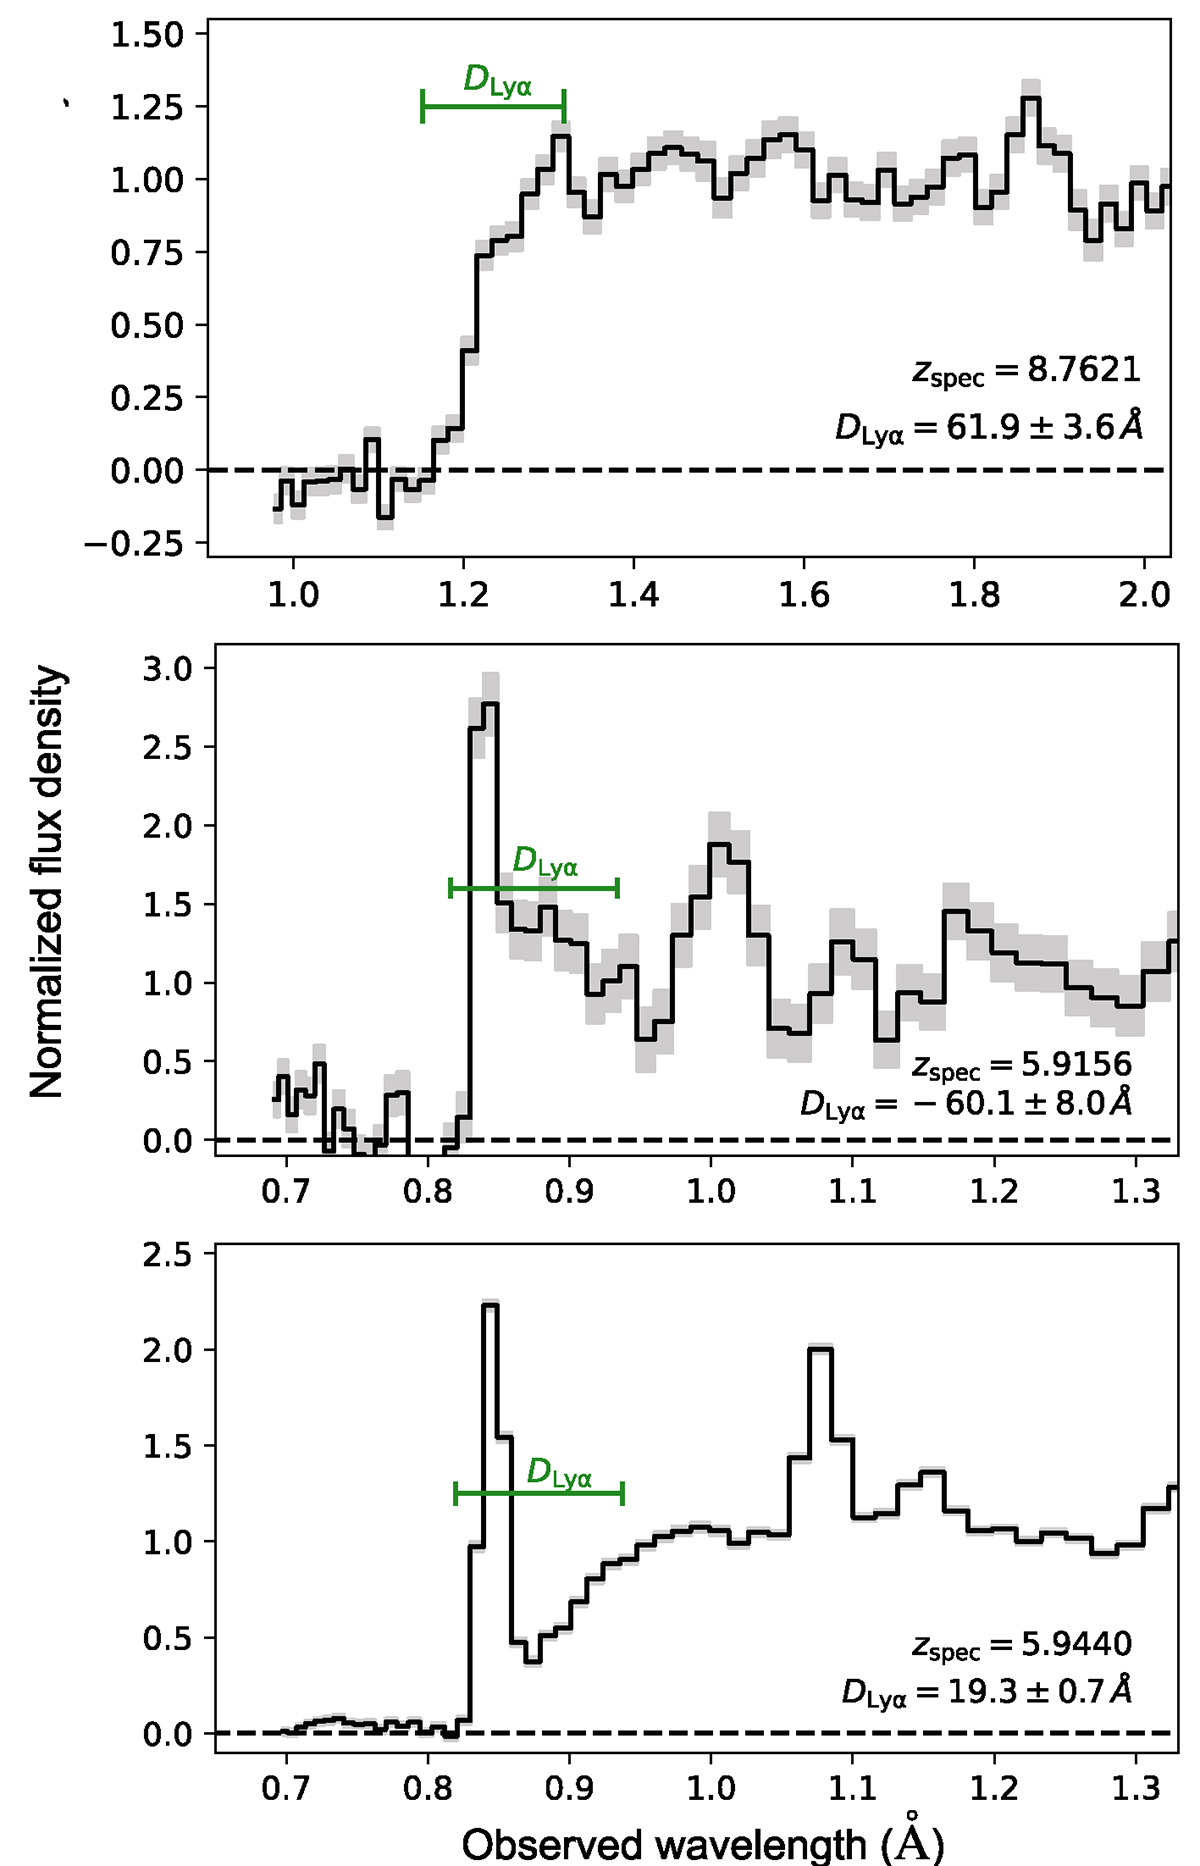
Fig. 3.
Download original image
Three examples of normalized NIRSpec Prism spectra from the JWST-PRIMAL sample. The top panel shows an example of a strong DLA from local H I absorption, the middle panel a strong LAE, and the bottom panel a combination of both. The redshifts, DLyα measurements, and DLyα integration regions are highlighted for each case.
Current usage metrics show cumulative count of Article Views (full-text article views including HTML views, PDF and ePub downloads, according to the available data) and Abstracts Views on Vision4Press platform.
Data correspond to usage on the plateform after 2015. The current usage metrics is available 48-96 hours after online publication and is updated daily on week days.
Initial download of the metrics may take a while.