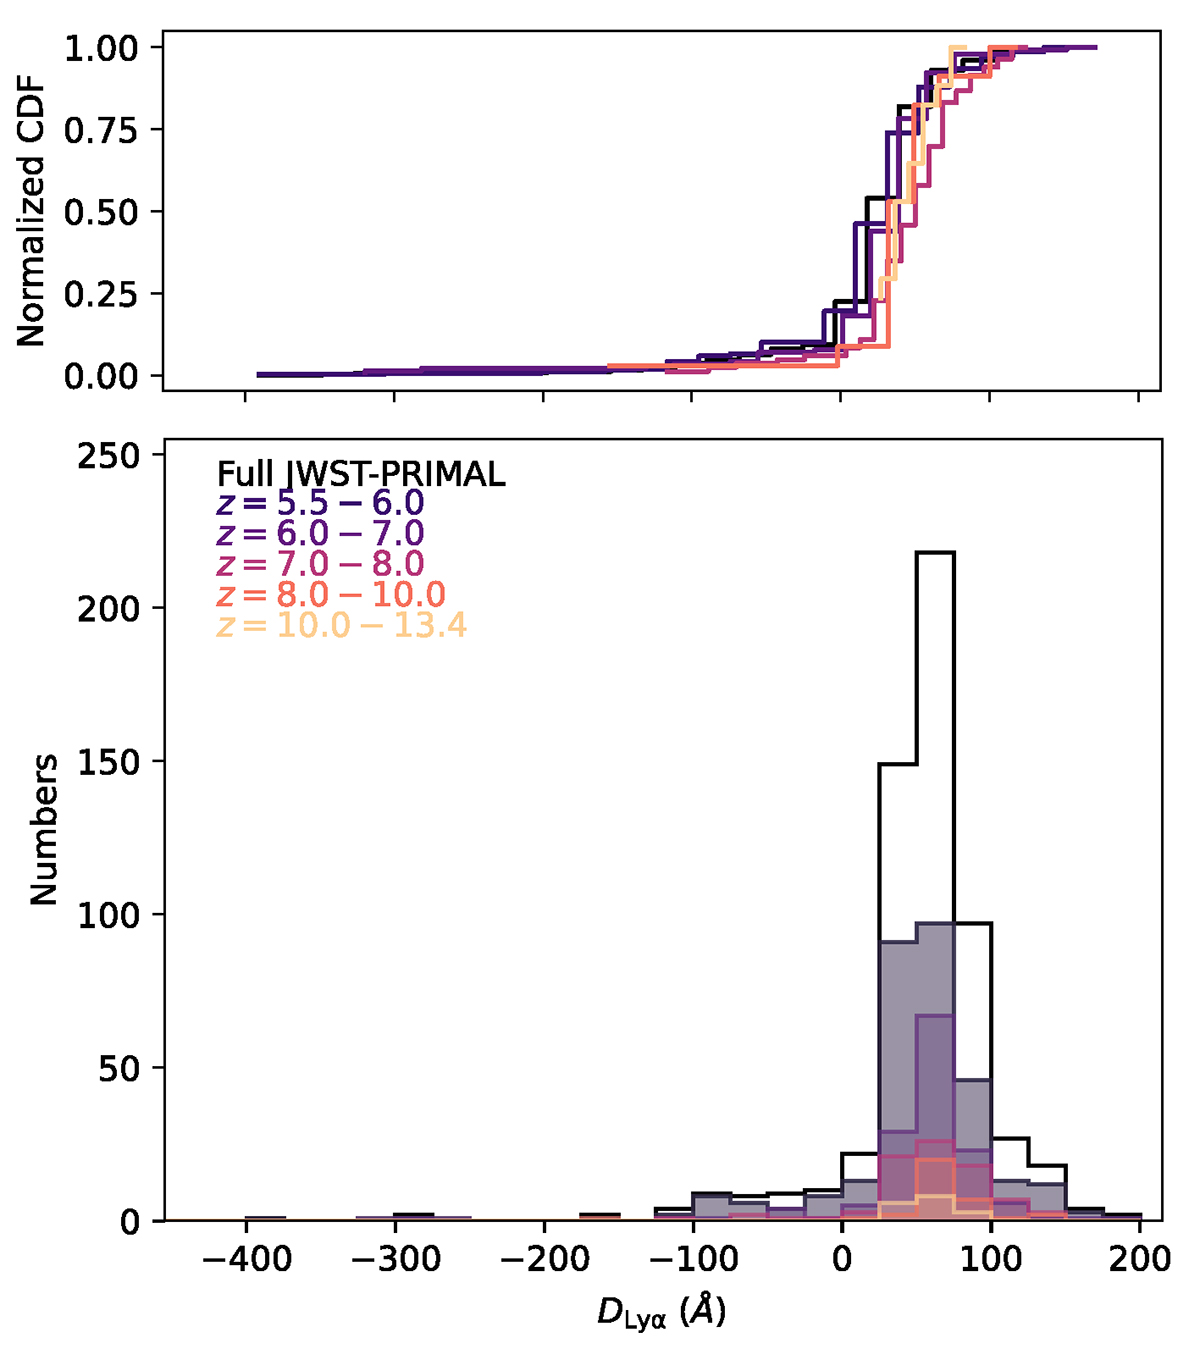
Fig. 11.
Download original image
Histogram of the Lyα damping parameter, DLyα, distribution (bottom) and normalized cumulative distribution function (top). The full JWST-PRIMAL sample is represented by the black step function, and divided into sub-bins according to their redshift as indicated by the colors. Strong DLAs are more prevalent in galaxy spectra at increasing redshift.
Current usage metrics show cumulative count of Article Views (full-text article views including HTML views, PDF and ePub downloads, according to the available data) and Abstracts Views on Vision4Press platform.
Data correspond to usage on the plateform after 2015. The current usage metrics is available 48-96 hours after online publication and is updated daily on week days.
Initial download of the metrics may take a while.