| Issue |
A&A
Volume 653, September 2021
|
|
|---|---|---|
| Article Number | A151 | |
| Number of page(s) | 19 | |
| Section | Extragalactic astronomy | |
| DOI | https://doi.org/10.1051/0004-6361/202140830 | |
| Published online | 24 September 2021 | |
Search for candidate strongly lensed dusty galaxies in the Planck satellite catalogues
1
INAF, Istituto di Radioastronomia, Via Piero Gobetti 101, 40129 Bologna, Italy
e-mail: trombetti@ira.inaf.it
2
Dipartimento di Fisica e Scienze della Terra, Università di Ferrara, Via Giuseppe Saragat 1, 44122 Ferrara, Italy
3
INFN, Sezione di Bologna, Via Irnerio 46, 40127 Bologna, Italy
4
INAF, Italian ALMA Regional Centre, Via Piero Gobetti 101, 40129 Bologna, Italy
5
INAF, Osservatorio Astronomico di Padova, Vicolo dell’Osservatorio 5, 35122 Padova, Italy
6
Instituto de Física de Cantabria, CSIC-UC, Av. de Los Castros s/n, 39005 Santander, Spain
7
Departamento de Física Moderna, Universidad de Cantabria, 39005 Santander, Spain
8
School of Physics and Astronomy, Cardiff University, The Parade, Cardiff CF24 3AA, UK
9
Osservatorio Astronomico di Trieste, Via G. B. Tiepolo, 11, 34143 Trieste, Italy
Received:
18
March
2021
Accepted:
30
July
2021
The shallow, all-sky Planck surveys at sub-millimetre wavelengths have detected the brightest strongly gravitationally lensed dusty galaxies in the sky. The combination of their extreme gravitational flux-boosting and image-stretching offers the unique possibility of measuring in extraordinary detail the galaxy structure and kinematics in early evolutionary phases through high-resolution imaging and spectroscopic follow-up. This enables us to gain otherwise unaccessible direct information on physical processes in action. However, the extraction of candidate strongly lensed galaxies from Planck catalogues is hindered by the fact that they are generally detected with a poor signal-to-noise ratio, except for the few brightest galaxies. Their photometric properties are therefore strongly blurred, which makes them very difficult to single out. We have devised a method capable of increasing the number of identified Planck-detected strongly lensed galaxies by a factor of about three to four, although with an unavoidably limited efficiency. Our approach exploits the fact that the sub-millimetre colours of strongly lensed galaxies are definitely colder than those of nearby dusty galaxies, which constitute the overwhelming majority of extragalactic sources detected by Planck. The sub-millimetre colours of the 47 confirmed or very likely Planck-detected strongly lensed galaxies have been used to estimate the colour range spanned by objects of this type. Moreover, most nearby galaxies and radio sources can be confirmed by cross-matching with the IRAS and PCNT catalogues, respectively. We present samples of lensed candidates selected at 545, 857, and 353 GHz, comprising 177, 97, and 104 sources, respectively. The efficiency of our approach, tested by exploiting data from the SPT survey covering ≃2500 deg2, is estimated to be in the range 30%−40%. We also discuss stricter selection criteria to increase the estimated efficiency to ≃50%, at the cost of a somewhat lower completeness. Our analysis of SPT data has identified a dozen galaxies that can reliably be considered previously unrecognized Planck-detected strongly lensed galaxies. Extrapolating the number of Planck-detected confirmed or very likely strongly lensed galaxies found within the SPT and H-ATLAS survey areas, we expect ≃150 to ≃190 such sources over the full |b|> 20° sky.
Key words: gravitational lensing: strong / submillimeter: galaxies / galaxies: high-redshift
© ESO 2021
1. Introduction
An interesting and unexpected (but see Negrello et al. 2007) result from Planck was the detection of ultra-bright strongly lensed sub-millimetre galaxies (SMGs) at high redshift, z, discovered by Herschel with extreme magnifications, μ, in the range 10−50 (Herranz et al. 2013; Cañameras et al. 2015; Harrington et al. 2016, 2021; Díaz-Sánchez et al. 2017). These objects offer the unique opportunity to obtain detailed information on the internal structure, gas properties, and kinematics of high-z galaxies during their most active, dust-enshrouded star formation phase (Fu et al. 2012; Nesvadba et al. 2016, 2019; Cañameras et al. 2017a,b, 2018a,b, 2021; Harrington et al. 2018, 2019; Dannerbauer et al. 2019; Planck Collaboration Int. LV 2020).
This information is absolutely crucial for understanding the key processes governing the galaxy formation and early evolution. Current galaxy formation models envisage widely different physical mechanisms that shaped the galaxy properties: mergers, interactions, cold flows from the intergalactic medium, in situ processes (for reviews, see Silk & Mamon 2012; Somerville & Davé 2015). All models have a large number of adjustable parameters that allow them to be consistent with the available statistical information (source counts and redshift distributions).
The only way to obtain direct information on the physical processes at work is to look inside the high-z star-forming galaxies. These are compact, however, with typical effective radii of 1−2 kpc (e.g. Shibuya et al. 2015, 2019; Spilker et al. 2016; Hodge et al. 2016; Ikarashi et al. 2017; Enia et al. 2018; Fujimoto et al. 2018, 2020), corresponding to angular radii of 0.1−0.2 arcsec at z ≃ 2−3. Thus they are hardly resolved even by the Atacama Large Millimeter/submillimeter Array (ALMA) or the Hubble Space Telescope (HST). If they are resolved, high enough signal-to-noise ratios (S/Ns) per resolution element are achieved only for the brightest galaxies, which are probably not representative of the general population.
Strong gravitational lensing provides a solution of these problems, allowing us to study high-z galaxies in extraordinary detail that are otherwise beyond the reach of present-day instrumentation (e.g. Sun et al. 2021). This is possible thanks to the magnification of the galaxy flux combined with a stretching of images. Because lensing conserves the surface brightness, the effective angular size is stretched by a factor μ1/2 on average.
A spectacular example are ALMA observations with a 0.1″ resolution of the strongly lensed galaxy PLCK_G244.8+54.9 at z ≃ 3.0 with μ ≃ 30 (Cañameras et al. 2017b): they reached the astounding spatial resolution of ≃60 pc, which is substantially smaller than the size of Galactic giant molecular clouds. Cañameras et al. (2017b) have also obtained CO spectroscopy, measuring the kinematics of the molecular gas with an uncertainty of 40−50 km s−1. This spectral resolution enables a direct investigation of massive outflows driven by active galactic nuclei (AGN) feedback at high-z, with predicted velocities of ∼1000 km s−1 (King & Pounds 2015).
Outflows are advocated by all the main galaxy formation models to explain the star formation inefficiency in galaxies (only ∼10% of the baryons end up in stars). However, the observational confirmation of outflows of the direct fuel for star formation (i.e. molecular gas) is very difficult to achieve at high-z due to the weakness of their spectral signatures (for a review, see Veilleux et al. 2020). Even when outflows are detected, a proper assessment of their properties is limited by the spatial resolution and sensitivity of instruments.
Strong lensing allowed Spilker et al. (2018) and Jones et al. (2019) to detect fast, massive molecular outflows in galaxies at z = 5.293 and 5.656, respectively, by means of ALMA spectroscopy. The galaxies were discovered in the South Pole Telescope (SPT) survey. Spilker et al. (2020) found unambiguous evidence for outflows in 8 out of 11 SPT lensed galaxies at z > 4.
Prolific searches of strongly lensed galaxies have been carried out in the optical (Cao et al. 2020; Talbot et al. 2021, and references therein). The millimetre (mm) and sub-mm surveys not only complement the optical surveys by extending the selection to dust-enshrouded galaxies, but also reach higher redshifts both of background-lensed galaxies and of foreground lenses, as illustrated by Fig. 1. The mm/sub-mm region is exceptionally well suited to reach high redshifts due to the large, negative K-correction and to the strong cosmological evolution. A further advantage is that lensed SMGs are generally free from blending with foreground lenses and are detected in different wavebands.
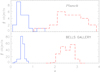 |
Fig. 1. Redshift distributions of the background-lensed galaxies (solid blue histograms) and of the foreground lenses (dashed red histograms) detected by Planck compared with those of the 187 strong gravitational lens candidates in the BELLS GALLERY survey parent sample (Shu et al. 2016). |
Negrello et al. (2007) predicted that essentially all high-z galaxies brighter than S500 μm = 100 mJy detected by the Herschel surveys would be strongly lensed (magnification μ ≥ 2) and pointed out that they might be identified with close to 100% efficiency because the other extragalactic sources above this flux density limit would have been easily recognizable local galaxies plus a small fraction of radio sources. This prediction proved to be accurate, and a total of about 170 candidate strongly lensed galaxies with S500 μm ≥ 100 mJy have been selected by Negrello et al. (2010, 2017), Wardlow et al. (2013), and Nayyeri et al. (2016) from the Herschel Astrophysical Terahertz Large Area Survey (H-ATLAS; Eales et al. 2010), the Herschel Multitiered Extragalactic Survey (HerMES; Oliver et al. 2012), and the HerMES Large Mode Survey (HeLMS) plus Herschel Stripe 82 Survey (HerS; Viero et al. 2014) catalogues, respectively.
To enlarge the sample of Herschel-detected strongly lensed galaxies, it is necessary to investigate at lower flux densities, where these objects are mixed with an increasing fraction of unlensed high-z galaxies. Methods proposed for extracting strongly lensed galaxies exploit the fact that they are located within arcseconds from the galaxy acting as the lens (González-Nuevo et al. 2012, 2019; Bakx et al. 2020). These lens galaxies are close enough to the Herschel galaxies to be interpreted as their optical counterparts by likelihood ratio techniques (e.g. Bourne et al. 2016), but they cannot be the sources themselves because they are generally massive ellipticals containing old stellar populations, hence with negligible far-infrared (far-IR) and sub-mm emission.
Planck sub-mm surveys are much shallower that the Herschel surveys: their detection limits are higher by more than one order of magnitude. However, the all-sky coverage of the Planck mission provided the unique capability of detecting the brightest strongly lensed high-z SMGs in the sky, that is, those that are best suited to deliver high spatial and spectral resolution follow-up data. The shallowness of Planck surveys implies that only really extreme magnifications can boost high-z galaxy flux densities above the detection limits. To place the argument in context, we recall that essentially all high-z SMGs brighter than 100 mJy at 600 GHz (500 μm) were found to be strongly lensed (Negrello et al. 2010, 2017; Wardlow et al. 2013; Nayyeri et al. 2016), but the brightest candidate strongly lensed galaxy detected over the 602 deg2 of the H-ATLAS has a flux density of 465.7 mJy at 857 GHz (Negrello et al. 2017). For comparison, the 90% completeness limit at this frequency of the second Planck Catalogue of Compact Sources (PCCS2; Planck Collaboration XXVI 2016) in the so-called extragalactic zone is of 791 mJy. Correspondingly, the estimated gravitational magnifications of Planck-detected lensed galaxies, mostly in the range 10−50 (Cañameras et al. 2015; Harrington et al. 2021), are substantially higher than those of H-ATLAS lensed galaxies, which are in the range ∼5−15 (Negrello et al. 2017; Enia et al. 2018). The unique possibilities offered by the Planck selection are clear.
Searching the literature, we have collected a total of 27 Planck-detected strongly lensed galaxies (Table 1). All but two of them are listed in the Second Planck Catalogue of Compact Sources (PCCS2; Planck Collaboration XXVI 2016), one in the PCCS2E, which contains sources with unknown reliability, and one in the catalogue of Planck high-z source candidates, detected in the cleanest 26% of the sky (PHz catalogue; Planck Collaboration Int. XXXIX 2016).
Confirmed strongly lensed galaxies detected by Planck.
Cañameras et al. (2015) listed three more sources as Planck-detected (at right ascension and declination (RA, Dec) in deg: 139.619, 51.7064; 171.8108, 42.4736; 217.3249, 59.3525). Another four sources were listed by Harrington et al. (2016) and/or Harrington et al. (2021) at 200.5730, 9.3907; 200.7615, 55.6003; 217.0995, 35.4389; 348.4860, and 1.1549. None of them appears in the last versions of the online Planck catalogues.
The measured redshifts are in the range 1.3−3.6, implying that a statistically well-defined sample of Planck-lensed galaxies would be very well suited for investigating the structure of galaxies across the peak of the cosmic star formation rate. However, searches have been fragmentary so far and were conducted over limited sky areas, implying that the available sample is highly inhomogeneous and incomplete.
Finding the rare Planck-detected strongly lensed galaxies among the several thousand local dusty galaxies is difficult, however. Statistical selection techniques such as those successfully used to select Herschel-detected strongly lensed candidates fainter than S500 μm = 100 mJy (González-Nuevo et al. 2012, 2019; Bakx et al. 2020), mentioned above, cannot be applied: the typical rms positional error of the relevant sources, computed using Eq. (7) of Planck Collaboration XXVI (2016), is 1.5 arcmin, which is a factor of 26 larger than the typical positional error (3.4 arcsec; Bourne et al. 2016) for sources observed with the Herschel–Spectral and Photometric Imaging Receiver (SPIRE).
To search for counterparts to H-ATLAS sources, Bourne et al. (2016) considered Sloan Digital Sky Survey (SDSS) galaxies with rmodel < 22.4. Their surface density is ≃1.2 × 10⁴ deg−2, so that within the 2σ search radius of 3 arcmin, there are ≃94 SDSS galaxies on average. Similarly, the surface density of Wide-Field Infrared Survey Explorer (WISE) galaxies is ≃9.9 × 10³ deg−2 (Jarrett et al. 2017), so that there are ≃80 WISE galaxies within a 3 arcmin radius on average. For comparison, the number of chance associations within 10″, the search radius generally used in the Herschel case, is ≃0.09 (SDSS) or ≃0.08 (WISE). We did not find any valid criterion to identify plausible foreground lenses among the many dozen galaxies lying within the Planck search radius.
Another possibility would be to use machine-learning techniques to select lensed candidates. This would require massive simulations using the Planck Sky Model (Delabrouille et al. 2013), for instance, to produce a tailored training set. However, we preferred to resort to the work-intensive approach described in Sect. 2, where we also present our results. In Sect. 3 we summarise and discuss our main conclusions.
2. Method
2.1. Overview
As mentioned above, picking up strongly lensed galaxies from Planck catalogues is difficult because they are a tiny fraction of the detected sources and their flux densities are generally near the detection limit, as expected given the steepness of the bright end of their source counts (Perrotta et al. 2002, 2003; Negrello et al. 2007, 2017; Vieira et al. 2010; Mocanu et al. 2013; Everett et al. 2020). Sub-mm PCCS2 sources at high Galactic latitude (|b|> 20°)1 are mostly nearby star-forming galaxies with a small fraction of extragalactic radio sources, which dominate at cm and mm wavelengths (Planck Collaboration Int. VII 2013). In addition, there are galaxy over-densities (Planck Collaboration Int. XXVII 2015; Planck Collaboration Int. XXXIX 2016), Galactic cirrus (Herranz et al. 2013) and Galactic cold clumps (GCC; Planck Collaboration XXVIII 2016), intensity peaks of the cosmic infrared background (CIB), and the rare strongly lensed galaxies we searched for.
Because we are interested in dusty galaxies, we considered only Planck channels at ν ≥ 353 GHz. As predicted by Negrello et al. (2007) and confirmed by the analysis of H-ATLAS data (Negrello et al. 2017), unlensed dusty galaxies are at z ≲ 0.1 (see also Negrello et al. 2013) and lensed galaxies are at z > 1 (see Fig. 2) at the bright detection limits of the Planck sub-mm surveys. They therefore have substantially colder sub-mm colours.
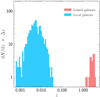 |
Fig. 2. Redshift distribution of Planck Early Release Compact Source Catalogue (ERCSC; Planck Collaboration VII 2011) galaxies detected at 545 GHz (Negrello et al. 2013, no more recent redshift distribution for a complete sample of Planck dusty galaxies is available). They are all local (z < 0.1). At fainter flux densities, strongly lensed galaxies at much higher redshifts (z ≳ 1) begin to appear, with nothing in between. The redshift distribution of known strongly lensed galaxies detected by Planck (Table 1) is shown here. The broad gap between the two populations persists at least down to a flux density of 100 mJy at 600 GHz (Negrello et al. 2017). |
Thus sub-mm colours are a distinctive property of strongly lensed galaxies. The question then is whether these sources can be selected simply based on colours. The PCCS2 photometry is frequently limited to one or two frequencies, which is not enough to answer this question. Fortunately, multi-band photometry obtained with the Bayesian extraction and estimation package (BeeP) has recently been published (Planck Collaboration Int. LV 2020). We selected sources with S545 ≥ 500 mJy at high Galactic latitudes (|b|≥20°). This flux density limit is slightly lower than the 90% completeness limit in the extragalactic zone given by Planck Collaboration XXVI (2016), 555 mJy, but consistent with the limit obtained from the comparison between Planck and H-ATLAS photometry (Maddox et al. 2018).
Radio sources were identified and removed by cross-matching the BeeP sample with the Planck multi-frequency catalogue of non-thermal sources (PCNT; Planck Collaboration Int. LIV 2018). The distribution of sources in the S857/S545 vs S545/S353 plane is shown in Fig. 3. The ten confirmed strongly lensed galaxies comprised in the BeeP sample populate the red end of the distribution, but their positions in the diagram are not clearly separated from those of unlensed galaxies. This shows that colours are useful to remove most nearby galaxies, but these are still by far more numerous than lensed galaxies in any region encompassing the colours of the latter. The reason is that the uncertainties in the flux densities measured by Planck are so large that the differences in colour between local and lensed galaxies are blurred. Thus the selection must be refined.
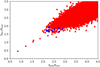 |
Fig. 3. Distribution in the S857/S545 vs S545/S353 colour–colour plot of Planck-detected galaxies with S545 ≥ 500 mJy. For this diagram we used the multi-band BeeP photometry (Planck Collaboration Int. LV 2020). Radio sources were removed by cross-matching the sample with the PCNT catalogue (Planck Collaboration Int. LIV 2018). The ten confirmed strongly lensed galaxies in this sample (filled blue circles) have colours at the red end of the distribution of the other galaxies (filled red squares). Still redder objects are likely GCC (see text). |
Figure 3 also shows that there are objects with colours even redder than those of strongly lensed galaxies. Two out of the five objects with the reddest colours (those at RA = 83.9031 deg, Dec = 22.012 deg; RA = 142.4874 deg, Dec = −23.2730 deg, with S857/S545 = 0.76, S545/S353 = 1.21 and S857/S545 = 1.12, S545/S353 = 1.56, respectively) are listed in the Planck catalogue of GCC (Planck Collaboration XXVIII 2016). The other 3 (170.8088, −48.6199; 277.4627, 1.4644; 343.5329, 16.1255 with S857/S545 = 1.22, S545/S353 = 1.86; S857/S545 = 1.03, S545/S353 = 1.54 and S857/S545 = 0.45, S545/S353 = 0.84, respectively) are also likely GCC, although the data do not yet allow a firm classification.
The BeeP catalogue contains only sources listed in the PCCS2+2E at 857 GHz. It misses some of the reddest sources that are detected at lower frequencies, including most of the known Planck-detected strongly lensed galaxies. To achieve a comprehensive selection of strongly lensed candidates, we therefore need to revisit the PCCS2 catalogues at 353 and 545 GHz. Again, we confined ourselves to sources at |b|≥20°, but to be as inclusive as possible, we did not impose any flux-density cut. We adopted the Planck DETFLUX photometry because of its sensitivity is higher than that of APERFLUX, although the latter is more robust at ≥353 GHz (Planck Collaboration XXVI 2016). Using DETFLUX, our selection criteria, specified in the sub-sections below, recover more confirmed strongly lensed galaxies than using APERFLUX. For example, at 545 GHz, we recover 18 confirmed strongly lensed galaxies, while only 11 are recovered using APERFLUX. The reason is that APERFLUX yields substantially lower S/Ns for our faint sources. Moreover, their colours are spread throughout the region that is occupied by local dusty galaxies. This shows that selection criteria based on colours are much less efficient: it is crucial for our purposes to reach deeper.
A first cleaning of the initial |b|≥20° samples at each frequency was obtained by cross-matching them with the Infrared Astronomical Satellite (IRAS) PSC/FSC2 Combined Catalogue (Abrahamyan et al. 2015) using a 3 arcmin search radius. Because the dust emission spectrum of low-z galaxies generally peaks in the range 60−150 μm (Lagache et al. 2005), that is, within or close to the IRAS wavelength range, IRAS is substantially more sensitive to these objects than Planck. Not all IRAS galaxies are at low z. About 4% are at z > 0.3, and a small fraction (0.7%) are hyper-luminous infrared galaxies and dusty quasars at z of up to ≃4, including 4 strongly lensed galaxies (Rowan-Robinson et al. 2018). However, none of the IRAS galaxies with extreme infrared (IR) luminosities, listed in Table 5 of Rowan-Robinson et al. (2018), has a PCCS2 counterpart. By dropping PCCS2 sources with IRAS counterparts, we thus rid the sample of nearby dusty galaxies without affecting high-z objects.
The removal of radio sources is slightly less straightforward. Matches with the PCNT include dusty galaxies hosting radio nuclei. Because their sub-mm colours are dominated by dust emission, they should be dealt with as the other dusty galaxies. We therefore inspected the matches one by one and verified whether after subtracting the radio contribution extrapolated from lower frequencies, the sub-mm colours were consistent with dust emission, that is, the continuum spectra showed a steepening from mm to sub-mm wavelengths. Objects with spectra consistent with being dust-dominated at sub-mm wavelengths were kept. At first we thought that sources with counterparts in the Planck GCC catalogue should be removed, but we found that the GCCs included 8 confirmed strongly lensed galaxies and therefore refrained from removing GCC sources. This is even expected. Although Planck Collaboration XXVIII (2016) applied three independent methods for removing extragalactic sources from their sample, they were unable to identify strongly lensed galaxies, whose colours are similar to those of the GCCs.
To clean the samples further, we made a selection based on sub-mm colours. The obvious benchmark for this purpose is the sample of confirmed strongly lensed Planck-detected galaxies (Table 1). Because the number of these objects is limited, we complemented it with other Planck galaxies whose properties indicate that they are very likely strongly lensed.
Negrello et al. (in prep.) carried out observations of a preliminary sample of candidate strongly lensed galaxies with S545 ≥ 500 mJy using the Submillimeter Common-User Bolometer Array 2 (SCUBA-2), and detected 12 of them. The SCUBA-2 detection implies that these objects are point-like, that is, they are not cold extended objects like cold clumps, proto-clusters of high-z dusty galaxies, or positive fluctuations of the CIB. Their red colours imply substantial redshifts, but galaxies at substantial redshifts are almost certainly strongly lensed. This point is illustrated by Fig. 2, which shows a striking bimodality in the redshift distribution of Planck-detected galaxies. On the one hand, we have nearby late-type galaxies at z ≲ 0.1, which are easily recognizable in optical/near-infrared catalogues. On the other hand, we have dust enshrouded and therefore optically very faint, gravitationally lensed galaxies at z ≳ 1. The bimodality is inherent in shallow sub-mm surveys and was shown to persist down to detection limits much deeper than that of Planck; it is seen in Herschel surveys for Slim, 600 = 100 mJy (Negrello et al. 2017). Planck-detected galaxies at z > 0.2 would be hyperluminous infrared galaxies (HyLIRGs, LIR > 1013 L⊙). HyLIRGs are not detected at redshifts of a few tenths (Gruppioni et al. 2013); if they were present, they would have been detected by IRAS (Rowan-Robinson et al. 2018). On the other hand, the probability that SMGs undergo strong lensing is heavily suppressed at z ≲ 1 (Perrotta et al. 2002; Negrello et al. 2007; Hezaveh & Holder 2011). Only at higher redshifts there are enough very luminous IR galaxies and the optical depth for strong gravitational lensing is large enough to yield the extreme amplifications needed to make galaxies detectable by Planck (to reach the Planck detection limits, galaxies must be both intrinsically ultraluminous and very highly magnified). Three of the 12 sources detected by Negrello et al. (in prep.) with SCUBA-2 were later confirmed by Harrington et al. (2021) to be strongly lensed.
Furthermore, a cross-match of galaxies detected by Planck with the catalogues of SPT galaxies (Everett et al. 2020) yielded four more sources with redshifts indicative of strong lensing. Finally, we added the seven galaxies that are listed as Planck-detected by either Cañameras et al. (2015) or Harrington et al. (2016, 2021), which are not listed in the PCCS2, but are present in earlier versions of the Planck point source catalogues.
Most of these 47 sources do not have PCCS2 photometry at all three frequencies of interest (353, 545, and 857 GHz), as necessary to determine their sub-mm colours. To obtain uniform photometry for the full sample, we performed a multi-frequency analysis with the matrix multi-filter method described by Planck Collaboration Int. LIV (2018). This technique allowed us to derive flux density estimates or upper limits at all frequencies of interest and also to improve the S/N at the frequencies for which PCCS2 flux densities are available.
We note in passing that there are significant differences between the BeeP and the matched matrix filters (MTXF) photometry. The BeeP photometry is based on the all-sky temperature maps at 353, 545, and 857 GHz from the Planck 2015 release (PR2; Planck Collaboration I 2016), which was also the source for the PCCS2 photometry. The Beep catalogue provides two sets of flux-density estimates based on different models for the spectral energy distribution (SED): the modified blackbody (MBB), and the free model. The two sets agree well. We chose the MBB flux densities, which seem to benefit from a better background subtraction.
The MTXF photometry instead exploits the most recent publicly available release (PR3; Planck Collaboration I 2020) in the Planck Legacy Archive. However, we confirmed that using PR2 maps, we obtain very minor differences, ≃2%. Much larger differences are produced by the different methods for measuring source flux densities. The BeeP photometry agrees well with the PCCS2 APERFLUX but not with DETFLUX. For example, at 857 GHz, the DETFLUX values are lower by ∼24% on average than the BeeP values. Hence the BeeP photometry is close to aperture photometry.
In its current implementation, the MTXF method instead assumes that sources are point-like, that is, that their spatial profile is that of the instrumental beam. It is therefore closer to DETFLUX and works well for the high-z sources we are interested in. On the other hand, it is bound to underestimate the flux density of extended sources such as nearby dusty galaxies. This is indeed what we see. The ratio of the MTXF and BeeP flux densities is lower for the brightest sources, which are very nearby dusty galaxies. The mean MTXF/BeeP ratios for the 388 common sources in the parent sample are 0.78, 0.75, and 0.84 at 857, 545, and 353 GHz, respectively, which is close to the mean ratios between DETFLUX and BeeP flux densities. However, the ratios approach unity if we restrict ourselves to the weaker sources of interest here.
Another factor that may affect flux density estimates is positional accuracy. There are some differences between the positions at which MTXF and BeeP locate the sources. Planck Collaboration Int. LV (2020) argued that positional offsets can account for a difference of up to 5% between BeeP and PCSS2 APERFLUX.
The MTXF photometry at ν ≥ 217 GHz of confirmed strongly lensed galaxies in Table 1 is presented in Table 2. The distributions of the S857/S545 and S545/S353 flux density ratios of all the 47 confirmed or very likely strongly lensed galaxies are shown in Fig. 4. All sources but one have S857/S545 < 2.75. The highest S857/S545 ratio is very uncertain because the source has a low S/N at 545 GHz (S/N545 ≃ 1.5): it has an rms error of 74%, and the central value of the ratio is higher than 2.75 by only 0.36σ.
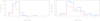 |
Fig. 4. Distributions of sub-mm colours S857/S545 and S545/S353 of the 47 confirmed plus very likely Planck-detected strongly lensed galaxies (solid blue histograms). The dashed red histograms show the distributions of the 27 confirmed strongly lensed galaxies only. |
The distribution of S545/S353 ratios is substantially broader and more uncertain. This is because the S/N is generally low at 353 GHz: about one-third of the sources have S/N353 < 3 and only 11 have S/N353 > 5. Thus this ratio did not help much with the selection, and we ignored it. We did not impose any lower limit to the S857/S545 ratio because sources with low values may be at higher redshifts than confirmed strongly lensed galaxies in our sample and thus is particularly interesting.
The application of the MTXF technique is quite demanding in terms of computer time. It is therefore not practical to apply it to all sources detected by Planck at frequencies ≥353 GHz. We therefore chose to first clean the 353 and 545 GHz samples as far as possible, exploit the available information, and to obtain the MTXF photometry for the cleaned samples alone. At 857 GHz we used the BeeP photometry. Our procedure for selecting Planck-detected strongly lensed galaxies is summarised in the flowchart of Fig. 5.
 |
Fig. 5. Flowchart summarizing our procedure to select candidate strongly lensed galaxies. |
2.2. Selection at 545 GHz
As mentioned above, we adopted 545 GHz as our reference frequency. This frequency is expected to maximize the ratio between the number of lensed and unlensed galaxies (although this ratio is nevertheless extremely low) because compared to the 857 GHz selection, it favours redder sources while being more sensitive to dusty galaxies than the 353 GHz channel.
After removing IRAS galaxies and radio sources, we were left with 556 sources. These constitute our parent sample. Applying the S857/S545 < 2.75 criterion to the MTXF photometry of the parent sample, we obtained a sample of 202 candidate strongly lensed galaxies. A check made using the National Aeronautics and Space Administration/Infrared Processing and Analysis Center (NASA/IPAC) Extragalactic Database (NED) showed that some of these sources are associated with nearby galaxies that escaped rejection based on the cross-match with the IRAS catalogue. With the help of the Aladin Sky Atlas (Bonnarel et al. 2000; Boch & Fernique 2014), we selected 25 such sources that were removed from the sample. This left the 177 candidates that are listed in Table A.1.
We also considered a stricter criterion, S857/S545 < 2.35. Only 3 confirmed or very likely strongly lensed sources exceed this limit, and for 2 of them, the ratio is quite uncertain. We found 116 sources that meet this criterion. The check on the NED showed that 5 of them are local galaxies, which left 111 sources with S857/S545 < 2.35 (see Table A.1).
A test of the efficiency of our selection of strongly lensed candidates was carried out by singling out sources within the SPT area, that is, −65° ≤Dec ≤ −40° and RA between 20 h and 7 h (Everett et al. 2020). In this area lie 15 sources with S857/S545 < 2.75, 8 of which have an STP counterpart within 3 arcmin; the latter include 1 confirmed and 4 very likely strongly lensed galaxies. The other 3 SPT matches are classified by Everett et al. (2020) as dusty unresolved sources and do not have any counterpart in the local universe. They might therefore well be high-z strongly lensed galaxies. In this case, our selection efficiency would be ∼50%. One of the 7 sources lacking an SPT counterpart (at RA = 77.30626, Dec = −55.17907) is a PHz source at zphot = 2.61 (Planck Collaboration Int. XXXIX 2016). It might be a proto-cluster of dusty galaxies. The other 6 sources might be cirrus, although other possibilities cannot be ruled out.
The 177 sources with S857/S545 < 2.75 include 13 matches with PHz objects, all with S857/S545 < 1.9, and 20 matches with GCCs (Planck Collaboration XXVIII 2016). Seven of the PHz matches and also 7 of the GCC matches are confirmed strongly lensed galaxies (see the last column of Table A.1).
There are also 7 matches with Planck SZ clusters within 5 arcmin3. Studies of the strong-lensing statistics have shown that galaxy clusters contribute substantially to the probability distribution at the very high magnifications typical of Planck-detected lensed galaxies (Hilbert et al. 2008; Lima et al. 2010; Robertson et al. 2020). Three of the confirmed strongly lensed galaxies (at RA, Dec 117.2155, 59.6982; 163.3440, 60.8636; and 323.7983, −1.0478) are associated with clusters detected by Planck through the Sunyaev-Zeldovich (SZ) effect (Planck Collaboration XXVII 2016). A cross-match of the full catalogue of PCCS2 detections at 545 GHz with the Planck SZ catalogue did not yield any other association within 5′, except for the chance alignment of the nearby bright galaxy NGC 4523, which is the obvious identification of the Planck source.
We also cross-matched our candidates with other large catalogues of confirmed galaxy clusters, namely the Massive and Distant Clusters of WISE Survey (MaDCoWS; Gonzalez et al. 2019), the COnstraining Dark Energy with X-ray (CODEX) clusters (Finoguenov et al. 2020), the Meta-Catalogue of X-ray detected Clusters of galaxies (MCXC; Piffaretti et al. 2011), and the catalogues of clusters detected through the SZ effect by the SPT (Bleem et al. 2015) and by the Atacama Cosmology Telescope (ACT; Hilton et al. 2021) surveys. We found 13 matches of our candidate strongly lensed galaxies with clusters in at least one of these catalogues. These source have a “C” label in the last column of Table A.1. A more complete analysis of the associations of our lensed candidates with galaxy clusters will be possible when the eROSITA (extended ROentgen Survey with an Imaging Telescope Array) catalogue, expected to contain ∼105 galaxy clusters (Merloni et al. 2012), will be available.
Restricting ourselves to S857/S545 < 2.35, we have 12 sources in the SPT area, with the same 8 matches with SPT sources. This corresponds to a success rate of 5 out of 12 (taking into account only the 5 confirmed or very likely strongly lensed) to 2 out of 3, in the case that all the 8 matches are strongly lensed. The numbers of matches with PHz sources and SZ clusters remain the same, the matches with GCCs decrease to 13.
2.3. Selection at 857 GHz
As shown in Table 1 some confirmed strongly lensed galaxies were detected by Planck only at 857 GHz. The sample of candidates can therefore be enriched by means of a selection at this frequency that favours lower zs. The approach we adopted is analogous to that described above, but we exploited the BeeP photometry, which is available for all sources in the PCCS2 857 GHz list and includes 3000 GHz (100 μm) flux densities extracted from the IRIS map4 at this frequency. Having photometric data both at higher and at lower frequencies improves the accuracy of the photometry at the selection frequency.
Again, we started requiring |b|≥20° and removing objects with IRAS or PCNT counterparts, but we kept PCNT sources whose sub-mm emission is dominated by dust. BeeP photometry is available for 23 confirmed or very likely strongly lensed galaxies. Except for a few outliers with low S/Ns, hence with very uncertain colours, these objects have S857/S545 < 2.75 (one outlier), S857/S3000 > 2.5 (two outliers, including the previous one), detection significance SRCSIG ≥ 5 and S857 < 2.65 Jy. We used these limits to select candidate strongly lensed galaxies, except for conservatively relaxing the one on S857 to S857 < 3 Jy and adding the requirement SNRR > 1 at each frequency, 353, 545 and 857 GHz5. These criteria yielded a sample of 133 sources, including 21 confirmed or very likely strongly lensed objects (one confirmed strongly lensed galaxy with S857/S545 < 2.75 has S/N353 < 1).
Without the 25 sources that are included in the 545 GHz sample (Table A.1) and the 11 local galaxies we found by searching for objects on the NED, we have a sample of 97 objects. We list them in Table A.2, including 8 that are confirmed or very likely lensed. The last column of Table A.2 shows that we have seven matches with the GCC catalogue, one of which is a confirmed strongly lensed galaxy. We also have two matches with the PHz catalogue, including a confirmed strongly lensed galaxy. There are no matches with Planck SZ clusters. There are, however, four associations within 5 arcmin with at least one of the catalogues mentioned in Sect. 2.2. These sources are tagged with a C label in the last column of Table A.2.
Eleven of the 97 objects lie in the SPT area. Four of these have an SPT match, including the strongly lensed galaxy at RA = 17.4822 deg, Dec = −47.0149. The source at RA = 92.9950, Dec = −55.2434 can be identified with the strongly lensed galaxy DES J0611−5514 at z = 0.7 (Diehl et al. 2017) at an angular separation of 0.76 arcmin, which is well within the Planck positional error. The other 2 objects are unresolved by the SPT, have no nearby galaxy counterpart, and therefore may well be at high-z, that is, are strongly lensed. Of the 7 objects without SPT counterpart, 3 (80.5288, −64.4013; 89.9582, −40.4288; and 332.4487, −58.7876) are located in cirrus regions; the other 4 might be CIB fluctuations or proto-clusters of dusty galaxies. When we restrict ourselves to S857/S545 < 2.3 (75 sources), we have 8 sources in the SPT area, including the 4 with SPT counterparts. In this case, the selection efficiency for strongly lensed galaxies is between 25% and 50%.
2.4. Selection at 353 GHz
The 353 GHz selection favours higher-z sources. Similarly to what we did at 545 GHz, we started from the PCCS2 353 GHz catalogue and selected objects at |b|≥20°. We removed nearby galaxies by removing matches with the IRAS PSC/FSC Combined Catalogue (Abrahamyan et al. 2015) and radio sources by removing matches with the PCNT (Planck Collaboration Int. LIV 2018) within a 3 arcmin search radius, except for sources whose sub-mm emission is dominated by dust (6 objects). This yielded a sample of 512 sources, including 19 confirmed or very likely strongly lensed galaxies. As expected, the latter have redder colours than those selected at the two higher frequencies: all of them have S857/S545 < 2. For consistency with the previous choices, we adopted S857/S545 < 2.3 to select candidate strongly lensed galaxies.
Removing sources in the 545 and 857 GHz samples (29 and 5 objects, respectively), we are left with 478 sources for which we obtained MTXF photometry. The condition S857/S545 < 2.3 leaves 228 objects. We further required an S/N at 353 GHz S/N353 > 3 and dropped the 3 sources that we found by searching the NED to be associated with low-z galaxies. The final sample, containing 104 objects, is presented in Table A.3. Thirteen of the sources in this sample have a Planck SZ cluster within 5 arcmin. A cross-match with the catalogues mentioned in Sect. 2.2 yielded 4 additional associations with galaxy clusters. These 17 sources are tagged with a C label in the last column of Table A.3. We also have 6 matches with the PHz catalogue and 7 matches with the GCC catalogue.
Twenty-one of the 104 sources in the final sample lie in the SPT area, and 5 of them have SPT counterparts within 3 arcmin. The matches include 2 high-z sources at RA, Dec in degrees (82.2573, −54.6264) and (87.4900, −53.9362) with z = 3.3689 and z = 3.128, respectively. They can be safely regarded as previously unrecognized Planck-detected strongly lensed galaxies. Two sources (41.3710, −53.0432 and 353.0972, −53.9802) have galaxy clusters in the Planck SZ catalogue along their lines of sight. The Everett et al. (2020) catalogue identifies them with cluster members. However, the cluster redshifts ≃0.3 and ≃0.4 are in the zone of avoidance in Fig. 2, that is, they are either too high or too low to belong to the Planck sources. The Planck sources are instead likely background galaxies lensed by the clusters. The fifth source (338.2416, −61.2784) is unresolved by the SPT and lacks any optical identification, suggesting that it is a high-z dust-enshrouded galaxy.
Two out of the 16 sources in the SPT area lacking an SPT identification (those at 15.7465, −49.2554 and 342.2042, −44.5310) are associated in projection with Planck SZ clusters. A search in the NED has revealed that the first source has a z = 4.16 galaxy in the background of the “El Gordo” cluster at z ≃ 0.87 as a possible counterpart. The region along the line of sight of the second source is very complex. It contains the cluster Abell S1063 at z = 0.3475 and other overdensities at z = 0.742, z ≃ 1.2 and z ≃ 3.2. Several strongly lensed galaxies have been discovered in this region, with z of up to ≃3. Our source might be one of them, or it may consist of the summed emission of dusty galaxies in high-z overdensities. The source at (41.3768, −64.3372) can be identified with the PHz source G284−48.60, a candidate high-z proto-cluster of dusty galaxies.
Above S/N353 > 4, we have 41 sources, 14 of which lie in the SPT area, with the same 5 SPT matches and the same associations with SZ clusters. A selection efficiency between ∼35% and ∼50% for very likely strongly lensed galaxies is thus indicated in this case.
3. Discussion and conclusions
As a result of a systematic search for extreme strongly lensed galaxies in the Planck catalogues, we have produced lists of candidates selected at each of the three highest Planck frequencies, 353, 545, and 857 GHz. Our approach took advantage of the fact that without the flux boosting by extreme gravitational lensing, the shallow Planck surveys at these frequencies detect only nearby (z ≲ 0.1) dusty galaxies. Only at z ≳ 1 are there enough ultraluminous galaxies and a sufficiently large lensing optical depth to allow galaxies with extreme magnifications (of up to a factor of 50; Cañameras et al. 2015) to be detectable by Planck, however, taking advantage also of the strongly negative K-correction. The wide redshift gap between these two populations implies that they have quite different sub-mm colours. High-z galaxies are substantially redder on average, although measurement errors blur the difference.
We started by selecting sources at |b|≥20° in the PCCS2 catalogues at each of the three frequencies. Next, we removed nearby galaxies and radio sources identified by cross-matching the samples with the IRAS PSC/FSC Combined Catalogue (Abrahamyan et al. 2015) and with the PCNT (Planck Collaboration Int. LIV 2018), respectively, using a 3 arcmin search radius.
Even with the benefit of extreme gravitational magnifications, the flux densities of strongly lensed galaxies are close to the detection limits. They therefore rarely have PCCS2 measurements at all frequencies ≥353 GHz, which is necessary to compute the colours. To solve this problem, we exploited the new BeeP multifrequency photometry (Planck Collaboration Int. LV 2020), which is also constrained by the IRAS 3000 GHz photometry, for the sample selected at 857 GHz. At the two lower frequencies at which the BeeP photometry is available only for a subset of sources, we obtained new MTXF multifrequency photometry. The sub-mm colours of 47 confirmed or very likely Planck-detected strongly lensed galaxies were used as a benchmark to select the colour range of the lensed candidates. All sources in the colour–selected samples were confirmed on the NED to remove those that are associated with low-z galaxies that escaped rejection by the adopted criteria.
Our main sample, selected at 545 GHz, comprises 177 lensed candidates (Table A.1). The sample selected at 857 GHz contains 97 sources after we excluded those in the 545 GHz sample (Table A.2). The sample at 353 GHz contains 104 sources (Table A.3), excluding those in the other two samples.
A test of the efficiency of our approach in selecting strongly lensed galaxies was made considering that within the area covered by the SPT survey (≃2500 deg2; Everett et al. 2020), 14 out of 19 sources selected with our method are either classified as strongly lensed by independent data (3) or can be safely regarded as previously unrecognized Planck-detected strongly lensed galaxies. This area includes 47 candidates, therefore the selection efficiency is in the range 30−40%. We discussed stricter selection criteria that increase the efficiency to ≃50% at the cost of a somewhat lower completeness: the stricter criteria miss ≃10% of the confirmed plus very likely strongly lensed galaxies recovered by the baseline criteria.
Another test can be made with reference to the H-ATLAS survey that covers ≃600 deg2. Thirteen of the objects selected with our method lie within the H-ATLAS fields. Three of them, those at (RA, Dec: 176.6239, −0.22157; 201.6254, 33.7353; and 206.1251, 30.5058), are confirmed strongly lensed galaxies (Negrello et al. 2017), corresponding to an efficiency of ≃23%, although with poor statistics (1σ range 11−46%).
The other ten sources have an H-ATLAS match within 3 arcmin. The Herschel/SPIRE flux densities of the matched sources are too faint to be identified with the Planck sources (all have F500BEST < 80 mJy)6, however. Their colours are red, and they lack possible identifications with low-z galaxies. This suggests that Planck detections are high-z overdensities, to which H-ATLAS sources belong.
Our analysis shows that probably more than 50% of sources in our samples are not strongly lensed galaxies, but a mixture of other objects with cold SEDs, such as high-z proto-clusters of dusty galaxies, Galactic cold clumps, CIB fluctuations, and Galactic cirrus. Unfortunately, we cannot exploit specific searches for these objects to clean the samples. However, the discovery of new proto-clusters and GCCs by following-up our candidates would also be a very interesting scientific result.
Planck Collaboration Int. XXXIX (2016) published a catalogue of 2151 sources with red sub-mm colours, indicative of z > 2. These high-z source candidates were extracted from Planck high-frequency maps over the 25.8% of the sky with minimum thermal emission from Galactic dust. The source detection was made using a specific component-separation procedure that allowed a much better sensitivity to this class of sources than the PCCS2. Planck Collaboration Int. XXVII (2015), based on the Herschel follow-up of 228 Planck high-z source candidates, stated that more than 93% of them are galaxy overdensities, that is, candidate proto-clusters of dusty galaxies, and 3% are strongly lensed individual galaxies. At first sight, this suggests that we might exploit the PHz to remove candidate proto-clusters from our samples, or at least to estimate their fraction.
However, as already pointed out by Planck Collaboration Int. XXXIX (2016), the overlap between the PHz and the PCCS2 is extremely small. By cross-matching the PHz with the PCCS2 catalogues at 353, 545, and 857 GHz, we found only 29 distinct associations. Of these, 21 meet our selection criteria, including 8 confirmed (7 sources) or very likely (1 source) strongly lensed galaxies. The fraction of strongly lensed galaxies of the PHz sources that are included in the PCCS2 is thus far larger than in the general PHz catalogue. Taking the strong incompleteness of the sample of confirmed strongly lensed galaxies into account, they may well be the majority in the PCCS2 sub-sample of the PHz, and even more after our selection. Nevertheless, our cross-matches with the SPT and H-ATLAS catalogues have highlighted that some of our high-z candidates may be resolved by the SPT or by Herschel and may therefore be proto-clusters that are not included in the PHz catalogue.
Another population that can meet our selection criteria because of their red sub-mm colours, similar to those of high-z sources, are Galactic cold clumps (Planck Collaboration XXVIII 2016). Most of them are found close to the Galactic plane, but some were detected at high Galactic latitude as well. We found 99 matches within 3 arcmin between the GCC catalogue and the PCCS2. Thirty-four of them, including 8 confirmed strongly lensed galaxies, meet our selection criteria. The substantial fraction of strongly lensed galaxies obviously implies that the presence in the GCC catalogue cannot be a valid criterion for excluding sources from our lists. On the other hand, these objects are of great interest per se because they provide key information on the early phases of star formation (Planck Collaboration XXVIII 2016).
Most published model predictions at sub-mm wavelengths (Perrotta et al. 2002, 2003; Negrello et al. 2007, 2017; Béthermin et al. 2011; Cai et al. 2013) refer to galaxy-galaxy lensing. In this case, a maximum magnification μmax ≃ 15 is indicated by the data (see Fig. 7 of Negrello et al. 2017). The extreme magnifications of Planck strongly lensed galaxies can be understood in terms of lensing by galaxy groups or clusters (Frye et al. 2019), however.
Figure 6 shows our estimate of the integral number counts of strongly lensed galaxies detected by Planck, compared to observed and predicted counts of galaxy-galaxy lensed galaxies at 500 μm (600 GHz). This estimate was obtained as follows. The 90% completeness flux density limit at our reference frequency of 545 GHz is S545, lim ≃ 500 mJy (Planck Collaboration XXVI 2016; Maddox et al. 2018). We can identify Planck-detected strongly lensed galaxies with good completeness and reliability only in areas that rare covered by deeper, higher angular resolution surveys, that is, over the 3100 deg2 surveyed by the SPT plus H-ATLAS. We have 11 such sources in this area, 7 of which have a flux density above S545, lim. For a typical redshift z ≃ 2, the proto-spheroidal SED by Cai et al. (2013) yields S500 μm/S545 GHz = 1.2. After correcting for the 10% incompleteness, we find N(> 500 mJy) = 2.5(+1.3, −0.8) × 10−3 deg−2 at 500 μm, with Poisson errors computed following Gehrels (1986).
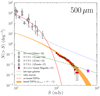 |
Fig. 6. Contributions of different source populations, specified in the legend, to the integral number counts at 500 μm (600 GHz), compared with observational data. The counts of late-type, normal, and starburst galaxies and of unlensed dusty star-forming galaxies (DSFGs), interpreted as proto-spheroidal galaxies in the process of forming the bulk of their stars, are from the Cai et al. (2013) model. The orange band shows the counts of strongly lensed (magnification μ > 2) DSFGs recomputed by Negrello et al. (2017) for magnification cut-offs, μmax, in the range 10−15. The calculations were made exploiting the Cai et al. (2013) model coupled with the Lapi et al. (2012) formalism to include galaxy-galaxy lensing. The counts of radio sources (dot-dashed green line) are from the Tucci et al. (2011) model. The data points are from Glenn et al. (2010), Chen et al. (2013), Casey et al. (2013), and Zavala et al. (2017). The purple star in the bottom right corner shows our estimate of the counts of Planck-detected strongly lensed galaxies. As expected, these counts exceed predictions for galaxy-galaxy lensing, consistent with being mostly contributed by galaxy-cluster lensing. Adapted from Fig. 8 of Negrello et al. (2017). |
The figure shows that the counts of Planck strongly lensed galaxies indeed exceed the extrapolation of observed counts and model predictions, both referring to galaxy-galaxy lensing. The important role of galaxy-cluster lensing is supported by the results of our cross-match with cluster catalogues. We have found a total of 20 associations of our lensed candidate samples with the Planck SZ catalogue (Planck Collaboration XXVII 2016). This catalogue is not deep enough for a thorough search for associations, but it the best available option at the moment while we wait for the eROSITA cluster survey. Deeper catalogues cover a small fraction of the sky. The Planck SZ catalogue contains 1653 clusters spread over ≃34 500 deg2. Their mean surface density is thus of ≃0.048 clusters deg−2. The number of chance associations within the total searched area ≃π(5/60)2 × Ncand ≃ 8.2 deg2, Ncand = 377 being the sum of candidates in our 3 samples, is 0.39. The Poisson probability of having by chance 20 associations when the expected number is 0.39 is vanishingly small, confirming that our candidates have a strong excess of foreground clusters.
Unfortunately, calculations including magnifications by galaxy clusters (Lima et al. 2010; Er et al. 2013) use outdated models and do not extend their predictions to the flux densities of interest here. A proper comparison of our count estimate with model predictions is therefore precluded at this stage.
To summarize, some useful indications are provided for the expected number of Planck-detected strongly lensed galaxies by the cross-matches with the SPT and H-ATLAS surveys. The two surveys contain a total of 17−22 confirmed or very likely strongly lensed galaxies detected by Planck over an area of 3100 deg2. This corresponds to 149−192 such objects over the full area at |b|> 20° (≃2.71 × 10⁴ deg2).
We conclude that Planck-detected strongly lensed galaxies constitute a rich enough sample to provide a uniquely detailed view of the internal structure and kinematics of galaxies across the peak of the cosmic star formation through high-resolution spectrophotometric follow up. Moreover, this sample can be exploited to study the spatial distribution of dark and luminous mass in galaxies or galaxy clusters acting as lenses over a broader redshift range than is possible with optically selected strongly lensed galaxies.
Follow-up work on candidates has started. SCUBA-2 photometric observations at 850 μm (353 GHz) of a preliminary selection (proposal ID: M19BP010, P.I.: M. Negrello) have already been mentioned; four of the detected sources were observed spectroscopically with the Northern Extended Millimeter Array (NOEMA; Proposal ID: S20BQ, P.I.: M. Negrello). Other samples were observed with the Australia Telescope Compact Array (ATCA) at 5.5 and 94 GHz (project ID C3301, P.I.: M. Bonato, 95 h of observing time) and with the IRAM second-generation Neel-IRAM-KID-Array (NIKA 2) at 1 and 2 mm (project ID 212-19, P.I.: M. Bonato, 13.5 h of observing time). The analysis of these data is in progress.
At low Galactic latitudes the reliability of source detection cannot be accurately assessed because of the confusion from Galactic cirrus emission. Therefore the Planck Collaboration has adopted a set of Galactic masks, defined by Planck Collaboration XV (2014), to exclude regions to various levels of dust contamination. Our choice, |b|> 20°, roughly corresponds to the region outside the Planck G65 mask.
The Improved Reprocessing of the IRAS Survey (IRIS) maps are reprocessed IRAS maps generated by Miville-Deschênes & Lagache (2005).
The SNRR at a given frequency is defined by Planck Collaboration Int. LV (2020) as the source average brightness divided the background standard deviation brightness. The source detection significance is measured by SRCSIG.
Acknowledgments
We are grateful to the anonymous referee for useful comments. DH thanks the Spanish Ministerio de Ciencia, Innovación y Universidades for partial financial support under project PGC2018-101814-B-I00. MB acknowledges support from INAF under PRIN SKA/CTA FORECaST, from the Ministero degli Affari Esteri e della Cooperazione Internazionale – Direzione Generale per la Promozione del Sistema Paese Progetto di Grande Rilevanza ZA18GR02 and from the South African Department of Science and Technology’s National Research Foundation (DST-NRF Grant Number 113121). This research has made use of the Planck Legacy Archive (https://www.cosmos.esa.int/web/planck/pla), of the TOPCAT software (Taylor 2005), of the Aladin Sky Atlas developed at CDS, Strasbourg Observatory, France, and of the NASA/IPAC Extragalactic Database (NED). Planck is an ESA science mission with instruments and contributions directly funded by ESA Member States, NASA, and Canada. The NED is operated by the Jet Propulsion Laboratory, California Institute of Technology, under contract with the National Aeronautics and Space Administration.
References
- Abrahamyan, H. V., Mickaelian, A. M., & Knyazyan, A. V. 2015, Astron. Comput., 10, 99 [Google Scholar]
- Bakx, T. J. L. C., Eales, S., & Amvrosiadis, A. 2020, MNRAS, 493, 4276 [NASA ADS] [CrossRef] [Google Scholar]
- Béthermin, M., Dole, H., Lagache, G., Le Borgne, D., & Penin, A. 2011, A&A, 529, A4 [NASA ADS] [CrossRef] [EDP Sciences] [Google Scholar]
- Bleem, L. E., Stalder, B., de Haan, T., et al. 2015, ApJS, 216, 27 [NASA ADS] [CrossRef] [Google Scholar]
- Boch, T., & Fernique, P. 2014, in Astronomical Data Analysis Software and Systems XXIII, eds. N. Manset, & P. Forshay, ASP Conf. Ser., 485, 277 [NASA ADS] [Google Scholar]
- Bonnarel, F., Fernique, P., Bienaymé, O., et al. 2000, A&AS, 143, 33 [NASA ADS] [CrossRef] [EDP Sciences] [Google Scholar]
- Bourne, N., Dunne, L., Maddox, S. J., et al. 2016, MNRAS, 462, 1714 [NASA ADS] [CrossRef] [Google Scholar]
- Cañameras, R., Nesvadba, N. P. H., Guery, D., et al. 2015, A&A, 581, A105 [NASA ADS] [CrossRef] [EDP Sciences] [Google Scholar]
- Cañameras, R., Nesvadba, N. P. H., Kneissl, R., et al. 2017a, A&A, 600, L3 [NASA ADS] [CrossRef] [EDP Sciences] [Google Scholar]
- Cañameras, R., Nesvadba, N., Kneissl, R., et al. 2017b, A&A, 604, A117 [NASA ADS] [CrossRef] [EDP Sciences] [Google Scholar]
- Cañameras, R., Nesvadba, N. P. H., Limousin, M., et al. 2018a, A&A, 620, A60 [NASA ADS] [CrossRef] [EDP Sciences] [Google Scholar]
- Cañameras, R., Yang, C., Nesvadba, N. P. H., et al. 2018b, A&A, 620, A61 [NASA ADS] [CrossRef] [EDP Sciences] [Google Scholar]
- Cañameras, R., Nesvadba, N. P. H., Kneissl, R., et al. 2021, A&A, 645, A45 [EDP Sciences] [Google Scholar]
- Cai, Z.-Y., Lapi, A., Xia, J.-Q., et al. 2013, ApJ, 768, 21 [NASA ADS] [CrossRef] [Google Scholar]
- Cao, X., Li, R., Shu, Y., et al. 2020, MNRAS, 499, 3610 [NASA ADS] [CrossRef] [Google Scholar]
- Casey, C. M., Chen, C.-C., Cowie, L. L., et al. 2013, MNRAS, 436, 1919 [NASA ADS] [CrossRef] [Google Scholar]
- Chen, C.-C., Cowie, L. L., Barger, A. J., et al. 2013, ApJ, 776, 131 [Google Scholar]
- Dannerbauer, H., Harrington, K., Díaz-Sánchez, A., et al. 2019, AJ, 158, 34 [Google Scholar]
- Delabrouille, J., Betoule, M., Melin, J. B., et al. 2013, A&A, 553, A96 [NASA ADS] [CrossRef] [EDP Sciences] [Google Scholar]
- Díaz-Sánchez, A., Iglesias-Groth, S., Rebolo, R., & Dannerbauer, H. 2017, ApJ, 843, L22 [Google Scholar]
- Diehl, H. T., Buckley-Geer, E. J., Lindgren, K. A., et al. 2017, ApJS, 232, 15 [CrossRef] [Google Scholar]
- Eales, S., Dunne, L., Clements, D., et al. 2010, PASP, 122, 499 [NASA ADS] [CrossRef] [Google Scholar]
- Enia, A., Negrello, M., Gurwell, M., et al. 2018, MNRAS, 475, 3467 [NASA ADS] [CrossRef] [Google Scholar]
- Er, X., Li, G., Mao, S., & Cao, L. 2013, MNRAS, 430, 1423 [NASA ADS] [CrossRef] [Google Scholar]
- Everett, W. B., Zhang, L., Crawford, T. M., et al. 2020, ApJ, 900, 55 [CrossRef] [Google Scholar]
- Finoguenov, A., Rykoff, E., Clerc, N., et al. 2020, A&A, 638, A114 [CrossRef] [EDP Sciences] [Google Scholar]
- Frye, B. L., Pascale, M., Qin, Y., et al. 2019, ApJ, 871, 51 [NASA ADS] [CrossRef] [Google Scholar]
- Fu, H., Jullo, E., Cooray, A., et al. 2012, ApJ, 753, 134 [NASA ADS] [CrossRef] [Google Scholar]
- Fujimoto, S., Ouchi, M., Kohno, K., et al. 2018, ApJ, 861, 7 [Google Scholar]
- Fujimoto, S., Silverman, J. D., Bethermin, M., et al. 2020, ApJ, 900, 1 [CrossRef] [Google Scholar]
- Gehrels, N. 1986, ApJ, 303, 336 [NASA ADS] [CrossRef] [Google Scholar]
- Glenn, J., Conley, A., Béthermin, M., et al. 2010, MNRAS, 409, 109 [NASA ADS] [CrossRef] [Google Scholar]
- Gonzalez, A. H., Gettings, D. P., Brodwin, M., et al. 2019, ApJS, 240, 33 [NASA ADS] [CrossRef] [Google Scholar]
- González-Nuevo, J., Lapi, A., Fleuren, S., et al. 2012, ApJ, 749, 65 [NASA ADS] [CrossRef] [Google Scholar]
- González-Nuevo, J., Suárez Gómez, S. L., Bonavera, L., et al. 2019, A&A, 627, A31 [CrossRef] [EDP Sciences] [Google Scholar]
- Gruppioni, C., Pozzi, F., Rodighiero, G., et al. 2013, MNRAS, 432, 23 [NASA ADS] [CrossRef] [Google Scholar]
- Harrington, K. C., Yun, M. S., Cybulski, R., et al. 2016, MNRAS, 458, 4383 [NASA ADS] [CrossRef] [Google Scholar]
- Harrington, K. C., Yun, M. S., Magnelli, B., et al. 2018, MNRAS, 474, 3866 [NASA ADS] [CrossRef] [Google Scholar]
- Harrington, K. C., Vishwas, A., Weiß, A., et al. 2019, MNRAS, 488, 1489 [NASA ADS] [CrossRef] [Google Scholar]
- Harrington, K. C., Weiss, A., Yun, M. S., et al. 2021, ApJ, 908, 95 [NASA ADS] [CrossRef] [Google Scholar]
- Herranz, D., González-Nuevo, J., Clements, D. L., et al. 2013, A&A, 549, A31 [NASA ADS] [CrossRef] [EDP Sciences] [Google Scholar]
- Hezaveh, Y. D., & Holder, G. P. 2011, ApJ, 734, 52 [NASA ADS] [CrossRef] [Google Scholar]
- Hilbert, S., White, S. D. M., Hartlap, J., & Schneider, P. 2008, MNRAS, 386, 1845 [NASA ADS] [CrossRef] [Google Scholar]
- Hilton, M., Sifón, C., Naess, S., et al. 2021, ApJS, 253, 3 [Google Scholar]
- Hodge, J. A., Swinbank, A. M., Simpson, J. M., et al. 2016, ApJ, 833, 103 [Google Scholar]
- Ikarashi, S., Caputi, K. I., Ohta, K., et al. 2017, ApJ, 849, L36 [NASA ADS] [CrossRef] [Google Scholar]
- Jarrett, T. H., Cluver, M. E., Magoulas, C., et al. 2017, ApJ, 836, 182 [Google Scholar]
- Jones, G. C., Maiolino, R., Caselli, P., & Carniani, S. 2019, A&A, 632, L7 [NASA ADS] [CrossRef] [EDP Sciences] [Google Scholar]
- King, A., & Pounds, K. 2015, ARA&A, 53, 115 [NASA ADS] [CrossRef] [Google Scholar]
- Lagache, G., Puget, J.-L., & Dole, H. 2005, ARA&A, 43, 727 [NASA ADS] [CrossRef] [Google Scholar]
- Lapi, A., Negrello, M., González-Nuevo, J., et al. 2012, ApJ, 755, 46 [NASA ADS] [CrossRef] [Google Scholar]
- Lima, M., Jain, B., Devlin, M., & Aguirre, J. 2010, ApJ, 717, L31 [NASA ADS] [CrossRef] [Google Scholar]
- Maddox, S. J., Valiante, E., Cigan, P., et al. 2018, ApJS, 236, 30 [NASA ADS] [CrossRef] [Google Scholar]
- Merloni, A., Predehl, P., Becker, W., et al. 2012, ArXiv e-prints [arXiv:1209.3114] [Google Scholar]
- Miville-Deschênes, M.-A., & Lagache, G. 2005, ApJS, 157, 302 [Google Scholar]
- Mocanu, L. M., Crawford, T. M., Vieira, J. D., et al. 2013, ApJ, 779, 61 [NASA ADS] [CrossRef] [Google Scholar]
- Nayyeri, H., Keele, M., Cooray, A., et al. 2016, ApJ, 823, 17 [NASA ADS] [CrossRef] [Google Scholar]
- Negrello, M., Perrotta, F., González-Nuevo, J., et al. 2007, MNRAS, 377, 1557 [NASA ADS] [CrossRef] [Google Scholar]
- Negrello, M., Hopwood, R., De Zotti, G., et al. 2010, Science, 330, 800 [NASA ADS] [CrossRef] [Google Scholar]
- Negrello, M., Clemens, M., Gonzalez-Nuevo, J., et al. 2013, MNRAS, 429, 1309 [Google Scholar]
- Negrello, M., Amber, S., Amvrosiadis, A., et al. 2017, MNRAS, 465, 3558 [NASA ADS] [CrossRef] [Google Scholar]
- Nesvadba, N., Kneissl, R., Cañameras, R., et al. 2016, A&A, 593, L2 [NASA ADS] [CrossRef] [EDP Sciences] [Google Scholar]
- Nesvadba, N. P. H., Cañameras, R., Kneissl, R., et al. 2019, A&A, 624, A23 [NASA ADS] [CrossRef] [EDP Sciences] [Google Scholar]
- Oliver, S. J., Bock, J., Altieri, B., et al. 2012, MNRAS, 424, 1614 [NASA ADS] [CrossRef] [EDP Sciences] [Google Scholar]
- Perrotta, F., Baccigalupi, C., Bartelmann, M., De Zotti, G., & Granato, G. L. 2002, MNRAS, 329, 445 [NASA ADS] [CrossRef] [Google Scholar]
- Perrotta, F., Magliocchetti, M., Baccigalupi, C., et al. 2003, MNRAS, 338, 623 [NASA ADS] [CrossRef] [Google Scholar]
- Piffaretti, R., Arnaud, M., Pratt, G. W., Pointecouteau, E., & Melin, J. B. 2011, A&A, 534, A109 [NASA ADS] [CrossRef] [EDP Sciences] [Google Scholar]
- Planck Collaboration VII. 2011, A&A, 536, A7 [NASA ADS] [CrossRef] [EDP Sciences] [Google Scholar]
- Planck Collaboration XV. 2014, A&A, 571, A15 [NASA ADS] [CrossRef] [EDP Sciences] [Google Scholar]
- Planck Collaboration I. 2016, A&A, 594, A1 [NASA ADS] [CrossRef] [EDP Sciences] [Google Scholar]
- Planck Collaboration XXVI. 2016, A&A, 594, A26 [NASA ADS] [CrossRef] [EDP Sciences] [Google Scholar]
- Planck Collaboration XXVII. 2016, A&A, 594, A27 [NASA ADS] [CrossRef] [EDP Sciences] [Google Scholar]
- Planck Collaboration XXVIII. 2016, A&A, 594, A28 [NASA ADS] [CrossRef] [EDP Sciences] [Google Scholar]
- Planck Collaboration I. 2020, A&A, 641, A1 [CrossRef] [EDP Sciences] [Google Scholar]
- Planck Collaboration Int. VII. 2013, A&A, 550, A133 [NASA ADS] [CrossRef] [EDP Sciences] [Google Scholar]
- Planck Collaboration Int. XXVII. 2015, A&A, 582, A30 [NASA ADS] [CrossRef] [EDP Sciences] [Google Scholar]
- Planck Collaboration Int. XXXIX. 2016, A&A, 596, A100 [NASA ADS] [CrossRef] [EDP Sciences] [Google Scholar]
- Planck Collaboration Int. LIV. 2018, A&A, 619, A94 [NASA ADS] [CrossRef] [EDP Sciences] [Google Scholar]
- Planck Collaboration Int. LV. 2020, A&A, 644, A99 [NASA ADS] [CrossRef] [EDP Sciences] [Google Scholar]
- Reuter, C., Vieira, J. D., Spilker, J. S., et al. 2020, ApJ, 902, 78 [NASA ADS] [CrossRef] [Google Scholar]
- Robertson, A., Smith, G. P., Massey, R., et al. 2020, MNRAS, 495, 3727 [CrossRef] [Google Scholar]
- Rowan-Robinson, M., Wang, L., Farrah, D., et al. 2018, A&A, 619, A169 [NASA ADS] [CrossRef] [EDP Sciences] [Google Scholar]
- Shibuya, T., Ouchi, M., & Harikane, Y. 2015, ApJS, 219, 15 [NASA ADS] [CrossRef] [Google Scholar]
- Shibuya, T., Ouchi, M., Harikane, Y., & Nakajima, K. 2019, ApJ, 871, 164 [NASA ADS] [CrossRef] [Google Scholar]
- Shu, Y., Bolton, A. S., Kochanek, C. S., et al. 2016, ApJ, 824, 86 [NASA ADS] [CrossRef] [Google Scholar]
- Silk, J., & Mamon, G. A. 2012, Res. Astron. Astrophys., 12, 917 [NASA ADS] [CrossRef] [Google Scholar]
- Somerville, R. S., & Davé, R. 2015, ARA&A, 53, 51 [Google Scholar]
- Spilker, J. S., Marrone, D. P., Aravena, M., et al. 2016, ApJ, 826, 112 [NASA ADS] [CrossRef] [Google Scholar]
- Spilker, J. S., Aravena, M., Béthermin, M., et al. 2018, Science, 361, 1016 [NASA ADS] [CrossRef] [Google Scholar]
- Spilker, J. S., Phadke, K. A., Aravena, M., et al. 2020, ApJ, 905, 85 [Google Scholar]
- Sun, F., Egami, E., Rawle, T. D., et al. 2021, ApJ, 908, 192 [CrossRef] [Google Scholar]
- Swinbank, A. M., Smail, I., Longmore, S., et al. 2010, Nature, 464, 733 [Google Scholar]
- Talbot, M. S., Brownstein, J. R., Dawson, K. S., Kneib, J.-P., & Bautista, J. 2021, MNRAS, 502, 4617 [NASA ADS] [CrossRef] [Google Scholar]
- Taylor, M. B. 2005, in Astronomical Data Analysis Software and Systems XIV, eds. P. Shopbell, M. Britton, & R. Ebert, ASP Conf. Ser., 347, 29 [Google Scholar]
- Tucci, M., Toffolatti, L., de Zotti, G., & Martínez-González, E. 2011, A&A, 533, A57 [NASA ADS] [CrossRef] [EDP Sciences] [Google Scholar]
- Veilleux, S., Maiolino, R., Bolatto, A. D., & Aalto, S. 2020, A&ARv, 28, 2 [NASA ADS] [CrossRef] [Google Scholar]
- Vieira, J. D., Crawford, T. M., Switzer, E. R., et al. 2010, ApJ, 719, 763 [NASA ADS] [CrossRef] [Google Scholar]
- Viero, M. P., Asboth, V., Roseboom, I. G., et al. 2014, ApJS, 210, 22 [Google Scholar]
- Wardlow, J. L., Cooray, A., De Bernardis, F., et al. 2013, ApJ, 762, 59 [NASA ADS] [CrossRef] [Google Scholar]
- Weiß, A., De Breuck, C., Marrone, D. P., et al. 2013, ApJ, 767, 88 [NASA ADS] [CrossRef] [Google Scholar]
- Zavala, J. A., Aretxaga, I., Geach, J. E., et al. 2017, MNRAS, 464, 3369 [NASA ADS] [CrossRef] [Google Scholar]
Appendix A: Candidate strongly lensed galaxies selected at 545, 857, and 353 GHz
MTXF photometry of candidate strongly lensed galaxies selected at 545 GHz.
BeeP photometry of candidate strongly lensed galaxies selected at 857 GHz.
MTXF photometry of candidate strongly lensed galaxies selected at 353 GHz. Units and notes as in Table A.1.
All Tables
MTXF photometry of candidate strongly lensed galaxies selected at 353 GHz. Units and notes as in Table A.1.
All Figures
|
Fig. 1. Redshift distributions of the background-lensed galaxies (solid blue histograms) and of the foreground lenses (dashed red histograms) detected by Planck compared with those of the 187 strong gravitational lens candidates in the BELLS GALLERY survey parent sample (Shu et al. 2016). |
| In the text | |
|
Fig. 2. Redshift distribution of Planck Early Release Compact Source Catalogue (ERCSC; Planck Collaboration VII 2011) galaxies detected at 545 GHz (Negrello et al. 2013, no more recent redshift distribution for a complete sample of Planck dusty galaxies is available). They are all local (z < 0.1). At fainter flux densities, strongly lensed galaxies at much higher redshifts (z ≳ 1) begin to appear, with nothing in between. The redshift distribution of known strongly lensed galaxies detected by Planck (Table 1) is shown here. The broad gap between the two populations persists at least down to a flux density of 100 mJy at 600 GHz (Negrello et al. 2017). |
| In the text | |
|
Fig. 3. Distribution in the S857/S545 vs S545/S353 colour–colour plot of Planck-detected galaxies with S545 ≥ 500 mJy. For this diagram we used the multi-band BeeP photometry (Planck Collaboration Int. LV 2020). Radio sources were removed by cross-matching the sample with the PCNT catalogue (Planck Collaboration Int. LIV 2018). The ten confirmed strongly lensed galaxies in this sample (filled blue circles) have colours at the red end of the distribution of the other galaxies (filled red squares). Still redder objects are likely GCC (see text). |
| In the text | |
|
Fig. 4. Distributions of sub-mm colours S857/S545 and S545/S353 of the 47 confirmed plus very likely Planck-detected strongly lensed galaxies (solid blue histograms). The dashed red histograms show the distributions of the 27 confirmed strongly lensed galaxies only. |
| In the text | |
|
Fig. 5. Flowchart summarizing our procedure to select candidate strongly lensed galaxies. |
| In the text | |
|
Fig. 6. Contributions of different source populations, specified in the legend, to the integral number counts at 500 μm (600 GHz), compared with observational data. The counts of late-type, normal, and starburst galaxies and of unlensed dusty star-forming galaxies (DSFGs), interpreted as proto-spheroidal galaxies in the process of forming the bulk of their stars, are from the Cai et al. (2013) model. The orange band shows the counts of strongly lensed (magnification μ > 2) DSFGs recomputed by Negrello et al. (2017) for magnification cut-offs, μmax, in the range 10−15. The calculations were made exploiting the Cai et al. (2013) model coupled with the Lapi et al. (2012) formalism to include galaxy-galaxy lensing. The counts of radio sources (dot-dashed green line) are from the Tucci et al. (2011) model. The data points are from Glenn et al. (2010), Chen et al. (2013), Casey et al. (2013), and Zavala et al. (2017). The purple star in the bottom right corner shows our estimate of the counts of Planck-detected strongly lensed galaxies. As expected, these counts exceed predictions for galaxy-galaxy lensing, consistent with being mostly contributed by galaxy-cluster lensing. Adapted from Fig. 8 of Negrello et al. (2017). |
| In the text | |
Current usage metrics show cumulative count of Article Views (full-text article views including HTML views, PDF and ePub downloads, according to the available data) and Abstracts Views on Vision4Press platform.
Data correspond to usage on the plateform after 2015. The current usage metrics is available 48-96 hours after online publication and is updated daily on week days.
Initial download of the metrics may take a while.