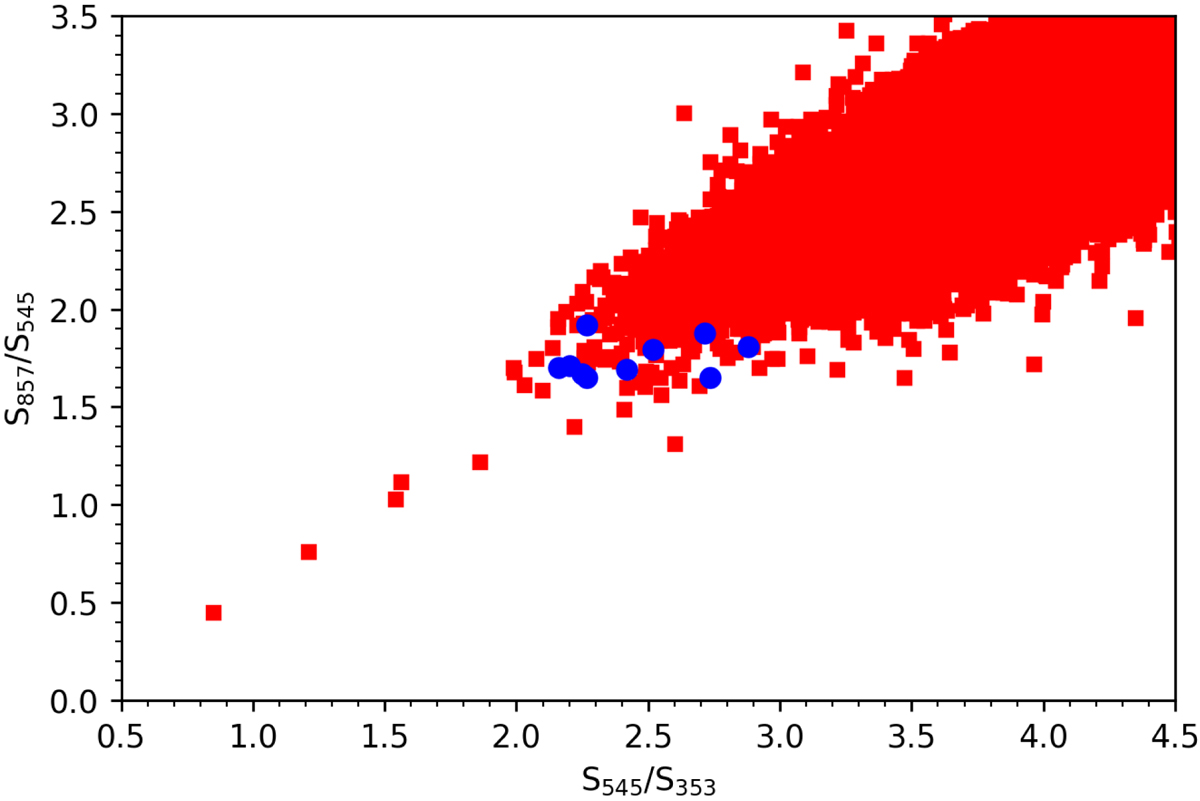
Fig. 3.
Download original image
Distribution in the S857/S545 vs S545/S353 colour–colour plot of Planck-detected galaxies with S545 ≥ 500 mJy. For this diagram we used the multi-band BeeP photometry (Planck Collaboration Int. LV 2020). Radio sources were removed by cross-matching the sample with the PCNT catalogue (Planck Collaboration Int. LIV 2018). The ten confirmed strongly lensed galaxies in this sample (filled blue circles) have colours at the red end of the distribution of the other galaxies (filled red squares). Still redder objects are likely GCC (see text).
Current usage metrics show cumulative count of Article Views (full-text article views including HTML views, PDF and ePub downloads, according to the available data) and Abstracts Views on Vision4Press platform.
Data correspond to usage on the plateform after 2015. The current usage metrics is available 48-96 hours after online publication and is updated daily on week days.
Initial download of the metrics may take a while.