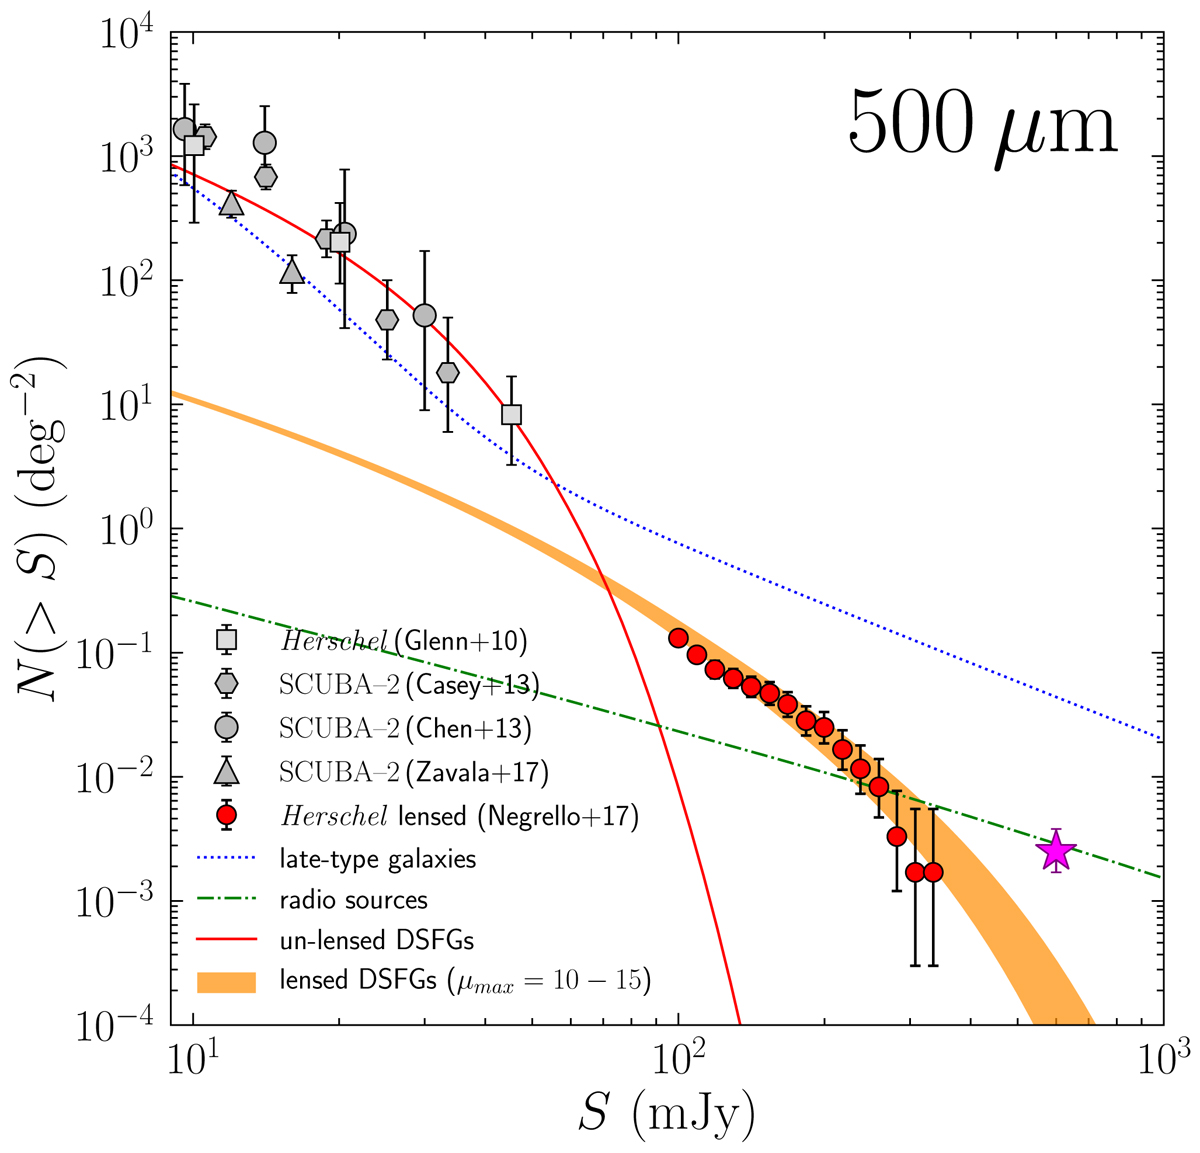
Fig. 6.
Download original image
Contributions of different source populations, specified in the legend, to the integral number counts at 500 μm (600 GHz), compared with observational data. The counts of late-type, normal, and starburst galaxies and of unlensed dusty star-forming galaxies (DSFGs), interpreted as proto-spheroidal galaxies in the process of forming the bulk of their stars, are from the Cai et al. (2013) model. The orange band shows the counts of strongly lensed (magnification μ > 2) DSFGs recomputed by Negrello et al. (2017) for magnification cut-offs, μmax, in the range 10−15. The calculations were made exploiting the Cai et al. (2013) model coupled with the Lapi et al. (2012) formalism to include galaxy-galaxy lensing. The counts of radio sources (dot-dashed green line) are from the Tucci et al. (2011) model. The data points are from Glenn et al. (2010), Chen et al. (2013), Casey et al. (2013), and Zavala et al. (2017). The purple star in the bottom right corner shows our estimate of the counts of Planck-detected strongly lensed galaxies. As expected, these counts exceed predictions for galaxy-galaxy lensing, consistent with being mostly contributed by galaxy-cluster lensing. Adapted from Fig. 8 of Negrello et al. (2017).
Current usage metrics show cumulative count of Article Views (full-text article views including HTML views, PDF and ePub downloads, according to the available data) and Abstracts Views on Vision4Press platform.
Data correspond to usage on the plateform after 2015. The current usage metrics is available 48-96 hours after online publication and is updated daily on week days.
Initial download of the metrics may take a while.