| Issue |
A&A
Volume 597, January 2017
|
|
|---|---|---|
| Article Number | A32 | |
| Number of page(s) | 19 | |
| Section | Interstellar and circumstellar matter | |
| DOI | https://doi.org/10.1051/0004-6361/201629523 | |
| Published online | 19 December 2016 | |
Cavity and other radial substructures in the disk around HD 97048
1 Departamento de AstronomiaUniversidad
de Chile, Casilla
36-D Santiago, Chile
e-mail: info@gerritvanderplas.com
2 Millenium Nucleus Protoplanetary
Disks in ALMA Early Science, Universidad de Chile, Casilla 36-D, Santiago, Chile
3 School of Physical,
Environmental and Mathematical Sciences,
UNSW@ADFA, Canberra, ACT
2600,
Australia
4 CNRS, IPAG, 38000
Grenoble,
France
5 Univ. Grenoble Alpes,
IPAG, 38000
Grenoble,
France
6 Departamento de Física Teórica,
Universidad Autónoma de Madrid, Cantoblanco, 28049
Madrid,
Spain
7 Centre for Astrophysics &
Supercomputing, Swinburne University, PO Box 218, Hawthorn, VIC
3122,
Australia
8 ASML, De Run 6501,
5504 DR
Veldhoven, The
Netherlands
9 Nucleo de Astronomia, Facultad de
Ingenieria, Universidad Diego Portales, Av. Ejercito 441, Santiago, Chile
10 NRAO, 520 Edgemont
Rd, Charlottesville,
VA
22903-2475,
USA
Received:
12
August
2016
Accepted:
3
September
2016
Context. Gaps, cavities, and rings in circumstellar disks are signposts of disk evolution and planet-disk interactions. We follow the recent suggestion that Herbig Ae/Be disks with a flared disk harbor a cavity, and investigate the disk around HD 97048.
Aims. We aim to resolve the 34 ± 4 AU central cavity that has been predicted and to investigate the structure of the disk.
Methods. We imaged the disk around HD 97048 using ALMA at 0.85 mm and 2.94 mm and ATCA (multiple frequency) observations. Our observations also include the 12CO J = 1−0, 12CO J = 3−2 and HCO+ J = 4−3 emission lines.
Results. A central cavity in the disk around HD 97048 is resolved with a 40−46 AU radius. Additional radial structure present in the surface brightness profile can be accounted for either by an opacity gap at 90 AU or by an additional emitting ring at 150 AU. The continuum emission tracing the dust in the disk is detected out to 355 AU. The 12CO J = 3−2 disk is detected 2.4 times farther out. The 12CO emission can be traced down to ≈10 AU scales. Apparent non-Keplerian kinematics are detected inside the cavity on the HCO+ J = 4−3 velocity map. The mm spectral index measured from ATCA observations suggests that grain growth has occurred in the HD 97048 disk. Finally, we resolve a highly inclined disk out to 150 AU around the nearby 0.5 M⊙ binary ISO-ChaI 126.
Conclusions. The data presented here reveal a cavity in the disk of HD 97048, and prominent radial structure in the surface brightness. The cavity size varies for different continuum frequencies and gas tracers. The gas inside the cavity follows non-Keplerian kinematics seen in HCO+ emission. The variable cavity size along with the kinematical signature suggests the presence of a substellar companion or a massive planet inside the cavity.
Key words: protoplanetary disks / stars: variables: T Tauri, Herbig Ae/Be / stars: individual: HD 97048
© ESO, 2016
1. Introduction
Protoplanetary disks are the birth environments of planetary systems. How these planets form in their disks is an ongoing topic of debate, which is informed by an increasing number of disks that show various degrees of dispersal such as opacity cavities (transitional disks) and opacity gaps (pre-transitional disks) (e.g., Williams & Cieza 2011). Examples of such disks with directly imaged cavities at (sub) mm wavelengths include HD 100546 (Walsh et al. 2014), Sz 91 (Canovas et al. 2015, 2016), LkCa 15 (Piétu et al. 2006; Andrews et al. 2011), HD 142527 (Casassus et al. 2013), and SAO 206462 (Brown et al. 2009). The common denominator of these disks is that their structure can be described by one large cavity or a broad ring of dust grains at reasonably large radii and with large ring widths (at least tens of AU in radii and width) or with a pile-up of large dust grains in narrow rings. The gaps and/or cavities in these disks are not empty: they contain both smaller dust grains, as traced by scattered-light imaging (e.g., Kraus & Ireland 2012; Avenhaus et al. 2014), and gas, as traced by rotational (Perez et al. 2015; van der Marel et al. 2015) and ro-vibrational carbon monoxide (CO) lines (van der Plas et al. 2009; Pontoppidan et al. 2011). Recently, long-baseline Atacama Large Millimeter Array (ALMA) observations of HL Tau (ALMA Partnership et al. 2015) and TW Hya (Andrews et al. 2016; Nomura et al. 2016; Tsukagoshi et al. 2016) have demonstrated that these disks show a rich substructure of many concentric rings and gaps at scales as small as 1 AU when observed at very high spatial resolution. Indeed, it is possible that most disks contain similar detailed structures which have not yet observed (Zhang et al. 2016).
Disks around Herbig Ae/Be (HAeBe) stars have historically been split into group I and group II disks. Group I sources have been interpreted as hosting gas-rich protoplanetary disks with a flared, bright dust surface; whereas the dust in group II disks is assumed to have settled toward the mid-plane and they are therefore weak in mid- to far-infrared emission (Meeus et al. 2001; Dullemond & Dominik 2004). Recent modeling of resolved observations of group I sources suggested that their bright infrared emission can be attributed to the large vertical walls that exists as a consequence of large dust cavities (Honda et al. 2012; Maaskant et al. 2013).
HD 97048 is a 3 Myr (Lagage et al. 2006), 2.5 M⊙ (Doucet et al. 2007) HAeBe with spectral type A0 at a distance of 158 parsec (van Leeuwen 2007). Its spectral energy distribution (SED) is classified as group I, is bright in the mid- to far-IR, and rich in polycyclic aromatic hydrocarbon (PAH) features, but lacks any sign of amorphous and crystalline silicate features (Maaskant et al. 2014). The mass accretion rate onto the star is low with an upper limit of log (Macc) ≤ −8.16 M⊙ yr-1 (Fairlamb et al. 2015).
Observational details for the ALMA and ATCA observations.
Continuum fluxes, major axis, axis ratio and position angle derived from fitting a disk (D, for the ALMA data) or a Gaussian or point source (G or P, for the ATCA data) to the visibilities.
The disk around HD 97048 is exceptionally bright and is one of only two HAeBe disks in which near-IR 1−0 S(1) (Carmona et al. 2011) and mid-IR (Martin-Zaïdi et al. 2009) H2 emission has been detected. The outer disk has been resolved in the PAH bands and shows a typical flaring geometry, with a flaring index of 1.26 ± 0.05 (Lagage et al. 2006), and an inclined disk geometry with the eastern side farther from us. The disk has been very well studied using CO emission, and shows an 11 AU cavity in ro-vibrational emission (van der Plas et al. 2009), but no detection in overtone emission (van der Plas et al. 2015). The rotational CO ladder is richly populated as detected by Herschel (Meeus et al. 2013; van der Wiel et al. 2014; Fedele et al. 2016). In the (sub) mm bands, this disk has only been detected using single-dish observations and has never been resolved (Henning et al. 1998; Phillips 2011; Hales et al. 2014). The disk has been resolved by polarimetric differential imaging of polarized scattered light (Quanz et al. 2012), however, showing a bright disk surface between ≈0.1′′−1.0′′(≈16–160 AU), but no evidence of a disk cavity. Maaskant et al. (2013) also resolved the disk in the Q band (20 μm) spectrum and found that a large gap is probably located between 2 and 34 AU in the disk.
In this manuscript we present resolved (sub) mm observations of the disk around HD 97048 obtained with ALMA and the Australia Telescope Compact Array (ATCA)1. We describe the observations and data reduction in Sect. 2, and present the results in Sect. 3. We discuss these results and set them in context with previous results in Sect. 4, and we present our conclusions in Sect. 5.
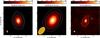 |
Fig. 1 Images of HD 97048 for the ALMA band 7 (left panel) and band 3 (central panel) and the combined ATCA 33+35 GHz (right panel) observations, reconstructed using uniform (ALMA) and natural (ATCA) weighting. The intensity scale for all images is in units of Jy/beam. Overplotted in each panel are contours with 3, 15, 100, and 1100 times the rms value of 0.20, 0.18 and 0.010 mJy beam-1, respectively. The beam is shown in orange in the bottom left corner of each panel. |
2. Observations and data reduction
2.1. ATCA data
High spatial resolution 7–9 mm imaging observations of HD 97048 were conducted on 30 and 31 August 2014 under project C1794. Full synthesis tracks were performed in the 6B east-west configuration, with baselines ranging between 214.3 m to 5969.4 m. During the observations the weather conditions were good on 30 August, with the rms path length error (or seeing) ≤300 μm, and fair during 31 August, with the seeing generally below 300 μm for much of the track, but spiking to 600 μm for several hours in the middle of the track. For the 30 August 2014 track, the two sidebands of the 7 mm receiver were centered on 33 and 35 GHz, and on 38 and 40 GHz on 31 August.
In addition to the above imaging-oriented observations, multiple ATCA 3 mm, 7 mm, 9 mm, 1.7 cm, 3.3 cm, and 5.45 cm observations were conducted between 14 October 2004 and 28 July 2013. All these were either only partial tracks in an E-W configuration, sometimes as fillers, under projects C996, C1173, and C2094, or relatively short observations in a compact hybrid configuration under the same project codes, plus C2534 and C2426. They provide reasonable flux estimates but low-fidelity images because of their poor uv coverage. This itself is a product of shorter integration times (and hence extended beams in the E-W arrays) and due to HD 97048 being observed on several occasions at elevations down to ≤20°, where the efficiency is poor.
For the 3 mm observations of October 2004, the old ATCA correlator was used and set to continuum mode, each bandwidth being 128 MHz wide with 32 channels. From August 2009 onward, all the observations used the Compact Array Broadband Backend, or CABB (Wilson et al. 2011), which provides a bandwidth of 2 GHz with 2048 × 1 MHz channels per sideband.
The bandpass and flux calibrators were observed for ~15 min each, and the phase calibrator was observed every 5–10 min for a duration of 1–2 min depending on the atmospheric conditions. Pointing checks were also made on the phase calibrator every ~60−90 min. We estimate the absolute flux calibration to be accurate within ~20%. All ATCA observational and calibration details are summarized in Table 1.
The data were calibrated using the MIRIAD package (Sault et al. 1995). We imaged the data observed at 30 August 2014 at 33/35 GHz with the CLEAN task in MIRIAD using natural weighting, which resulted in a restored beam of 0.43″ × 0.41″ at PA = 72°. The size and flux of HD 97048 for this dataset were determined using the MIRIAD task uvfit to fit a Gaussian to the visibility data. The relatively poor seeing during the 31 August 2014 synthesis track, coupled with the higher frequency setting, meant that the quality of the phase correction was significantly poorer than on the previous day. Phase decorrelation could be seen in the visibilities, and consequent probable phase errors such as radial extensions in the reconstructed images. We therefore do not present the image here, but only the flux determined during the period of best seeing.
We extracted the fluxes from these observations using various methods, including standard model fitting (point, Gaussian or point+Gaussian) with MIRIAD’s uvfit task. However, since uvfit does not produce a convenient goodness-of-fit criterion, we also used the Miriad task uvaver to average all 2048 channels, and then output the resulting uv dataset as a FITS file using the fits task. This was subsequently treated in IDL, where the channel-averaged and binned visibilities were fitted with a point, Gaussian or point+Gaussian model. The model was then extrapolated to zero spacing (i.e., 0 kλ) to provide a predicted total flux. A note is warranted concerning the 5.5 and 9 GHz data, and especially the latter, which was affected by radio frequency interference and other noise that appeared electronic in origin, revealed as an RFI-like (but lower level) pattern on every fourth channel (i.e., a 4 MHz period) across particular ranges. All affected channels were removed.
All the fluxes and, where relevant, the source sizes, are summarized in Table 2, where multiple observations at particular frequencies have been averaged to provide a mean and standard deviation. Pre-empting the discussion to follow, it was found that the 33/35, 38/40 and 43/45 GHz data were well fit with a model comprising an unresolved (point) source and a Gaussian, centered on the same position. The fluxes listed in Table 2 are the total integrated fluxes.
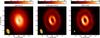 |
Fig. 2 Reconstructed images of HD 97048 for the ALMA band 7 data. The intensity scale for all images is in units of Jy beam-1. To highlight the small-scale structure we show (from left to right) images reconstructed with progressively smaller beams. Left panel: image reconstructed using superuniform weighting. Central panel: superuniformly weighted reconstructed image resulting from clipping all baselines below 160 kλ. Finally, right panel: MEM model image. The difference in dynamic range between the panels is due to flux loss incurred by clipping the shortest baselines for the central panel, and due to the smaller reconstructed beam for the right panel. |
2.2. ALMA cycle 2 band 7 data
ALMA Early Science Cycle 2 observations were conducted on 22 May 2015 with 430 s of total time on HD 97048 (PI: G van der Plas, Program ID 2013.1.00658.S). The array configuration provided baselines ranging between 21.4 and 555.5 m. During the observations the perceptible water vapor in the atmosphere varied between 0.62 and 0.82 mm with a median value at zenith of 0.687 mm. Two of the four spectral windows of the ALMA correlator were configured in time division mode (TDM) to maximize the sensitivity for continuum observations (128 channels over 1.875 GHz usable bandwidth). These two TDM spectral windows were centered st 345.8 GHz and 356.7 GHz. The other two spectral window were configured in frequency division mode (FDM) to target the 12CO J = 3−2 and the HCO+ J = 4−3 lines with a spectral resolution of 105 and 103 m s-1, respectively, using 0.23 GHz of total bandwidth. The data were calibrated using the Common Astronomy Software Applications pipeline (CASA, McMullin et al. 2007, version 4.3), after which some additional flagging was performed. Details of the observations and calibration are summarized in Table 1. We estimate the absolute flux calibration to be accurate within ~10%.
We used the standard reduction tools within the CASA package to calibrate and combine the data. We extracted the size and flux of HD 97048 by using the CASA task uvmodelfit to fit a disk to the visibility data, while we imaged the disks with the CLEAN task in CASA (Högbom 1974) using Briggs (robust = 0.5), uniform and superuniform weighting, which resulted in a restoring beam of 0.63′′× 0.36′′at PA = 19°(Briggs), 0.60′′× 0.32′′at PA = 20°(uniform) and 0.53′′× 0.31′′at PA = 19°(superuniform). The resulting images are strongly limited dynamically by the bright continuum source, and we performed self-calibration on the phase and amplitude, which resulted in a final dynamical range of ≈1200 and a rms of 0.20 mJy beam-1. We shifted all images using the proper motion correction described in van Leeuwen (2007), and these are shown in Figs. 1 and 2 for the continuum emission. We applied the self-calibration solutions obtained from the continuum emission to the HCO+ J = 4−3 and 12CO J = 3−2 data and subtracted the continuum emission using the CASA task uvcontsub, resulting in a per-channel rms of 19.5 and 23.7 mJy beam-1 respectively. The resulting moment 0, 1, and 8 maps and spectra are shown in Figs. 3 and 4 for the 12CO J = 3−2 and HCO+ J = 4−3 data.
2.2.1. Imaging the long baselines
We also reconstructed the images using only baselines above 160 kλ to enhance the contrast of faint small-scale structure in the disk. These data were cleaned using superuniform weighting, resulting in a beam of 0.48′′× 0.26′′at PA = 18°. The reconstructed image is shown in the central panel of Fig. 2.
2.2.2. MEM image reconstruction
A non-parametric least-squared modeling technique for image reconstruction was performed on the band 7 data. This maximum entropy method (MEM) yields an image with a smaller beam and traces finer spatial scales than the previously described CLEANed reconstruction. Examples of usage of MEM for image synthesis in astronomy can be found in Gull & Daniell (1978) and Marino et al. (2015), for instance. Images deconvoled with MEM super-resolve the interferometric data, because the entropy prior allows an extrapolation of spatial frequencies beyond those sampled by the interferometer. We used the uvmem algorithm (Casassus et al. 2006, 2015a,b) and label the resulting model MEM model in the right panel of Fig. 2. The spatial resolution reached in this reconstruction is about one-third of the clean beam calculated with uniform weights.
2.3. ALMA Cycle 1 band 3 data
ALMA Early Science Cycle 1 observations were conducted on 1 December 2013 with 72.6 seconds of total time on HD 97048 (program ID 2012.1.00031.S, see also Dunham et al. 2016). The array configuration provided baselines ranging between 15.8 and 462.9 m. During the observations the perceptible water vapor in the atmosphere was stable within 5% of the median value of 0.535 mm. Three of the four spectral windows of the ALMA correlator were configured in TDM to maximise the sensitivity for continuum observations (128 channels over 1.875 GHz usable bandwidth). These spectral windows were centered on 101.9 GHz, 103.9 GHz, and 113.1 GHz. The fourth spectral window was configured in FDM to target the 12CO J = 1−0 line and centered on 105.2 GHz, with a spectral resolution of 159 m s-1 and a total bandwidth of 0.117 GHz. The data were calibrated using the provided data reduction script and CASA version 4.3. Upon inspecting the visibilities, the amplitudes of the spectral window centered on 113.1 GHz showed anomalous behavior, and we decided to flag the entire spectral window. We therefore only use the first two spectral windows for the dust continuum analysis and estimate the absolute flux calibration to be accurate within ~10%. Details of the observations and calibration are summarized in Table 1.
We used the same data reduction process using CASA as for the band 7 data. After CLEANing the data using uniform weighting, we obtained a restoring beam of 2.36′′× 1.40′′ at PA = −39°. Self-calibration on the phases and amplitude resulted in a continuum rms of 0.18 mJy beam-1. The continuum emission is shown in the central panel of Fig. 1. Again we applied the self-calibration solutions obtained from the continuum emission to the 12CO data, and after subtracting the continuum, the line data were imaged using Briggs weighting (robust = 0.5). This resulted in a restoring beam of 2.21′′× 1.43′′ at PA = −38° and a rms of 77.5 mJy beam-1. The 12CO J = 1−0 moment 0, 1 and 8 map and line spectrum are shown in Fig. 5.
3. Results
3.1. Continuum emission
We detect the disk around HD 97048 in the ALMA band 3 and band 7 observations, as well as in the ATCA observations. We spatially resolved the continuum emission in the ALMA band 3, ALMA band 7, and ATCA 33/35, 38/40, 43/45 GHz and 93/95 extended array observations, and even the 91/97 GHz hybrid configurations. While the 3 mm to 7 mm ATCA observations are resolved and we fit the continuum emission with a Gaussian to derive their fluxes, we only used the 33/35 GHz data for imaging. We list the extracted flux densities and the deconvolved size, inclination and position angle derived by fitting a disk or Gaussian in the uv plane in Table 2 and show the CLEANed continuum maps in Fig. 1. We adopt the disk inclination of 41.4 ± 0.9° and the position angle of 4.5 ± 0.1°, as determined from the ALMA band 7 continuum observations, throughout this work.
A disk cavity is directly visible in the ALMA band 7 image, but surprisingly is not detected in the other observations (e.g., ATCA 29 August 2014) although the spatial resolution is adequate. The ALMA band 7 image also shows a break in the radial brightness distribution at a distance of ≈1′′ (158 AU). We highlight this structure in Fig. 2, where we show the image CLEANed using super-uniform weighting, an image reconstructed using only the baselines >160 kλ to emphasize faint structures, and an image reconstructed using MEM instead of CLEAN. The inner cavity and the break can be seen in the integrated radial surface brightness profile as shown in Fig. 7, where we show the superuniformly CLEANed ALMA band 7 image deprojected using the disk position angle and inclination listed in Table 2 in the bottom right panel. The same image transformed to polar coordinates is shown in the top left panel and is collapsed in the radial (top right panel) and azimuthal (bottom left panel) dimension to obtain the respective integrated surface brightness structures. Radially, the intensity peaks at ≈0.3′′, while a shoulder is visible in the intensity profile between ≈0.8 and 1.2′′. Ultimately, another break in the slope of the surface brightness is visible at a distance of 1.90′′.
The radial surface brightness distribution of the disk outside of the cavity can be approximately described by three power-laws, as is best seen on a logarithmic scale shown in the inset in the bottom left panel of Fig. 7. We fit a power-law to these three sections of the form a0× ra1 between 0.3 and 2.6′′, separated at 1.05′′and 1.95′′. This results in best-fit values for [a0, a1] to the normalized radial surface brightness of [0.5, −0.8], [0.7, −5.7] and [14.3, −10.4], respectively. Azimuthally the brightness fluctuates with an amplitude of at most 4%, most of which can be accounted for by image reconstruction artifacts (see Sect. 4.1).
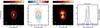 |
Fig. 3 Summary of 12CO J = 3−2 line emission in HD 97048. We show the integrated intensity (moment 0, left panel), intensity-weighted velocity (moment 1, second panel), peak intensity (moment 8, third panel) and the collapsed emission line (right panel). Each moment map was made using a 3σ cutoff and emission imaged using Briggs weighting. Overplotted in the three left panels are the same continuum contours as in the left panel of Fig. 1. The beam is shown in orange in the bottom left corner of each panel. In the right panel we show the spectrum mirrored at the systemic velocity with a gray line. The gray shaded area denotes the + and −3σ level calculated outside the line boundaries. |
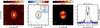 |
Fig. 4 Summary of HCO+ J = 4−3 line emission in HD 97048. We show the integrated intensity (moment 0, left panel), intensity-weighted velocity (moment 1, second panel), peak intensity (moment 8, third panel) and the collapsed emission line (right panel). Each moment map was made using a 3σ cutoff and emission imaged using Briggs weighting. Overplotted in the three left panels are the same continuum contours as in the left panel of Fig. 1, and the inset at the velocity map shows the inner 0.5′′ of the velocity map made using a 5σ cutoff. The beam is shown in orange in the bottom left corner of each panel. In the right panel we show the spectrum mirrored at the systemic velocity with a gray line. The gray shaded area denotes the + and −3σ level calculated outside the line boundaries. |
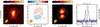 |
Fig. 5 Summary of 12CO J = 1−0 line emission in HD 97048. We show the integrated intensity (moment 0, left panel), intensity-weighted velocity (moment 1, second panel), peak intensity (moment 8, third panel) and the collapsed emission line (right panel). Each moment map was made using a 3σ cutoff and emission imaged using Briggs weighting. Overplotted in the three left panels are the same continuum contours as in the central panel of Fig. 1. The beam is shown in orange in the bottom left corner of each panel. In the right panel we show the spectrum mirrored at the systemic velocity with a gray line. The gray shaded area denotes the + and −3σ level calculated outside the line boundaries. |
The ALMA band 3 image is spatially resolved, but shows neither an inner cavity nor a radial structure. The 34 GHz ATCA image, finally, shows a peak of emission coincident with the stellar position after correction for its proper motion.
The SED between 0.853 mm and 5.45 cm can be constructed for HD 97048 using the ATCA and ALMA fluxes reported here, complemented by 1.3 mm SEST fluxes (Henning et al. 1993, 1998) and 5.5 to 19 GHz re-reduced archival ATCA observations. Some of the latter have previously been presented in Ubach (2014). The HD 97048 SED is shown in the left panel of Fig. 8. A break at ≈10−13 mm separates two parts that are probably dominated by different emission mechanisms. At shorter wavelengths, thermal dust emission from the disk dominates, while the flattening of the SED at longer wavelengths suggests that a different emission mechanism is responsible for much of this emission. This might be thermal wind (free-free) emission from a stellar or a disk outflow or a photo-evaporating disk (Pascucci et al. 2012), or even a non-thermal process from the star itself or the star-inner disk boundary.
A linear least-squares fit to the 1–10 mm portion of the SED yields a spectral index α (where F ∝ να) of 3.1 ± 0.1. The spectral slope beyond 10 mm is more difficult to reliably determine for several reasons. For instance, the S/N is lower (due to only 20–60 min on-source times), the source is much fainter at longer wavelengths, and the data are affected by RFI. The lower spatial resolution of the ATCA hybrid arrays combined with the increased background of extragalactic radio sources makes a unique identification of HD 97048 more challenging. Despite these difficulties, we estimate that the fluxes at 5.5 and 9 GHz are approximately the same at about 0.3 mJy, but with a factor of 2 uncertainty. To obtain a spectral index for the measurements beyond 10 mm, we first subtracted the extrapolated contribution of the power-law obtained from the measurements between 1 and 10 mm, and obtained a best fit to these corrected measurements of α = 0.4 ± 0.6. We discuss the ATCA data in more detail in Sect. 4.3.
3.2. CO and HCO+ emission
We spatially and spectrally resolved the 12CO J = 1−0, 12CO J = 3−2 and HCO+ J = 4−3 emission in the HD 97048 disk. The integrated intensity (moment 0), intensity-weighted velocity (moment 1), and peak intensity (moment 8) maps, plus the spectra, are shown in Figs. 3, 4, and 5 for the 12CO J = 3−2 emission, the HCO+ J = 4−3 emission, and the 12CO J = 1−0 emission, respectively. The integrated fluxes and disk sizes as measured along the disk major axis for all line emission >3σ are listed in Table 3.
 |
Fig. 6 Selected channel maps showing the 12CO channels in color and the 3σ outline in purple, the HCO+ emission 3σ outline with black contours, and the continuum contours in white. In the top right corner of each panel we note the vlsr in white with the velocity with respect to the systemic velocity of 4.75 km s-1 in parenthesis. The clean beam is shown in orange in the bottom left corner of each panel. Note the foreground absorption for the CO emission in the leftmost panels, and the emission inside the disk gap in the rightmost panels. Complete channel maps are shown in Fig. A.1. |
The 12CO emission shows a broad absorption feature between 3.4 and 5.7 km s-1, completely blocking line and continuum emission. The drop below 0 in the spectrum seen most clearly in the right panel of Fig. 3 is a natural consequence of subtracting the continuum over the channels where both the continuum and line emission are filtered out by foreground absorption. The HCO+ line appears unaffected by this foreground absorption.
We determined the systemic velocity from the HCO+ spectrum to be vLSR = 4.75 ± 0.1 km s-1 based on the peak-to-peak separation and on the symmetry of the emission in the channel maps, of which we show a subset in Fig. 6. We show the complete set of channel maps in Fig. A.1. The 12CO and HCO+ integrated emission maps peak inside of the disk cavity. The 12CO J = 3−2 and HCO+ J = 4−3 lines have a maximum half width in the line wings of 8.5 and 6.0 km s-1, respectively, determined from the presence of emission >3σ in the channel maps. These values can be translated into an emitting radius of 13.4 and 27.0 AU, assuming the gas is in Keplerian rotation in a disk inclined by 41.4°around a 2.5 M⊙ star. The gas disk as measured for all three lines is more extended than the continuum emission. The outer radius measured along the semi-major axis, considering only the emission above 3σ and deconvolved with the beam for the 12CO J = 1−0, J = 3−2, and HCO+ J = 4−3, is 4.2′′, 5.2′′, and 2.9′′, respectively. This is a factor of 1.9, 2.3, and 1.3 larger than the continuum emission.
Line fluxes, spectral resolution, and spatial extent for the CO J = 1−0, J = 3−2 and HCO+J = 4−3 lines.
3.3. ISO-ChaI 126
ISO-ChaI 126 is a 0.5 M⊙ + 0.5 M⊙ binary, located 35′′ north of HD 97048 and part of the Chameleon I star-forming region. It is resolved using NACO Ks band imaging by Daemgen et al. (2013), with A and B components separated by 0.28′′ at a position angle of 228.8°. We detect emission from the ISO-ChaI 126 system in the ALMA band 3 and the ATCA data at 18, 34, and 44 GHz. The system is spatially resolved only in the ATCA observations at 34 GHz, which we show imaged using natural weighting in Fig. 9. We list the integrated flux values, derived from fitting a Gaussian to the visibilities, in Table 4. We resolve an elongated structure in the 34 GHz ATCA data with a total flux of 0.7 ± 0.1 mJy, and a major and minor axis of 1.89 ± 0.24′′ and 0.62 ± 0.09′′ at a position angle of 174 ± 4° deconvolved from the beam when fitting a Gaussian to the image. The stellar positions fall approximately in the center of this structure when corrected for the proper motion of HD 97048.
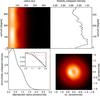 |
Fig. 7 ALMA Band 7 image reconstructed using superuniform weighting as described in Sect. 2.2, deprojected using the disk inclination and position angle listed in Table 2, bottom right panel, and converted into polar coordinates (top left panel). This map is collapsed along the radial and azimuthal axes to yield the azimuthal intensity distribution (top right) and the radial intensity distribution (bottom left). With an inset in this bottom left panel we zoom in between 0.3 and 2.6′′ with the normalized intensity plotted in log scale. We also overplot the three power-law fits discussed in Sect. 3, separated at 1.05 and 1.95′′. |
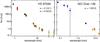 |
Fig. 8 SED for HD 97048 (left panel) and ISO ChaI-126 (right panel). The error bars shown in both panels include a calibration uncertainty of 10% (ALMA), 20% (ATCA + Herschel) and 30% (SEST). Left panel: compilation of all points beyond 850 μm including literature data from SEST (red, Henning et al. 1993, 1998), ALMA (black) and ATCA (orange) data presented in this paper. Overplotted with gray lines are linear least-squares fits to parts of the SED between 1 and 10 mm and between 10 mm and 5.45 cm. The latter fit was made using fluxes corrected with extrapolated fluxes from the 1−10 mm fit. These corrected fluxes are shown with small gray dots. Right panel: compilation of all points beyond 70 μm including literature data from Herschel (blue, Winston et al. 2012), ALMA (black) and ATCA (orange) data presented in this paper. Overplotted with gray lines is a linear least-squares fit to all data points. |
Continuum fluxes for ISO ChaI-126 determined from fitting a Gaussian to the uv plane.
Linear least-squares fits to the ALMA and ATCA detections, complemented by Herschel detections reported by Winston et al. (2012), yield a spectral index α = 1.9 ± 0.2 (Fig. 8, right panel). We discuss our interpretation of ISO-ChaI 126 in Sect. 4.7.
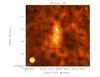 |
Fig. 9 34 GHz emission from the ISO-Cha1 126 binary system resolved with ATCA. Overplotted with black contours we show 5 and 7.5 times the rms of 0.010 mJy beam-1, the beam is shown in yellow in the bottom left corner. The white plus signs denote the J2000 coordinates of the A and B components corrected for the proper motion of HD 97048. |
4. Discussion
The data presented here indicate at face value that the continuum emission from the disk around HD 97048 extends out to 2.25′′ (355 AU) and shows radial structure, including a drop in intensity out to ≈0.3′′ and a shoulder farther out at ≈1′′. The gas disk, as most accurately traced by the 12CO J = 3−2 emission, extends up to a factor of 2.4 beyond the continuum emission.
The radial brightness distribution of the dust continuum emission between 0.3 and 2.6′′ can be loosely fitted by three power-law fits separated at 0.95′′ and 1.95′′ with indices of −0.8, −5.7 and −10.4 respectively. Such a three-stage power-law with increasingly smaller indices toward the outer disk reflects a reasonable representation for the radial dust distribution when solving the bulk transport of solids embedded in a gas-rich viscous accretion disk. In this case, the first slope represents a fragmentation-limited dust distribution in the inner disk, the second a drift-dominated dust distribution in the outer disk, and the last a steep drop outside of the disk outer edge (Birnstiel & Andrews 2014). We thus interpret the final part of the radial intensity distribution between 1.95′′ and 2.6′′ as a smearing effect by the beam of a sharp outer disk edge at 2.25′′. The observed steep drop in mm-dust emission and a more extended gas disk is consistent with size sorting of the larger grains through radial drift (e.g., Birnstiel & Andrews 2014; Laibe 2014).
The first break in the radial intensity distribution at ≈1′′ separates two slopes that are similar to the broken power-law values found for the disk around TW Hya by Hogerheijde et al. (2016, −0.53 and − and Andrews et al. (2016, −0.7 and −. Such a broken power-law structure can be caused either by a decrease in emission inside 1′′ or a boost in emission outside 1′′. Both these options are physically motivated: a decrease in emission could be the result of a gap that is carved out by a forming planet (Wolf & D’Angelo 2005), MHD effects (Flock et al. 2015), or be the result of rapid grain growth at a condensation front (Zhang et al. 2015). An additional emitting ring can be caused by fragmentation and drift-dominated dust distributions, but also by other mechanisms, such as an enhancement or pile-up in small dust grains caused by the sintering of aggregates (Okuzumi et al. 2016), for instance, or by a self-induced dust pile-up resulting from the interplay between aerodynamic drag and the growth, fragmentation, and migration of grains as described by Gonzalez et al. (2015).
We used the 3D, Monte Carlo-based, radiative transfer code MCFOST (Pinte et al. 2006, 2009) to simulate an axisymmetric disk that we compared to our observations to test whether these two proposed scenarios, a gap or a ring, can indeed account for the observed feature.
4.1. Radiative transfer modeling
We used the MCFOST model parameters from a model based on the SED and mid-IR observations of HD 97048 (Doucet et al. 2007), and updated this model with the disk inclination and position angle listed in Table 2. To test whether the two scenarios can be reproduced by this model disk, we either carved a Gaussian gap with variable width and depth in it, or added an additional emitting ring with variable width and mass. We then modified the disk inner and outer radius and radial surface density exponent to match our observations. We chose not to include an inner disk between 0.1 and 2 AU into our modeling. Such a disk was modeled by Maaskant et al. (2013) to account for the NIR excess in the SED. The contribution of such an inner disk to the 0.85 mm flux is ≈1/1000 compared to the contribution of the outer disk, and its inclusion or exclusion will have no effect on our modeling.
After computing the model disk, we used the CASA tasks simobserve to convert the image into visibilities, as would be observed with a similar antenna configuration and on-sky properties as for our ALMA band 7 observations. Finally, we CLEANed the visibilities and compared these simulated observations, both directly using the visibilities and in the image plane, with our data. We stress that our MCFOST models are meant to match the radial brightness distribution of the ALMA band 7 data, and not to be a comprehensive model for the disk at other wavelengths.
We find that both tested underlying brightness distributions produce comparable matches to the observations. For example, a sample gap-model with a disk between 46 and 290 AU with a flared surface density exponent and a gap between 79 and 101 AU produces similar residuals to a sample ring-model of a continuous disk between 31 and 280 AU with a surface density exponent of −1.6 that has additional emission superimposed as a ring between 135 and 180 AU. We show the ring model, the residuals, and the deprojected visibilities in Fig. 10. As our models are meant to explore the possible range of underlying brightness distributions, we did not determine confidence intervals for our derived parameters. Instead, we discuss the general trends learned from our efforts to reproduce the observations.
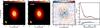 |
Fig. 10 Comparison of ALMA band 7 data (left panel) with the ring model image degraded to the resolution of our data (second panel). Third panel: residuals of the observations minus the model with the inner and outer radius of the model disk at 43.5 and 280 AU shown with green ellipses. Red and blue contours at ±0.2 mJy highlight the extent of the outer disk in the residual image. Units of all intensity scales are in Jy/beam. Right panel: real part of the visibilities as function of the deprojected baseline for the data (top panel, black dots) and the model (red line). Bottom panel: residuals. The visibilities are binned to have a constant amount of baselines per bin. Error bars are mostly smaller than the plot symbol size and are shown with blue vertical lines |
In general, our observations are well reproduced by a model disk starting between 40 and 46 AU and extending out to 280 to 300 AU. The width of either the disk gap or the additional emitting ring is not well constrained because it depends on the depth or intensity of the feature, respectively. Radially, the gap is centered on ≈90 AU and the ring farther out on ≈150 AU. All our model disks are optically thick at 853 μm for the first 15 to 20 AU starting at the inner rim of the disk. These model disks fit the observations reasonably well with maximum residuals of a few percent of the original image in the inner 200 AU. Most notably, these residuals are present at the location of the inner rim of the disk, where our axisymmetric model underpredicts flux at the southeastern inner rim and overpredicts the emission at the northwest side of the inner rim. Furthermore, our best choice for the outer disk radius in the model is about 0.5′′ smaller than the size derived from fitting the disk visibilities, which is corroborated by faint emission up to 2.25′′ that can be seen in the residual image. Our model disk is truncated sharply at the disk outer edge, but as discussed, the radial intensity distribution shows a gradual but steep decrease beyond 1.95′′. Using a more gradually truncated outer disk prescription such as a tapered exponential will most likely result in a better agreement between our model and the observations.
4.2. Inner cavity
The surface brightness of an inclined optically thin disk peaks along the major axis because of projection effects. The ALMA band 7 data in contrast shows a disk whose surface brightness peaks along the disk minor axis. This can be naturally explained by the combination of a disk that is optically thick in the first 10−20 AU from the outer disk inner rim, such as we find in our models, and which negates the projection effect, and the effect of convolution with a beam that is aligned along the major axis of the disk, as is the case for our observations.
In our best models, the disk starts at 40 to 46 AU from the star and is truncated sharply at the inner rim radius. Choosing a more gradual transition can shift the inner radius of the disk inward to between 5 and 10 AU. A disk cavity with a radius of 34 ± 4 AU has been predicted by Maaskant et al. (2013) based on simultaneous modeling of the SED and spatially resolved Q-band (20 μm) spectrum. In contrast, polarimetric differential imaging did not detect any cavity with a size larger than 16 AU in radius (Quanz et al. 2012), while spatially resolved 12CO ro-vibrational emission in the fundamental band at 4.6 μm has been detected as close in as 11 AU from the star (van der Plas et al. 2009, 2015). Such a trend of cavity size that increases for larger grain sizes is in quantitative agreement with filtering of the dust by a pressure maximum induced by an orbiting body, for example (e.g. Lin & Papaloizou 1979; Pinilla et al. 2012), or a dead zone (Flock et al. 2015), although the latter is not expected to leave an imprint on the gas (Ruge et al. 2016). There is furthermore a hint of an azimuthal peak in brightness at the southeastern side of the inner rim of the outer disk show in Fig. 10, where the residuals after subtraction of the model show azimuthal asymmetry in the form of a surplus of material at the SE side of the inner disk rim and a deficiency at the other side. Additional higher S/N observations are needed to confirm this azimuthal brightness asymmetry.
Finally, the strong NIR excess present in the SED is suggestive of hot dust close to the star. Maaskant et al. (2013) modeled an inner disk between 0.1 and 2 AU to explain this emission, for instance. The emission from this inner disk is a factor ≈1000 weaker than the contribution of the outer disk at the ALMA band 7 wavelength, and our data cannot confirm or refute the existence of this inner disk.
4.3. Large grains and free-free emission filling in the disk cavity in the ATCA data
The value of the spectral index for the thermal dust emission of 3.1 ± 0.1 is consistent with a dust distribution in the disk with relatively large grains. These would certainly be up to mm sizes, and thus indicative of significant growth from typical interstellar dust grain sizes of about one tenth of a micron (e.g., Pérez et al. 2012).
The break in the SED shown in Fig. 8 around ≈10 mm is suggestive of emission from another mechanism, additional to the thermal dust emission. Free-free emission (thermal bremsstrahlung) from an idealized spherical, isothermal, constant-velocity outflow is predicted to have a spectral index of ≈0.6 (Wright & Barlow 1975). We repeat that the ALMA band 7 fluxes trace at least partially optically thick emission as suggested by our modeling, and note that the ATCA observations presented in this work cover several years. Free-free emission from an ionized wind may vary by ≈20 to 40% on a timescale of years (González & Cantó 2002; Loinard et al. 2007). On the other hand, non-thermal emission may vary over a timescale of minutes to hours by up to an order of magnitude or more (Kutner et al. 1986; Chiang et al. 1996). Variability has been detected on relatively short timescales of minutes to hours for HD 100546 in Wright et al. (2015), for example, and for factors of a few as shown for DK Cha, T Cha, and Sz 32, for instance (Ubach et al. 2012).
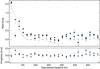 |
Fig. 11 Visibilities of the ATCA 33+35 GHz (circles) and 38+40 GHz (diamonds) observations deprojected using the disk inclination and position angle determined using the ALMA band 7 observations as listed in Table 2, and their 1σ error values shown in blue. We also show a version of our best-fit MCFOST ring model scaled to the 34 GHZ flux with a gray line and the ATCA visibilities after subtracting a 0.2 mJy point source at the stellar position for the 33+35 GHz observations and a 0.15 mJy point source at the stellar position for the best part of the 38+40 GHz observations, both with gray symbols. |
The 5.5/9 GHz observations of 30 May 2011 consist of two 30-min observations separated by about five hours. We do not see evidence of variability between the two epochs at either frequency. However, given the considerations previously mentioned concerning the challenges of these frequencies, a clear statement about variable cm emission for HD 97048 must await additional (and better) data.
Despite their comparable resolutions, the 34 GHz ATCA image does not show the disk cavity as seen in the ALMA band 7 image. Instead, regardless of the weighting used in the inversion and image reconstruction, including natural, uniform and super-uniform, the emission appears to be centrally peaked at the stellar position within positional uncertainties. Even so, at all of the frequencies observed with ATCA between 33 and 97 GHz, the primary component of the emission is easily resolved. In the most complete data set of 29 August 2014, the source size, inclination, and PA are consistent with those properties determined from the ALMA data and what had previously been inferred for the disk from other observations. Yet, as seen in Fig. 11, the real part of the deprojected visibilities does not cross zero. There is no null, which would otherwise indicate a relatively sharp drop in the dust density, that is, a cavity. Instead, the visibility drops from the peak of ≥2 mJy and then plateaus at around 0.15−0.2 mJy.
Assuming that the main lobe of emission in Fig. 11, and the plateau, represent two different source components, there is a difference of about an order of magnitude between the two contributors. Since in uv-space the amplitude of a point source has a constant visibility, we suggest that the plateau arises from an unresolved component. This is unlikely to be either hot dust emission from an inner disk or a photoevaporating inner disk, since the inner disk is not seen in the ALMA data. It must instead be either free-free emission from a wind or outflow, or otherwise non-thermal emission. Fitting an unresolved point source to our data in the image plane yields a flux for that component of 0.2 mJy, similar to the plateau component seen in the visibilities of the fourier plane.
Furthermore, using uvfit to simultaneously fit the 33/35 GHz 29 August 2014 data with point and Gaussian sources, with minimal channel averaging and no binning over uv distance, yields fluxes of around 0.18 and 1.85 mJy at 33 GHz, and 0.19 and 2.21 mJy at 35 GHz. We note that these nicely reproduce the total fluxes listed in Table 2. Similarly for the best data on 30 August 2014, the respective point and Gaussian fluxes are around 0.16 and 2.15 mJy at 38 GHz, and 0.16 and 2.28 mJy at 40 GHz, again consistent with the total fluxes in Table 2. When we repeat this for the 43/45 GHz observations of 2 August 2009, although the uv coverage is sparser and the S/N lower, the point source component is suggested instead around 0.3 ± 0.1 mJy. Models for a point plus disk and point plus ring were also tried at 33/35 and 38/40 GHz, but the results were unsatisfactory and did not reproduce the observed total fluxes in Table 2. To the extent that the inter- and intra-band spectral indices can be believed, it appears that the spectral index of the point source is thus quite flat. Interestingly, the relatively low value of the spectral index α beyond 10 mm agrees well with the point source flux of the point plus Gaussian source model. It may also be consistent with a free-free emission scenario.
Overall, the shape of the ATCA visibilities at both 33/35 and 38/40 GHz agree in general with the ALMA band 7 visibilities, including the fast drop out to 130 kλ and the minimum around 350 kλ. To better compare the ALMA and ATCA data sets, we subtracted a point source from the ATCA visibilities using the MIRIAD task uvmodel, with point source fluxes as given above. The resulting visibilities, together with a version of the best-fit MCFOST model visibilities scaled to the ATCA 34 GHz flux, are shown in the top panel of Fig. 11. All three visibility curves agree quantitatively, which suggests that the disk also has a cavity as traced by grains emitting at 34 GHz. We confirm that adding an unresolved component at the stellar position to our model and convolving it with a beam comparable to that of the ATCA observations fills in the disk cavity in the image plane.
4.4. Radial drift, a flaring disk structure, gas inside the dust cavity and apparent non-Keplerian motions
The disk around HD 97048 is more spatially extended than the continuum disk in all of the gas lines detected. The continuum disk at 0.853 mm shows a very sharp drop at 1.95′′ (Fig. 7), while the 12CO J = 3−2 emission line is detected out to a radial extent of 5.2′′. Such a sharp drop in the radial continuum brightness and a size discrepancy between a gas line and the associated continuum are fingerprints of the transport of the larger dust grains, dominated by inward radial drift (e.g., Panić et al. 2009; Andrews et al. 2012).
Based on the peak intensity map shown in Fig. 3, in which the disk opening angle can be seen as a butterfly pattern, it is evident that the 12CO J = 3−2 emission originating from the disk midplane is weaker than the emission that traces the warm molecular layer higher up in the disk, and that it is similar to the PAH emission, which traces very small particles on the disk surface, imaged by Lagage et al. (2006). This is more clearly visualized in Fig. 6, where we show selected channels maps of the 12CO and HCO+ emission. The central panels show projected velocities between ±1.01 and ±1.65 km s-1 from the systemic velocity, where the emission is most extended. 12CO emission predominantly originating from the near and far side of the disk is shown in these panels, separated by the HCO+ emission, which traces emission closer to the midplane. As HCO+ ions quickly disappear without gas-phase CO molecules (e.g., Cleeves et al. 2014), gas-phase CO molecules are still required at the depths where the HCO+ emission originates. A vertical temperature gradient that cools toward the midplane, as discussed in e.g., Semenov et al. (2008), de Gregorio-Monsalvo et al. (2013), and Rosenfeld et al. (2013), for HD 163296, naturally explains the vertical separation of the 12CO emission while still allowing HCO+ emission.
Based on Keplerian velocities and the location in the resolved maps, the 12CO and the HCO+ emissions extend inside the cavity. Calculated from the width of the lines, the HCO+ can be traced down to 27.0 AU and the 12CO down to 13.4 AU. This latter value agrees well with the inner radius found for the ro-vibrational CO emission lines that emit from a radius of ≈11 AU (van der Plas et al. 2009, 2015). Inside this radius, the disk appears to be devoid of warm CO gas most sensitively traced by ro-vibrational CO emission, but some gas is present, as atomic oxygen gas emission is detected as close in as several tenths of an AU (Acke & van den Ancker 2006).
Inside the cavity, the velocity map of the HCO+ emission (see Fig. 4) shows an s-shaped pattern, characteristic for non-Keplerian in-falling gas or an inner disk warp, as described by Rosenfeld et al. (2014) and Casassus et al. (2015a), for example. This pattern is not visible in the 12CO velocity map, which is likely a consequence of the broad foreground absorption. Given the coarse spatial resolution of our observations inside the cavity, we cannot distinguish between the two scenarios. A small inner disk between 0.3 and 2.0 AU as proposed by Maaskant et al. (2013), in combination with a substellar companion on an inclined orbit with respect to the outer disk (Casassus et al. 2015a), could drive a persistent warp of the inner disk. Regardless, either scenario for the apparent non-Keplerian motion favors strong gravitational torques inside the cavity to either remove the angular momentum from the gas (Rosenfeld et al. 2014) or to warp a possible inner disk.
Summarizing, both the cavity size that varies with wavelength and the apparent non-Keplerian motions inside the disk cavity indicate an orbiting body inside the cavity. This is, together with the very low mass accretion rate, in line with the conclusions of Kama et al. (2015), who proposed that the depletion of heavy elements found in the stellar spectrum emerges as a Jupiter-like planet blocks the accretion of part of the dust and to lesser extent the gas.
4.5. HD 97048 in context with other transitional disks
Before ALMA, only the most obvious disk structures, such as inner cavities and very large gaps, could be identified from the SED and/or low-resolution imaging. ALMA provides the combination of resolution and sensitivity needed to reveal more subtle structures, such as narrow gaps and rings, azimuthal asymmetries, and spiral arms. Such structures have also been revealed by the new generation of extreme adaptive optics imagers, including the Gemini Planet Finder and SPHERE (Wagner et al. 2015; Rapson et al. 2015).
The inner cavity in HD 97048 has previously been inferred from spatially resolved spectroscopic 20 μm emission and SED modeling (Maaskant et al. 2013). However, the gap (or ring) in the outer disk was previously unknown. In addition, Walsh et al. (2016) infer yet another peak in the intensity distribution at ≈300 AU, based on modeling of the visibilities. Similar gaps have been seen in the Class I object HL Tau (ALMA Partnership et al. 2015) and in the much older TW Hydra disk (Andrews et al. 2016), and they might be relatively common considering that only a handful of targets have been observed at comparable resolution. A recent reanalysis of the HL Tau data suggests that the gaps are also present in the gas surface density as traced by the HCO+ J = 1−0 line observations (Yen et al. 2016). The origin of these gaps is still a matter of intense debate. As discussed in the previous section, proposed explanations include dynamical clearing by massive planets (Wolf & D’Angelo 2005), enhanced particle growth at snow lines (Zhang et al. 2013), and MHD effects (Flock et al. 2015).
With the caveat that the limited spatial resolution of our observations does not allow us to differentiate between a gap or a ring, the properties of the disk around HD 97048 are remarkably consistent with giant planet-formation. Based on the current observational constraints on the occurrence of giant extra-solar planets (e.g., Montet et al. 2014; Reffert et al. 2015), it is clear that most protoplanetary disks should not form planets massive enough to open wide gaps. However, demographics of extra-solar planets around main-sequence stars indicate that on average each star has at least one planet (Cassan et al. 2012), and we therefore expect that many disks will form planets. A high incidence of planet-induced gaps in ALMA images is still consistent with the demographics of extra-solar planets given the strong observational bias toward observing the brightest, most massive disks at the resolution required to reveal substructure. Such disks represent the tail of the disk mass distribution and are therefore the most likely birth places of giant planets. We note that even though the TW Hydra disk might currently have a modest luminosity, it is an unusually long-lived disk and was probably much more massive in the past. Future long-baseline surveys are needed to establish the incidence of narrow gaps in protoplanetary disks and how their occurrence depends on disk properties such as mass and age.
4.6. Minimum planetary mass needed to explain the observed disk cavity
Planetary signatures in disks are more easily detected in the spatial dust distribution than in that of the gas. Dust grains that are coupled to the gas through aerodynamic drag tend to collect in pressure maxima in disks (Barge & Sommeria 1995). If a gap were to be opened by a planet, then dust would accumulate in the induced pressure maximum at the outer edge of the planet gap, resulting in an enhanced contrast between the gap and its outer edge in the dust continuum emission. This contrast in the dust would be greater than that seen in the gas. This enhanced observability has been demonstrated using simulations by e.g. Rice et al. (2006), Owen (2014), and Zhu et al. (2014). More recently, Rosotti et al. (2016) estimated the minimum planetary mass needed to produce detectable signatures at different wavelengths in protoplanetary disks based on the radial location of the planet and the width and distance of the disk gap. We used their simulations to estimate the mass a hypothetical planet should have, were it to be responsible for inducing the cavity we detect at 853 μm.
Since the sub-mm image shows a cavity, we estimated the hypothesized planet to be located between the outer rim of the inner disk, at 2.5 AU (Maaskant et al. 2013) and the most inner location where CO gas is detected, at 11 AU (van der Plas et al. 2009). These distances yield a ratio between the gap width and gap radius in the range of 0.06 and 0.26. Using a stellar mass of 2.5 M⊙, we estimate a maximum planetary mass between 0.12 and 0.71 Mjup, based on simulation parameters adopted for Fig. 17 in Rosotti et al. (2016), and with the caveat that this is a lower limit if the cavity in the HD 97048 disk is younger than 400 planetary orbits.
4.7. Disk around ISO-ChaI 126
The spectral index measured between 70 μm and 15.8 mm of 1.9 ± 0.2 is consistent with thermal dust emission originating from a disk. The difference between the position angles of the elongated structure and the binary of 55° argues against emission from an outflow. We therefore interpret the emission as coming from a disk. Based on the major and minor axis ratio, this disk is inclined by 71° . We estimated the emitting dust mass at 43 GHz, by assuming the disk is isothermal and optically thin, using the relation
  (1)Here, Sν is the 43 GHz flux density, d is the distance, κν is the dust opacity, and Bν( ⟨Tdust⟩) is the blackbody function at the dust temperature. We scaled the opacity to 43 GHz with the assumptions of κ1.3 mm = 2.3 g-2 cm2 and κ ~ ν0.4, following Andrews et al. (2013). We estimate the averaged dust temperature in a disk with an outer radius of 150 AU around a 0.5 M⊙, 3 Myr old star, to be 15 K (van der Plas et al. 2016). The combined mass of the binary system is 1.02
 (Daemgen et al. 2013). Using a gas-to-dust ratio of 100, these assumptions result in a total disk mass of 0.0082 M⊙, or 0.80% of the total system mass. This is a very reasonable value for the disk and stellar mass ratio, and strengthens our disk interpretation for the resolved structure around ISO ChaI-126.
5. Conclusions
We summarize the main conclusions of this work as follows:
-
The dust disk of HD 97048 is resolved and extends radially out to 2.25′′, after which the surface density drops sharply.
-
A dust cavity is visible in the 853 μm continuum emission out to 43 ± 3 AU.
-
Beyond the outer disk inner rim, we find additional radial structure in the continuum surface brightness profile. This radial structure can be modeled with either a disk gap centered on ≈90 AU or with an additional emitting ring centered on ≈150 AU.
-
The disk cavity is not detected at 9 mm because free-free emission from the star fills in the cavity at our spatial resolution.
-
The 12CO J = 1−0, 12CO J = 3−2 and HCO+ 4−3 emission lines all are more extended than the disk continuum emission, up to a radius of 5.2′′ for the 12CO J = 3−2 emission. The discrepancy in size between the mm dust emission and the associated line emission, together with the sharp outer edge of the dust disk, can be explained by inward radial drift of the larger dust grains.
-
Both the HCO+ J = 4−3 and the 12CO gas extend inside the dust cavity, down to distances as close as 13.4 AU from the central star.
-
The HCO+ intensity-weighted velocity map shows a velocity structure deviating from the Keplerian motion that is expected from a co-planar disk inside of the cavity. Possible explanations for this velocity structure are a distortion by an inclined inner disk and an additional non-Keplerian velocity component.
-
A cavity size varying with dust grain size and the apparent non-Keplerian motions inside of the cavity indicate that an additional body orbits inside the cavity.
-
A planet with a mass of ≈0.7Mjup at a radial distance between 2.5 and 11 AU could open up the disk cavity observed at 853 μm.
-
We resolved emission between 2.9 and 16.7 mm from the 0.5 M⊙ + 0.5 M⊙ binary ISO-ChaI 126 that we interpret as originating from a disk. The spectral slope of this emission between 70 μm and 15.8 mm is 1.9 ± 0.2. Using standard assumptions, we calculated a total disk mass of 0.80% of the total system mass.
Note added in proof. We note that the high resolution VLT/SPHERE scattered light observations by Ginski et al. (2016), which have become available after the time of acceptance of this manuscript, confirm the features described here. They detect four ring-like features at the disk surface with radii between 39 AU and 341 AU.
Acknowledgments
G.v.d.P., S.C., L.C., S.P., and H.A. acknowledge support from the Millennium Science Initiative (Chilean Ministry of Economy) through grant RC130007. G.v.d.P. acknowledges financial support from FONDECYT, grant 3140393, C.M.W. acknowledges financial support from an Australian Research Council Future Fellowship FT100100495, L.C. acknowledges financial support from FONDECYT, grant 1140109, S.P. acknowledges financial support by FONDECYT, grant 3140601, H.A. acknowledges financial support by FONDECYT, grant 3150643, and S.C. acknowledges support from FONDECYT grant 1130949. H.C. acknowledges support from the Spanish Ministerio de Economía y Competitividad under grant AYA2014-55840P. FM acknowledges support from ANR-16-CE31-0013. This paper makes use of the following ALMA data: ADS/JAO.ALMA# 2013.1.00658.S and 2012.1.00031.S. ALMA is a partnership of ESO (representing its member states), NSF (USA) and NINS (Japan), together with NRC (Canada) and NSC and ASIAA (Taiwan), in cooperation with the Republic of Chile. The Joint ALMA Observatory is operated by ESO, AUI/NRAO and NAOJ. The National Radio Astronomy Observatory is a facility of the National Science Foundation operated under cooperative agreement by Associated Universities, Inc.
References
- Acke, B., & van den Ancker, M. E. 2006, A&A, 449, 267 [NASA ADS] [CrossRef] [EDP Sciences] [Google Scholar]
- ALMA Partnership, Brogan, C. L., Pérez, L. M., et al. 2015, ApJ, 808, L3 [NASA ADS] [CrossRef] [Google Scholar]
- Andrews, S. M., Rosenfeld, K. A., Wilner, D. J., & Bremer, M. 2011, ApJ, 742, L5 [NASA ADS] [CrossRef] [Google Scholar]
- Andrews, S. M., Wilner, D. J., Hughes, A. M., et al. 2012, ApJ, 744, 162 [NASA ADS] [CrossRef] [Google Scholar]
- Andrews, S. M., Rosenfeld, K. A., Kraus, A. L., & Wilner, D. J. 2013, ApJ, 771, 129 [NASA ADS] [CrossRef] [Google Scholar]
- Andrews, S. M., Wilner, D. J., Zhu, Z., et al. 2016, ApJ, 820, L40 [NASA ADS] [CrossRef] [Google Scholar]
- Avenhaus, H., Quanz, S. P., Schmid, H. M., et al. 2014, ApJ, 781, 87 [NASA ADS] [CrossRef] [Google Scholar]
- Barge, P., & Sommeria, J. 1995, A&A, 295, L1 [NASA ADS] [Google Scholar]
- Birnstiel, T., & Andrews, S. M. 2014, ApJ, 780, 153 [NASA ADS] [CrossRef] [Google Scholar]
- Brown, J. M., Blake, G. A., Qi, C., et al. 2009, ApJ, 704, 496 [NASA ADS] [CrossRef] [Google Scholar]
- Canovas, H., Schreiber, M. R., Cáceres, C., et al. 2015, ApJ, 805, 21 [NASA ADS] [CrossRef] [Google Scholar]
- Canovas, H., Caceres, C., Schreiber, M. R., et al. 2016, MNRAS, 458, L29 [NASA ADS] [CrossRef] [Google Scholar]
- Carmona, A., van der Plas, G., van den Ancker, M. E., et al. 2011, A&A, 533, A39 [NASA ADS] [CrossRef] [EDP Sciences] [Google Scholar]
- Casassus, S., Cabrera, G. F., Förster, F., et al. 2006, ApJ, 639, 951 [NASA ADS] [CrossRef] [Google Scholar]
- Casassus, S., van der Plas, G., M,Sebastian, P., et al. 2013, Nature, 493, 191 [NASA ADS] [CrossRef] [Google Scholar]
- Casassus, S., Marino, S., Pérez, S., et al. 2015a, ApJ, 811, 92 [NASA ADS] [CrossRef] [Google Scholar]
- Casassus, S., Wright, C. M., Marino, S., et al. 2015b, ApJ, 812, 126 [NASA ADS] [CrossRef] [Google Scholar]
- Cassan, A., Kubas, D., Beaulieu, J.-P., et al. 2012, Nature, 481, 167 [NASA ADS] [CrossRef] [Google Scholar]
- Chiang, E., Phillips, R. B., & Lonsdale, C. J. 1996, AJ, 111, 355 [NASA ADS] [CrossRef] [Google Scholar]
- Cleeves, L. I., Bergin, E. A., & Adams, F. C. 2014, ApJ, 794, 123 [NASA ADS] [CrossRef] [Google Scholar]
- Daemgen, S., Petr-Gotzens, M. G., Correia, S., et al. 2013, A&A, 554, A43 [NASA ADS] [CrossRef] [EDP Sciences] [Google Scholar]
- de Gregorio-Monsalvo, I., Ménard, F., Dent, W., et al. 2013, A&A, 557, A133 [NASA ADS] [CrossRef] [EDP Sciences] [Google Scholar]
- Doucet, C., Habart, E., Pantin, E., et al. 2007, A&A, 470, 625 [CrossRef] [EDP Sciences] [Google Scholar]
- Dullemond, C. P., & Dominik, C. 2004, A&A, 417, 159 [NASA ADS] [CrossRef] [EDP Sciences] [Google Scholar]
- Dunham, M. M., Offner, S. S. R., Pineda, J. E., et al. 2016, ApJ, 823, 160 [NASA ADS] [CrossRef] [Google Scholar]
- Fairlamb, J. R., Oudmaijer, R. D., Mendigutía, I., Ilee, J. D., & van den Ancker, M. E. 2015, MNRAS, 453, 976 [NASA ADS] [CrossRef] [Google Scholar]
- Fedele, D., van Dishoeck, E. F., Kama, M., Bruderer, S., & Hogerheijde, M. R. 2016, A&A, 591, A95 [NASA ADS] [CrossRef] [EDP Sciences] [Google Scholar]
- Flock, M., Ruge, J. P., Dzyurkevich, N., et al. 2015, A&A, 574, A68 [NASA ADS] [CrossRef] [EDP Sciences] [Google Scholar]
- Ginski, C., Stolker, T., Pinilla, P., et al. 2016, A&A, 595, A112 [NASA ADS] [CrossRef] [EDP Sciences] [Google Scholar]
- González, R. F., & Cantó, J. 2002, ApJ, 580, 459 [NASA ADS] [CrossRef] [Google Scholar]
- Gonzalez, J.-F., Laibe, G., Maddison, S. T., Pinte, C., & Ménard, F. 2015, MNRAS, 454, L36 [NASA ADS] [CrossRef] [Google Scholar]
- Gull, S. F., & Daniell, G. J. 1978, Nature, 272, 686 [NASA ADS] [CrossRef] [Google Scholar]
- Hales, A. S., De Gregorio-Monsalvo, I., Montesinos, B., et al. 2014, AJ, 148, 47 [NASA ADS] [CrossRef] [Google Scholar]
- Henning, T., Pfau, W., Zinnecker, H., & Prusti, T. 1993, A&A, 276, 129 [NASA ADS] [Google Scholar]
- Henning, T., Burkert, A., Launhardt, R., Leinert, C., & Stecklum, B. 1998, A&A, 336, 565 [NASA ADS] [Google Scholar]
- Hogerheijde, M. R., Bekkers, D., Pinilla, P., et al. 2016, A&A, 586, A99 [NASA ADS] [CrossRef] [EDP Sciences] [Google Scholar]
- Högbom, J. A. 1974, A&AS, 15, 417 [NASA ADS] [Google Scholar]
- Honda, M., Maaskant, K., Okamoto, Y. K., et al. 2012, ApJ, 752, 143 [NASA ADS] [CrossRef] [Google Scholar]
- Kama, M., Folsom, C. P., & Pinilla, P. 2015, A&A, 582, L10 [NASA ADS] [CrossRef] [EDP Sciences] [Google Scholar]
- Kraus, A. L., & Ireland, M. J. 2012, ApJ, 745, 5 [NASA ADS] [CrossRef] [Google Scholar]
- Kutner, M. L., Rydgren, A. E., & Vrba, F. J. 1986, AJ, 92, 895 [NASA ADS] [CrossRef] [Google Scholar]
- Lagage, P.-O., Doucet, C., Pantin, E., et al. 2006, Science, 314, 621 [NASA ADS] [CrossRef] [PubMed] [Google Scholar]
- Laibe, G. 2014, MNRAS, 437, 3037 [NASA ADS] [CrossRef] [Google Scholar]
- Lin, D. N. C., & Papaloizou, J. 1979, MNRAS, 188, 191 [NASA ADS] [CrossRef] [Google Scholar]
- Loinard, L., Rodríguez, L. F., D’Alessio, P., Rodríguez, M. I., & González, R. F. 2007, ApJ, 657, 916 [NASA ADS] [CrossRef] [Google Scholar]
- Maaskant, K. M., Honda, M., Waters, L. B. F. M., et al. 2013, A&A, 555, A64 [NASA ADS] [CrossRef] [EDP Sciences] [Google Scholar]
- Maaskant, K. M., Min, M., Waters, L. B. F. M., & Tielens, A. G. G. M. 2014, A&A, 563, A78 [NASA ADS] [CrossRef] [EDP Sciences] [Google Scholar]
- Marino, S., Casassus, S., Perez, S., et al. 2015, ApJ, 813, 76 [NASA ADS] [CrossRef] [Google Scholar]
- Martin-Zaïdi, C., Habart, E., Augereau, J.-C., et al. 2009, ApJ, 695, 1302 [NASA ADS] [CrossRef] [Google Scholar]
- Meeus, G., Waters, L. B. F. M., Bouwman, J., et al. 2001, A&A, 365, 476 [NASA ADS] [CrossRef] [EDP Sciences] [Google Scholar]
- Meeus, G., Salyk, C., Bruderer, S., et al. 2013, A&A, 559, A84 [NASA ADS] [CrossRef] [EDP Sciences] [Google Scholar]
- McMullin, J. P., Waters, B., Schiebel, D., Young, W., & Golap, K. 2007, Astronomical Data Analysis Software and Systems XVI, 376, 127 [NASA ADS] [Google Scholar]
- Montet, B. T., Crepp, J. R., Johnson, J. A., Howard, A. W., & Marcy, G. W. 2014, ApJ, 781, 28 [NASA ADS] [CrossRef] [Google Scholar]
- Nomura, H., Tsukagoshi, T., Kawabe, R., et al. 2016, ApJ, 819, L7 [NASA ADS] [CrossRef] [Google Scholar]
- Okuzumi, S., Momose, M., Sirono, S.-I., Kobayashi, H., & Tanaka, H. 2016, ApJ, 821, 82 [NASA ADS] [CrossRef] [Google Scholar]
- Owen, J. E. 2014, ApJ, 789, 59 [NASA ADS] [CrossRef] [Google Scholar]
- Panić, O., Hogerheijde, M. R., Wilner, D., & Qi, C. 2009, A&A, 501, 269 [NASA ADS] [CrossRef] [EDP Sciences] [Google Scholar]
- Pascucci, I., Gorti, U., & Hollenbach, D. 2012, ApJ, 751, L42 [NASA ADS] [CrossRef] [Google Scholar]
- Pérez, L. M., Carpenter, J. M., Chandler, C. J., et al. 2012, ApJ, 760, L17 [NASA ADS] [CrossRef] [Google Scholar]
- Perez, S., Casassus, S., Ménard, F., et al. 2015, ApJ, 798, 85 [NASA ADS] [CrossRef] [Google Scholar]
- Phillips, N. M. 2011, Ph.D. Thesis, University of Edinburgh, UK [Google Scholar]
- Piétu, V., Dutrey, A., Guilloteau, S., Chapillon, E., & Pety, J. 2006, A&A, 460, L43 [NASA ADS] [CrossRef] [EDP Sciences] [Google Scholar]
- Pinilla, P., Benisty, M., & Birnstiel, T. 2012, A&A, 545, A81 [NASA ADS] [CrossRef] [EDP Sciences] [Google Scholar]
- Pinte, C., Ménard, F., Duchêne, G., & Bastien, P. 2006, A&A, 459, 797 [NASA ADS] [CrossRef] [EDP Sciences] [Google Scholar]
- Pinte, C., Harries, T. J., Min, M., et al. 2009, A&A, 498, 967 [NASA ADS] [CrossRef] [EDP Sciences] [Google Scholar]
- Pontoppidan, K. M., Blake, G. A., & Smette, A. 2011, ApJ, 733, 84 [NASA ADS] [CrossRef] [Google Scholar]
- Rice, W. K. M., Armitage, P. J., Wood, K., & Lodato, G. 2006, MNRAS, 373, 1619 [NASA ADS] [CrossRef] [Google Scholar]
- Rosenfeld, K. A., Andrews, S. M., Hughes, A. M., Wilner, D. J., & Qi, C. 2013, ApJ, 774, 16 [NASA ADS] [CrossRef] [Google Scholar]
- Semenov, D., Pavlyuchenkov, Y., Henning, T., Wolf, S., & Launhardt, R. 2008, ApJ, 673, L195 [NASA ADS] [CrossRef] [Google Scholar]
- Quanz, S. P., Birkmann, S. M., Apai, D., Wolf, S., & Henning, T. 2012, A&A, 538, A92 [NASA ADS] [CrossRef] [EDP Sciences] [Google Scholar]
- Rapson, V. A., Kastner, J. H., Millar-Blanchaer, M. A., & Dong, R. 2015, ApJ, 815, L26 [NASA ADS] [CrossRef] [Google Scholar]
- Reffert, S., Bergmann, C., Quirrenbach, A., Trifonov, T., & Künstler, A. 2015, A&A, 574, A116 [NASA ADS] [CrossRef] [EDP Sciences] [Google Scholar]
- Rosenfeld, K. A., Chiang, E., & Andrews, S. M. 2014, ApJ, 782, 62 [NASA ADS] [CrossRef] [Google Scholar]
- Rosotti, G. P., Juhasz, A., Booth, R. A., & Clarke, C. J. 2016, MNRAS, 459, 2790 [NASA ADS] [CrossRef] [Google Scholar]
- Ruge, J. P., Flock, M., Wolf, S., et al. 2016, A&A, 590, A17 [NASA ADS] [CrossRef] [EDP Sciences] [Google Scholar]
- Sault, R. J., Teuben, P. J., & Wright, M. C. H. 1995, Astronomical Data Analysis Software and Systems IV, 77, 433 [Google Scholar]
- Tsukagoshi, T., Nomura, H., Muto, T., et al. 2016, ApJ, 829, L35 [NASA ADS] [CrossRef] [Google Scholar]
- Ubach, C. C. P. C. 2014, Ph.D. Thesis, Faculty of Science, Engineering and Technology, Swinburne University of Technology, Australia, http://hdl.handle.net/1959.3/380261 [Google Scholar]
- Ubach, C., Maddison, S. T., Wright, C. M., et al. 2012, MNRAS, 425, 3137 [NASA ADS] [CrossRef] [Google Scholar]
- van der Marel, N., van Dishoeck, E. F., Bruderer, S., Pérez, L., & Isella, A. 2015, A&A, 579, A106 [NASA ADS] [CrossRef] [EDP Sciences] [Google Scholar]
- van der Plas, G., van den Ancker, M. E., Acke, B., et al. 2009, A&A, 500, 1137 [NASA ADS] [CrossRef] [EDP Sciences] [Google Scholar]
- van der Plas, G., van den Ancker, M. E., Waters, L. B. F. M., & Dominik, C. 2015, A&A, 574, A75 [NASA ADS] [CrossRef] [EDP Sciences] [Google Scholar]
- van der Plas, G., Ménard, F., Ward-Duong, K., et al. 2016, ApJ, 819, 102 [NASA ADS] [CrossRef] [Google Scholar]
- van der Wiel, M. H. D., Naylor, D. A., Kamp, I., et al. 2014, MNRAS, 444, 3911 [NASA ADS] [CrossRef] [Google Scholar]
- van Leeuwen, F. 2007, A&A, 474, 653 [NASA ADS] [CrossRef] [EDP Sciences] [Google Scholar]
- Wagner, K., Apai, D., Kasper, M., & Robberto, M. 2015, ApJ, 813, L2 [NASA ADS] [CrossRef] [Google Scholar]
- Walsh, C., Juhász, A., Pinilla, P., et al. 2014, ApJ, 791, L6 [NASA ADS] [CrossRef] [Google Scholar]
- Walsh, C., Juhász, A., Meeus, G., et al. 2016, ApJ, 831, 200 [NASA ADS] [CrossRef] [Google Scholar]
- Williams, J. P., & Cieza, L. A. 2011, ARA&A, 49, 67 [NASA ADS] [CrossRef] [Google Scholar]
- Wilson, W. E., Ferris, R. H., Axtens, P., et al. 2011, MNRAS, 416, 832 [NASA ADS] [CrossRef] [Google Scholar]
- Winston, E., Cox, N. L. J., Prusti, T., et al. 2012, A&A, 545, A145 [NASA ADS] [CrossRef] [EDP Sciences] [Google Scholar]
- Wolf, S., & D’Angelo, G. 2005, ApJ, 619, 1114 [NASA ADS] [CrossRef] [Google Scholar]
- Wright, A. E., & Barlow, M. J. 1975, MNRAS, 170, 41 [NASA ADS] [CrossRef] [Google Scholar]
- Wright, C. M., Maddison, S. T., Wilner, D. J., et al. 2015, MNRAS, 453, 414 [NASA ADS] [CrossRef] [Google Scholar]
- Yen, H.-W., Liu, H. B., Gu, P.-G., et al. 2016, ApJ, 820, L25 [NASA ADS] [CrossRef] [Google Scholar]
- Zhang, K., Pontoppidan, K. M., Salyk, C., & Blake, G. A. 2013, ApJ, 766, 82 [NASA ADS] [CrossRef] [Google Scholar]
- Zhang, K., Blake, G. A., & Bergin, E. A. 2015, ApJ, 806, L7 [NASA ADS] [CrossRef] [Google Scholar]
- Zhang, K., Bergin, E. A., Blake, G. A., et al. 2016, ApJ, 818, L16 [NASA ADS] [CrossRef] [Google Scholar]
- Zhu, Z., Stone, J. M., Rafikov, R. R., & Bai, X.-n. 2014, ApJ, 785, 122 [NASA ADS] [CrossRef] [Google Scholar]
Appendix A: Complete channel maps for the 12CO J = 3–2 and HCO+J = 4–3 emission lines
We show a full set of the channel maps for the 12CO J = 3−2 (Fig. A.1) and HCO+ J = 4−3 (Fig. A.2) emission lines in this
appendix. The spectral resolution is 106 m s-1 per channel for the 12CO J = 3−2 emission and 103 m s-1 per channel for the HCO+ J = 4−3 emission.
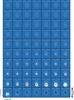 |
Fig. A.1 Channel maps showing the 12CO J = 3−2 spectral channels at 106 m s-1 resolution between +8 and −8 km s-1 around the systemic velocity. In the top right corner of each panel we note the vlsr in white with the velocity with respect to the systemic velocity of 4.75 km s-1 in parenthesis. The clean beam is shown in orange in the bottom left corner of each panel. The continuum contours are presented in white. |
 |
Fig. A.1 continued. |
 |
Fig. A.1 continued. |
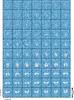 |
Fig. A.2 Channel maps showing the HCO+ J = 4−3 spectral channels at 103 m s-1 resolution between +6 and −6 km s-1 around the systemic velocity. In the top right corner of each panel we note the vlsr in white with the velocity with respect to the systemic velocity of 4.75 km s-1 in parenthesis. The clean beam is shown in orange in the bottom left corner of each panel. The continuum contours are plotted in white. |
 |
Fig. A.2 continued. |
All Tables
Continuum fluxes, major axis, axis ratio and position angle derived from fitting a disk (D, for the ALMA data) or a Gaussian or point source (G or P, for the ATCA data) to the visibilities.
Line fluxes, spectral resolution, and spatial extent for the CO J = 1−0, J = 3−2 and HCO+J = 4−3 lines.
Continuum fluxes for ISO ChaI-126 determined from fitting a Gaussian to the uv plane.
All Figures
|
Fig. 1 Images of HD 97048 for the ALMA band 7 (left panel) and band 3 (central panel) and the combined ATCA 33+35 GHz (right panel) observations, reconstructed using uniform (ALMA) and natural (ATCA) weighting. The intensity scale for all images is in units of Jy/beam. Overplotted in each panel are contours with 3, 15, 100, and 1100 times the rms value of 0.20, 0.18 and 0.010 mJy beam-1, respectively. The beam is shown in orange in the bottom left corner of each panel. |
| In the text | |
|
Fig. 2 Reconstructed images of HD 97048 for the ALMA band 7 data. The intensity scale for all images is in units of Jy beam-1. To highlight the small-scale structure we show (from left to right) images reconstructed with progressively smaller beams. Left panel: image reconstructed using superuniform weighting. Central panel: superuniformly weighted reconstructed image resulting from clipping all baselines below 160 kλ. Finally, right panel: MEM model image. The difference in dynamic range between the panels is due to flux loss incurred by clipping the shortest baselines for the central panel, and due to the smaller reconstructed beam for the right panel. |
| In the text | |
|
Fig. 3 Summary of 12CO J = 3−2 line emission in HD 97048. We show the integrated intensity (moment 0, left panel), intensity-weighted velocity (moment 1, second panel), peak intensity (moment 8, third panel) and the collapsed emission line (right panel). Each moment map was made using a 3σ cutoff and emission imaged using Briggs weighting. Overplotted in the three left panels are the same continuum contours as in the left panel of Fig. 1. The beam is shown in orange in the bottom left corner of each panel. In the right panel we show the spectrum mirrored at the systemic velocity with a gray line. The gray shaded area denotes the + and −3σ level calculated outside the line boundaries. |
| In the text | |
|
Fig. 4 Summary of HCO+ J = 4−3 line emission in HD 97048. We show the integrated intensity (moment 0, left panel), intensity-weighted velocity (moment 1, second panel), peak intensity (moment 8, third panel) and the collapsed emission line (right panel). Each moment map was made using a 3σ cutoff and emission imaged using Briggs weighting. Overplotted in the three left panels are the same continuum contours as in the left panel of Fig. 1, and the inset at the velocity map shows the inner 0.5′′ of the velocity map made using a 5σ cutoff. The beam is shown in orange in the bottom left corner of each panel. In the right panel we show the spectrum mirrored at the systemic velocity with a gray line. The gray shaded area denotes the + and −3σ level calculated outside the line boundaries. |
| In the text | |
|
Fig. 5 Summary of 12CO J = 1−0 line emission in HD 97048. We show the integrated intensity (moment 0, left panel), intensity-weighted velocity (moment 1, second panel), peak intensity (moment 8, third panel) and the collapsed emission line (right panel). Each moment map was made using a 3σ cutoff and emission imaged using Briggs weighting. Overplotted in the three left panels are the same continuum contours as in the central panel of Fig. 1. The beam is shown in orange in the bottom left corner of each panel. In the right panel we show the spectrum mirrored at the systemic velocity with a gray line. The gray shaded area denotes the + and −3σ level calculated outside the line boundaries. |
| In the text | |
|
Fig. 6 Selected channel maps showing the 12CO channels in color and the 3σ outline in purple, the HCO+ emission 3σ outline with black contours, and the continuum contours in white. In the top right corner of each panel we note the vlsr in white with the velocity with respect to the systemic velocity of 4.75 km s-1 in parenthesis. The clean beam is shown in orange in the bottom left corner of each panel. Note the foreground absorption for the CO emission in the leftmost panels, and the emission inside the disk gap in the rightmost panels. Complete channel maps are shown in Fig. A.1. |
| In the text | |
|
Fig. 7 ALMA Band 7 image reconstructed using superuniform weighting as described in Sect. 2.2, deprojected using the disk inclination and position angle listed in Table 2, bottom right panel, and converted into polar coordinates (top left panel). This map is collapsed along the radial and azimuthal axes to yield the azimuthal intensity distribution (top right) and the radial intensity distribution (bottom left). With an inset in this bottom left panel we zoom in between 0.3 and 2.6′′ with the normalized intensity plotted in log scale. We also overplot the three power-law fits discussed in Sect. 3, separated at 1.05 and 1.95′′. |
| In the text | |
|
Fig. 8 SED for HD 97048 (left panel) and ISO ChaI-126 (right panel). The error bars shown in both panels include a calibration uncertainty of 10% (ALMA), 20% (ATCA + Herschel) and 30% (SEST). Left panel: compilation of all points beyond 850 μm including literature data from SEST (red, Henning et al. 1993, 1998), ALMA (black) and ATCA (orange) data presented in this paper. Overplotted with gray lines are linear least-squares fits to parts of the SED between 1 and 10 mm and between 10 mm and 5.45 cm. The latter fit was made using fluxes corrected with extrapolated fluxes from the 1−10 mm fit. These corrected fluxes are shown with small gray dots. Right panel: compilation of all points beyond 70 μm including literature data from Herschel (blue, Winston et al. 2012), ALMA (black) and ATCA (orange) data presented in this paper. Overplotted with gray lines is a linear least-squares fit to all data points. |
| In the text | |
|
Fig. 9 34 GHz emission from the ISO-Cha1 126 binary system resolved with ATCA. Overplotted with black contours we show 5 and 7.5 times the rms of 0.010 mJy beam-1, the beam is shown in yellow in the bottom left corner. The white plus signs denote the J2000 coordinates of the A and B components corrected for the proper motion of HD 97048. |
| In the text | |
|
Fig. 10 Comparison of ALMA band 7 data (left panel) with the ring model image degraded to the resolution of our data (second panel). Third panel: residuals of the observations minus the model with the inner and outer radius of the model disk at 43.5 and 280 AU shown with green ellipses. Red and blue contours at ±0.2 mJy highlight the extent of the outer disk in the residual image. Units of all intensity scales are in Jy/beam. Right panel: real part of the visibilities as function of the deprojected baseline for the data (top panel, black dots) and the model (red line). Bottom panel: residuals. The visibilities are binned to have a constant amount of baselines per bin. Error bars are mostly smaller than the plot symbol size and are shown with blue vertical lines |
| In the text | |
|
Fig. 11 Visibilities of the ATCA 33+35 GHz (circles) and 38+40 GHz (diamonds) observations deprojected using the disk inclination and position angle determined using the ALMA band 7 observations as listed in Table 2, and their 1σ error values shown in blue. We also show a version of our best-fit MCFOST ring model scaled to the 34 GHZ flux with a gray line and the ATCA visibilities after subtracting a 0.2 mJy point source at the stellar position for the 33+35 GHz observations and a 0.15 mJy point source at the stellar position for the best part of the 38+40 GHz observations, both with gray symbols. |
| In the text | |
|
Fig. A.1 Channel maps showing the 12CO J = 3−2 spectral channels at 106 m s-1 resolution between +8 and −8 km s-1 around the systemic velocity. In the top right corner of each panel we note the vlsr in white with the velocity with respect to the systemic velocity of 4.75 km s-1 in parenthesis. The clean beam is shown in orange in the bottom left corner of each panel. The continuum contours are presented in white. |
| In the text | |
|
Fig. A.1 continued. |
| In the text | |
|
Fig. A.1 continued. |
| In the text | |
|
Fig. A.2 Channel maps showing the HCO+ J = 4−3 spectral channels at 103 m s-1 resolution between +6 and −6 km s-1 around the systemic velocity. In the top right corner of each panel we note the vlsr in white with the velocity with respect to the systemic velocity of 4.75 km s-1 in parenthesis. The clean beam is shown in orange in the bottom left corner of each panel. The continuum contours are plotted in white. |
| In the text | |
|
Fig. A.2 continued. |
| In the text | |
Current usage metrics show cumulative count of Article Views (full-text article views including HTML views, PDF and ePub downloads, according to the available data) and Abstracts Views on Vision4Press platform.
Data correspond to usage on the plateform after 2015. The current usage metrics is available 48-96 hours after online publication and is updated daily on week days.
Initial download of the metrics may take a while.