Fig. 2
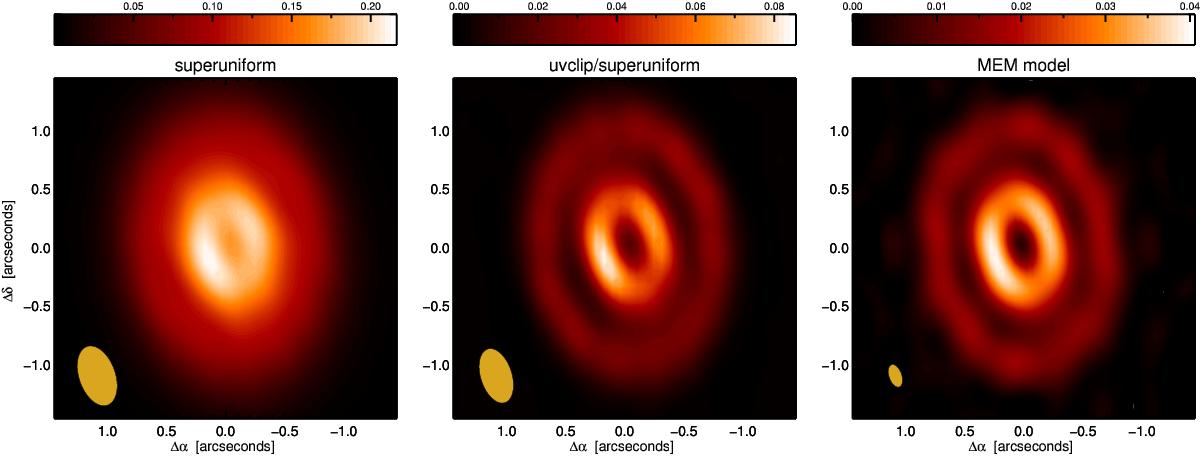
Reconstructed images of HD 97048 for the ALMA band 7 data. The intensity scale for all images is in units of Jy beam-1. To highlight the small-scale structure we show (from left to right) images reconstructed with progressively smaller beams. Left panel: image reconstructed using superuniform weighting. Central panel: superuniformly weighted reconstructed image resulting from clipping all baselines below 160 kλ. Finally, right panel: MEM model image. The difference in dynamic range between the panels is due to flux loss incurred by clipping the shortest baselines for the central panel, and due to the smaller reconstructed beam for the right panel.
Current usage metrics show cumulative count of Article Views (full-text article views including HTML views, PDF and ePub downloads, according to the available data) and Abstracts Views on Vision4Press platform.
Data correspond to usage on the plateform after 2015. The current usage metrics is available 48-96 hours after online publication and is updated daily on week days.
Initial download of the metrics may take a while.