Fig. 8
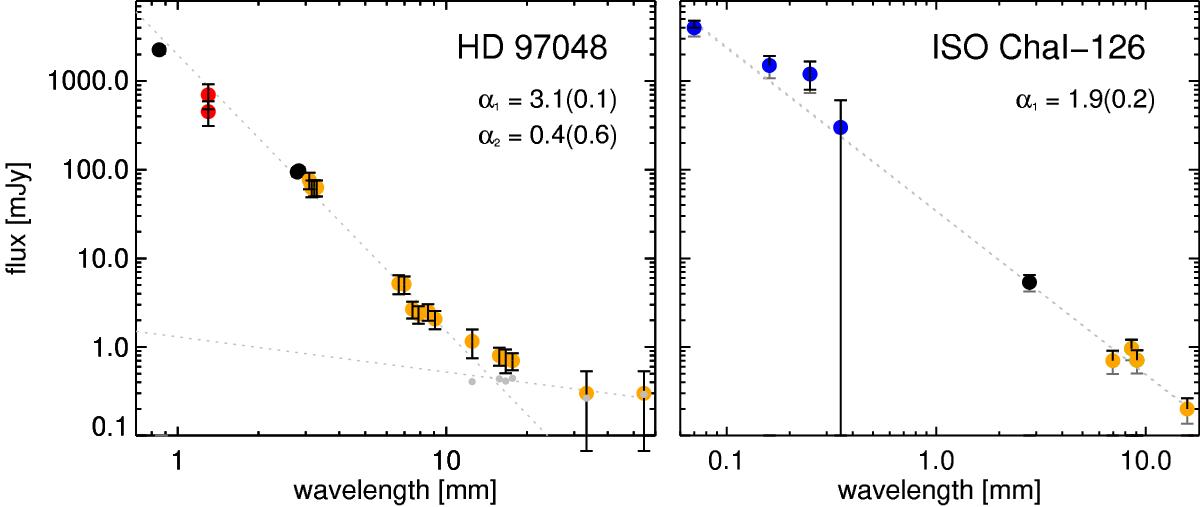
SED for HD 97048 (left panel) and ISO ChaI-126 (right panel). The error bars shown in both panels include a calibration uncertainty of 10% (ALMA), 20% (ATCA + Herschel) and 30% (SEST). Left panel: compilation of all points beyond 850 μm including literature data from SEST (red, Henning et al. 1993, 1998), ALMA (black) and ATCA (orange) data presented in this paper. Overplotted with gray lines are linear least-squares fits to parts of the SED between 1 and 10 mm and between 10 mm and 5.45 cm. The latter fit was made using fluxes corrected with extrapolated fluxes from the 1−10 mm fit. These corrected fluxes are shown with small gray dots. Right panel: compilation of all points beyond 70 μm including literature data from Herschel (blue, Winston et al. 2012), ALMA (black) and ATCA (orange) data presented in this paper. Overplotted with gray lines is a linear least-squares fit to all data points.
Current usage metrics show cumulative count of Article Views (full-text article views including HTML views, PDF and ePub downloads, according to the available data) and Abstracts Views on Vision4Press platform.
Data correspond to usage on the plateform after 2015. The current usage metrics is available 48-96 hours after online publication and is updated daily on week days.
Initial download of the metrics may take a while.