Fig. 6
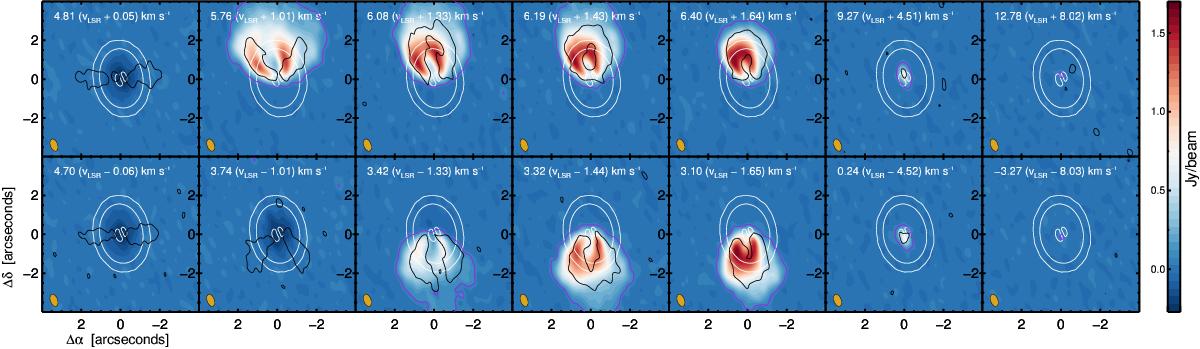
Selected channel maps showing the 12CO channels in color and the 3σ outline in purple, the HCO+ emission 3σ outline with black contours, and the continuum contours in white. In the top right corner of each panel we note the vlsr in white with the velocity with respect to the systemic velocity of 4.75 km s-1 in parenthesis. The clean beam is shown in orange in the bottom left corner of each panel. Note the foreground absorption for the CO emission in the leftmost panels, and the emission inside the disk gap in the rightmost panels. Complete channel maps are shown in Fig. A.1.
Current usage metrics show cumulative count of Article Views (full-text article views including HTML views, PDF and ePub downloads, according to the available data) and Abstracts Views on Vision4Press platform.
Data correspond to usage on the plateform after 2015. The current usage metrics is available 48-96 hours after online publication and is updated daily on week days.
Initial download of the metrics may take a while.