Fig. A.2
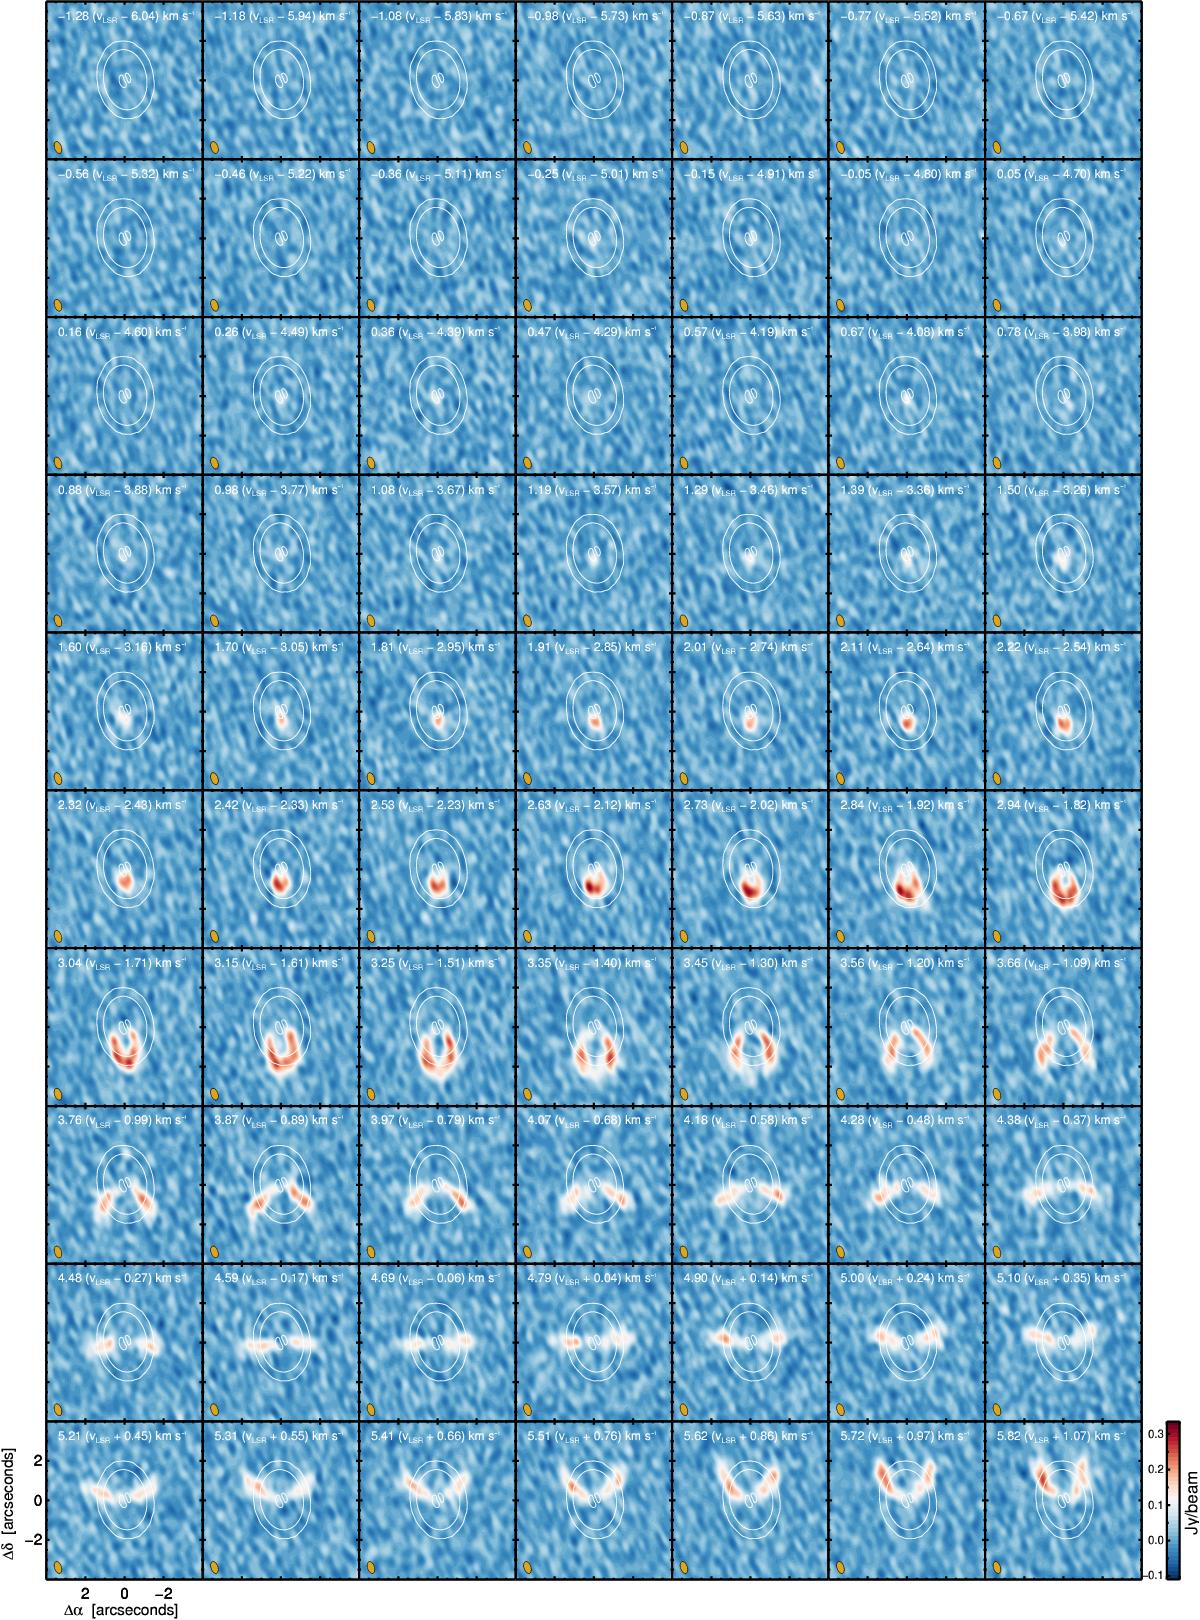
Channel maps showing the HCO+ J = 4−3 spectral channels at 103 m s-1 resolution between +6 and −6 km s-1 around the systemic velocity. In the top right corner of each panel we note the vlsr in white with the velocity with respect to the systemic velocity of 4.75 km s-1 in parenthesis. The clean beam is shown in orange in the bottom left corner of each panel. The continuum contours are plotted in white.
Current usage metrics show cumulative count of Article Views (full-text article views including HTML views, PDF and ePub downloads, according to the available data) and Abstracts Views on Vision4Press platform.
Data correspond to usage on the plateform after 2015. The current usage metrics is available 48-96 hours after online publication and is updated daily on week days.
Initial download of the metrics may take a while.