Fig. 1
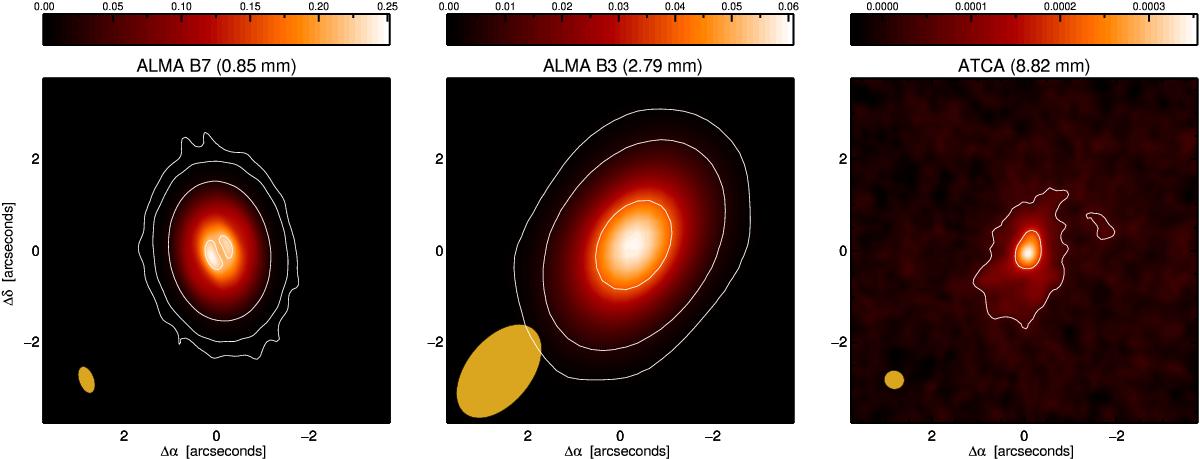
Images of HD 97048 for the ALMA band 7 (left panel) and band 3 (central panel) and the combined ATCA 33+35 GHz (right panel) observations, reconstructed using uniform (ALMA) and natural (ATCA) weighting. The intensity scale for all images is in units of Jy/beam. Overplotted in each panel are contours with 3, 15, 100, and 1100 times the rms value of 0.20, 0.18 and 0.010 mJy beam-1, respectively. The beam is shown in orange in the bottom left corner of each panel.
Current usage metrics show cumulative count of Article Views (full-text article views including HTML views, PDF and ePub downloads, according to the available data) and Abstracts Views on Vision4Press platform.
Data correspond to usage on the plateform after 2015. The current usage metrics is available 48-96 hours after online publication and is updated daily on week days.
Initial download of the metrics may take a while.