Fig. 11
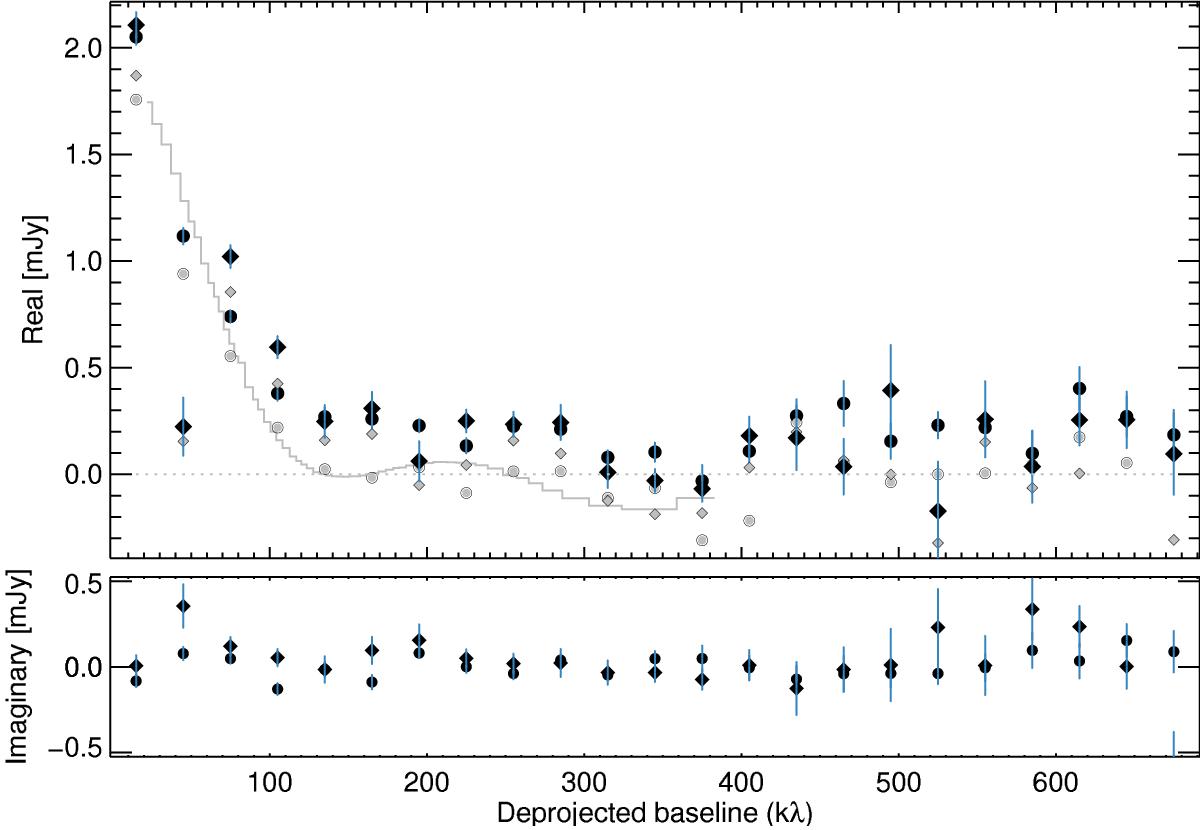
Visibilities of the ATCA 33+35 GHz (circles) and 38+40 GHz (diamonds) observations deprojected using the disk inclination and position angle determined using the ALMA band 7 observations as listed in Table 2, and their 1σ error values shown in blue. We also show a version of our best-fit MCFOST ring model scaled to the 34 GHZ flux with a gray line and the ATCA visibilities after subtracting a 0.2 mJy point source at the stellar position for the 33+35 GHz observations and a 0.15 mJy point source at the stellar position for the best part of the 38+40 GHz observations, both with gray symbols.
Current usage metrics show cumulative count of Article Views (full-text article views including HTML views, PDF and ePub downloads, according to the available data) and Abstracts Views on Vision4Press platform.
Data correspond to usage on the plateform after 2015. The current usage metrics is available 48-96 hours after online publication and is updated daily on week days.
Initial download of the metrics may take a while.