Fig. 10
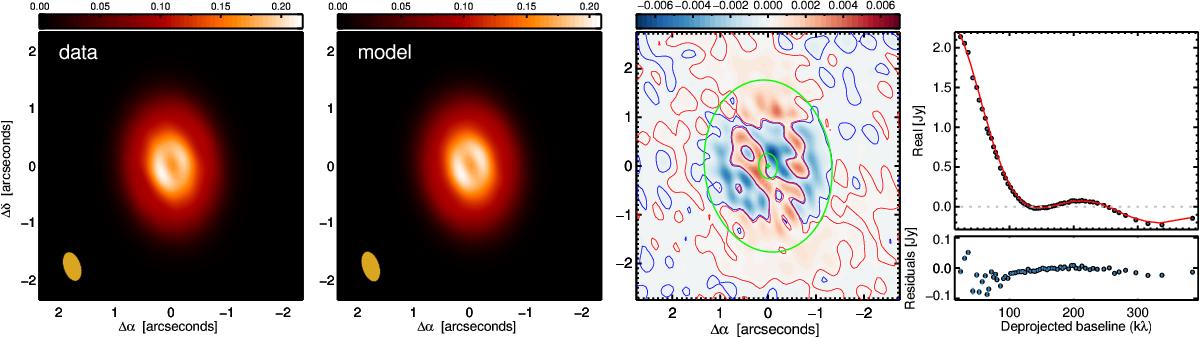
Comparison of ALMA band 7 data (left panel) with the ring model image degraded to the resolution of our data (second panel). Third panel: residuals of the observations minus the model with the inner and outer radius of the model disk at 43.5 and 280 AU shown with green ellipses. Red and blue contours at ±0.2 mJy highlight the extent of the outer disk in the residual image. Units of all intensity scales are in Jy/beam. Right panel: real part of the visibilities as function of the deprojected baseline for the data (top panel, black dots) and the model (red line). Bottom panel: residuals. The visibilities are binned to have a constant amount of baselines per bin. Error bars are mostly smaller than the plot symbol size and are shown with blue vertical lines
Current usage metrics show cumulative count of Article Views (full-text article views including HTML views, PDF and ePub downloads, according to the available data) and Abstracts Views on Vision4Press platform.
Data correspond to usage on the plateform after 2015. The current usage metrics is available 48-96 hours after online publication and is updated daily on week days.
Initial download of the metrics may take a while.