Fig. 7
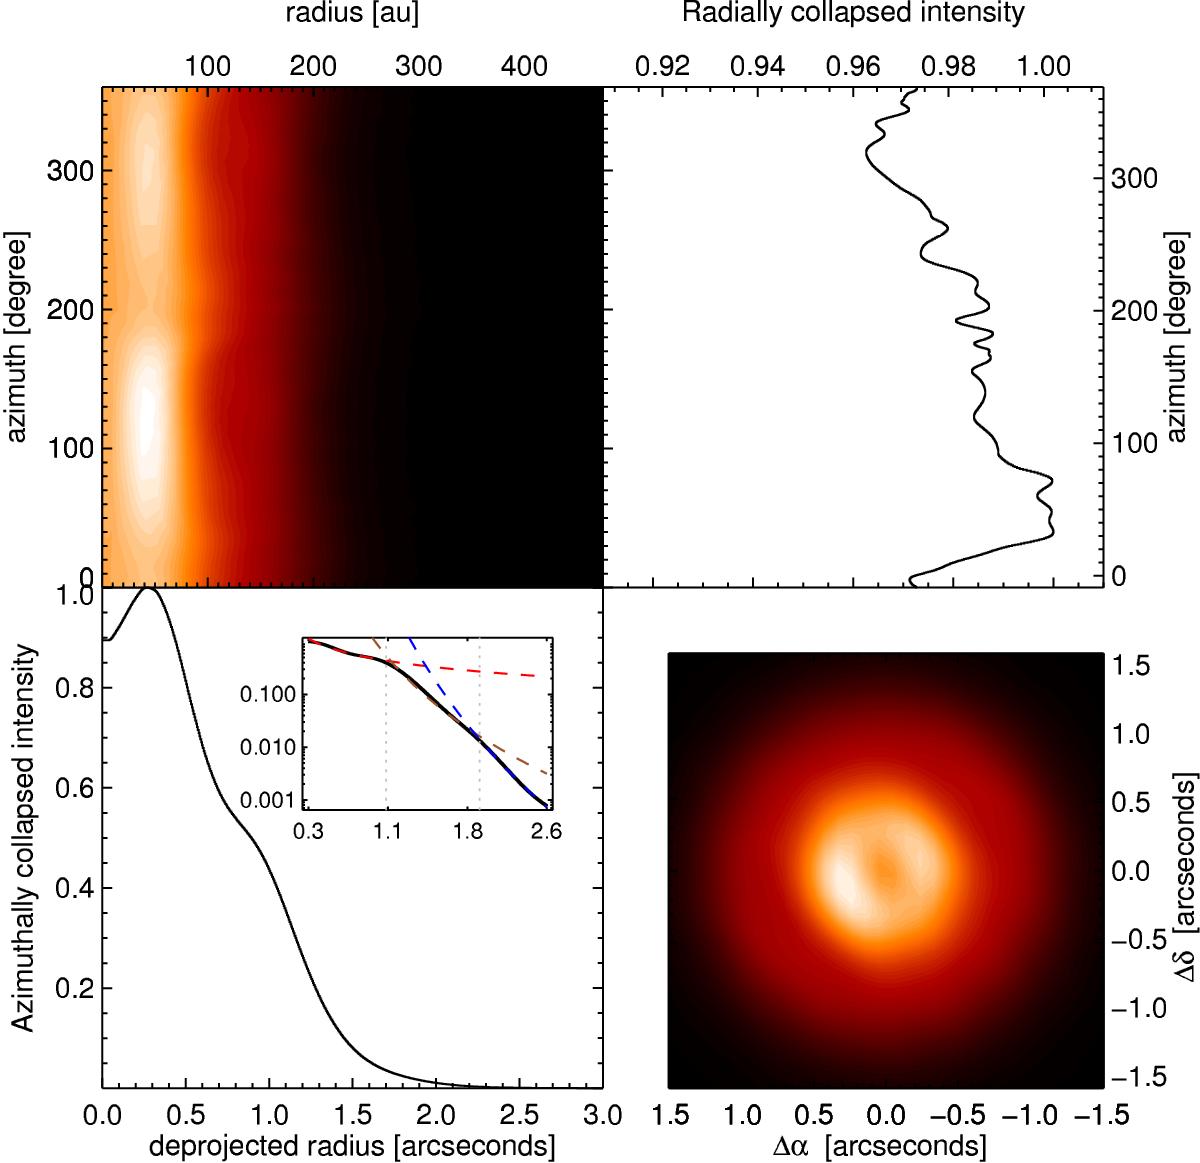
ALMA Band 7 image reconstructed using superuniform weighting as described in Sect. 2.2, deprojected using the disk inclination and position angle listed in Table 2, bottom right panel, and converted into polar coordinates (top left panel). This map is collapsed along the radial and azimuthal axes to yield the azimuthal intensity distribution (top right) and the radial intensity distribution (bottom left). With an inset in this bottom left panel we zoom in between 0.3 and 2.6′′ with the normalized intensity plotted in log scale. We also overplot the three power-law fits discussed in Sect. 3, separated at 1.05 and 1.95′′.
Current usage metrics show cumulative count of Article Views (full-text article views including HTML views, PDF and ePub downloads, according to the available data) and Abstracts Views on Vision4Press platform.
Data correspond to usage on the plateform after 2015. The current usage metrics is available 48-96 hours after online publication and is updated daily on week days.
Initial download of the metrics may take a while.