Fig. 4
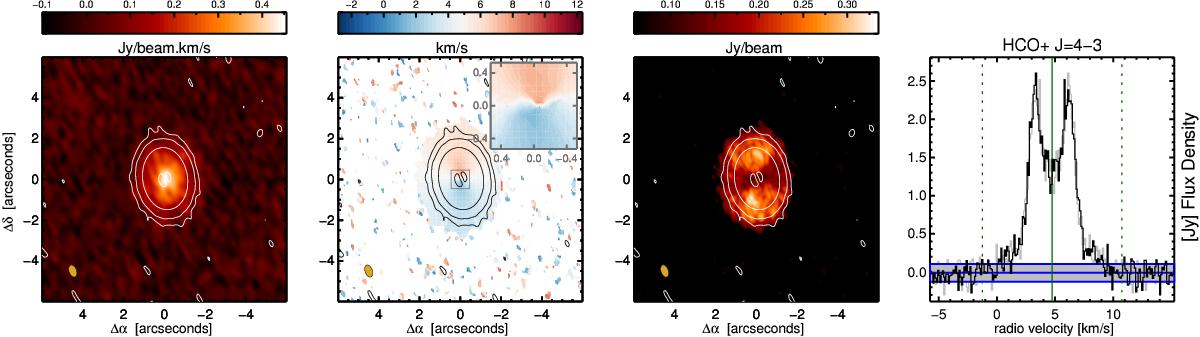
Summary of HCO+ J = 4−3 line emission in HD 97048. We show the integrated intensity (moment 0, left panel), intensity-weighted velocity (moment 1, second panel), peak intensity (moment 8, third panel) and the collapsed emission line (right panel). Each moment map was made using a 3σ cutoff and emission imaged using Briggs weighting. Overplotted in the three left panels are the same continuum contours as in the left panel of Fig. 1, and the inset at the velocity map shows the inner 0.5′′ of the velocity map made using a 5σ cutoff. The beam is shown in orange in the bottom left corner of each panel. In the right panel we show the spectrum mirrored at the systemic velocity with a gray line. The gray shaded area denotes the + and −3σ level calculated outside the line boundaries.
Current usage metrics show cumulative count of Article Views (full-text article views including HTML views, PDF and ePub downloads, according to the available data) and Abstracts Views on Vision4Press platform.
Data correspond to usage on the plateform after 2015. The current usage metrics is available 48-96 hours after online publication and is updated daily on week days.
Initial download of the metrics may take a while.