| Issue |
A&A
Volume 699, July 2025
|
|
|---|---|---|
| Article Number | A382 | |
| Number of page(s) | 15 | |
| Section | Interstellar and circumstellar matter | |
| DOI | https://doi.org/10.1051/0004-6361/202554755 | |
| Published online | 23 July 2025 | |
FAUST
XXV. A potential new molecular outflow in [BHB2007] 11
1
Centro de Astrobiología (CAB), INTA-CSIC,
Carretera de Ajalvir km 4, Torrejón de Ardoz,
28850,
Madrid,
Spain
2
Escuela de Doctorado, Universidad Autónoma de Madrid,
28049
Cantoblanco, Madrid,
Spain
3
IRAP, Université de Toulouse, CNRS, CNES, UPS,
Toulouse,
France
4
Graduate School of Informatics and Engineering, The University of Electro-Communications, Chofu,
Tokyo
182-8585,
Japan
5
School of Physics and Astronomy, University of Leeds,
Leeds
LS2 9JT,
UK
6
Center for Astrochemical Studies, Max-Planck-Institut für Extraterrestrische Physik,
Gießenbachstraße 1,
85748
Garching,
Germany
7
INAF – Osservatorio Astrofisico di Arcetri,
Largo E. Fermi 5,
50125,
Florence,
Italy
8
National Radio Astronomy Observatory,
PO Box O,
Socorro,
NM
87801,
USA
9
European Southern Observatory,
Karl-Schwarzschild-Strasse 2
85748
Garching bei Munchen,
Germany
10
Department of Astronomy, The University of Tokyo,
7-3-1 Hongo, Bunkyoku,
Tokyo
113-0033,
Japan
11
IRAM,
300 rue de la Piscine,
38406
Saint-Martin d’Hères,
France
12
Leiden Observatory, Leiden University,
PO Box 9513,
23000
RA
Leiden,
The Netherlands
13
Univ. Grenoble Alpes, CNRS, IPAG,
38000
Grenoble,
France
14
Center for Frontier Science, Chiba University,
1-33 Yayoi-cho, Inage-ku,
Chiba
263-8522,
Japan
15
NRC Herzberg Astronomy and Astrophysics,
5071 West Saanich Road,
Victoria,
BC
V9E 2E7,
Canada
16
Department of Physics and Astronomy, University of Victoria,
Victoria,
BC
V8P 5C2,
Canada
17
Instituto de Radioastronomía y Astrofísica, Universidad Nacional Autonóma de México,
Apartado Postal 3-72, Morelia
58090
Michoacán,
Mexico
18
Black Hole Initiative at Harvard University,
20 Garden Street,
Cambridge,
MA
02138,
USA
19
David Rockefeller Center for Latin American Studies, Harvard University,
1730 Cambridge Street,
Cambridge,
MA
02138,
USA
20
National Astronomical Observatory of Japan,
Osawa 2-21-1, Mitaka-shi,
Tokyo
181-8588,
Japan
21
RIKEN Cluster for Pioneering Research,
2-1, Hirosawa, Wako-shi,
Saitama
351-0198,
Japan
22
SOKENDAI,
Shonan Village, Hayama,
Kanagawa
240-0193,
Japan
★ Corresponding author.
Received:
25
March
2025
Accepted:
17
May
2025
Abstract
Context. During the early stages of star formation, accretion processes such as infall from the envelope and molecular streamers and ejection of matter through winds and jets take place simultaneously and distribute the angular momentum of the parent molecular cloud. The Class 0/I binary [BHB2007] 11 shows evidence for accretion and ejection at the scales of the circumbinary disk and the inner close binary. Recent observations of H2CO, however, have shown two elongated structures with indications of outflowing motion almost perpendicular to the main CO outflow, which is launched from the circumbinary disk.
Aims. We study the kinematics of the molecular gas at intermediate scales of ~50–3000 au around [BHB2007] 11 to verify the nature of these elongated structures.
Methods. We analyzed the line emission of H13CO+, CCH, c-C3H2, and SiO observed with the Atacama Large Millimeter/submillimeter Array (ALMA) within the large program called Fifty AU STudy of the chemistry in the disc/envelope system of Solar-like protostars (FAUST). These molecules trace the material that moves at velocities close to that of the ambient cloud, which could not be probed in previous observations of the self-absorbed emission of CO.
Results. The images of H13CO+, CCH, and c-C3H2 show clear elongated structures similar to those previously detected in H2CO, whose gas kinematics are consistent with outflowing motions and with rotation in the opposite sense to the main CO outflow. The derived mass-loss rate from these large-scale structures is (1.7 ± 0.5) × 10−6 M⊙ yr−1, which agrees with the rates measured in outflows driven by Class 0/I protostars. The SiO image reveals compact emission close to the binary system, with a slight elongation that is aligned with the larger-scale structures. This suggests that SiO is released from the sputtering of dust grains in the shocked material at the base of the potential new outflow, with a relative abundance of ≥(0.11–2.0) × 10−9. However, higher angular and spectral resolution observations are needed to accurately estimate the outflow-launching radius and its powering source. Based on the location and the abundance of the SiO emission, we propose that the second outflow may be launched from inside the circumbinary disk, likely by the less massive companion that actively accretes material from its surroundings.
Key words: astrochemistry / techniques: high angular resolution / stars: formation / ISM: jets and outflows / ISM: molecules
© The Authors 2025
 Open Access article, published by EDP Sciences, under the terms of the Creative Commons Attribution License (https://creativecommons.org/licenses/by/4.0), which permits unrestricted use, distribution, and reproduction in any medium, provided the original work is properly cited.
This article is published in open access under the Subscribe to Open model. This email address is being protected from spambots. You need JavaScript enabled to view it. to support open access publication.
1 Introduction
Star formation starts with the gravitational collapse of a molecular cloud (Shu 1977). Because angular momentum is conserved, the infalling envelope of material eventually flattens and gives rise to a circumstellar disk of gas and dust (Terebey et al. 1984). The disk rotates around the central protostar, whose mass grows as it accretes material from the circumstellar disk. These accretion processes are facilitated by the removal of angular momentum from the disk through the launching of winds and jets (e.g. Frank et al. 2014). In recent years, observational effort was focused on determining the mechanism that regulates these ejection processes by studying their kinematics (e.g. Ray & Ferreira 2021). At the same time, accretion onto the protostar has been observed to occur through the infall of the rotating, flattened envelope that provides material to the accretion disk through a centrifugal barrier (e.g. Sakai et al. 2014; Oya et al. 2016) and, more recently, through dense filamentary streamers that funnel material from the surroundings of the protostar (see e.g. the recent review by Pineda et al. 2023). It is still unclear to date how these accretion and ejection processes interact and how the angular momentum of the system is distributed during the early stages of star formation.
Most stars are found in binary systems. During their early formation and evolution, each member of the binary hosts its own circumstellar disk and outflow (e.g. Offner et al. 2023). Circumbinary disks surrounding the central sources may be present as well: They are observed to be more frequent for binary separations smaller than ~10–20 au (Czekala et al. 2019). Some notable examples are found at the Class 0/I stage of a protostar, such as VLA1623AB (e.g. Hara et al. 2021; Ohashi et al. 2022; Codella et al. 2024), L1551 IRS 5 (e.g. Rodríguez et al. 2003; Bianchi et al. 2020), IRAS 16293–2422 A (e.g. Maureira et al. 2020), and [BHB2007] 11 (Alves et al. 2017, 2019). These complex dynamical systems are ideal targets for studying the kinematics of the gas components that are involved in the formation of typical stars, and yield a powerful tool for addressing open questions such as the wind- and jet-launching mechanism or the relative alignment of circumstellar and circumbinary disks.
In particular, [BHB2007] 11 represents an excellent laboratory because it showed the first evidence for outflows that were driven by a circumbinary disk (Alves et al. 2017). Also known as B59#11, it is a Class 0/I protostellar object located at a distance of 163 ± 5 pc (Dzib et al. 2018). With an age of 0.1–0.2 Myr and a bolometric luminosity of 2.2–4.5 L⊙ (Brooke et al. 2007; Forbrich et al. 2009; Sandell et al. 2021), it is the youngest member of a cluster of at least 20 low-mass young stellar objects in the Barnard 59 (B59) core. Observations with the Atacama Large Millimeter/submillimeter Array (ALMA) at 1.3 mm with a spatial resolution of ~36 au revealed a circumbinary disk embedded within a flattened envelope that spans ~435 au, where both structures were found to rotate in Keplerian motion (Alves et al. 2017). The CO (2–1) emission revealed an outflow in the NE-SW direction that was observed to originate from the circumbinary disk at a launching radius of ~90–130 au from the central system. This radius coincides with the centrifugal barrier and with the tip of spiral structures seen in thermal dust emission associated with the accretion from the surrounding flattened envelope. The infall of matter at the centrifugal barrier drags the magnetic field lines and pinches their opening angle, allowing the magneto-centrifugal launching of the outflow from the circumbinary disk (Alves et al. 2017). Alves et al. (2018) presented Very Large Array (VLA) data at 34.5 GHz obtained in its most extended configuration that resolved the two members of the system in the inner part of the circumbinary disk, [BHB2007] 11A (α(2000) = 17h11m23.1058s, δ(2000) = −27°24′32.828″) and [BHB2007] 11B (α(2000) = 17h11m23.1015s, δ(2000) = −27°24′32.987″). Subsequent ALMA observations at 1.3 mm with an angular resolution of ~6 au (Alves et al. 2019) imaged the circumstellar disks of the two members of the system with a projected separation of ~28 au, and they unveiled filamentary spiral features with an extent of ~100 au that connected the close binary to the circumbinary disk. In a reanalysis of the CO (2–1) data from Alves et al. (2017), the authors obtained the centroid positions of the high-velocity wings. The line emission was found to be situated at scales of the inner circumbinary disk in the surroundings of source B, with an acceleration motion toward the protostar. This was interpreted as evidence of accreting material from the circumbinary disk to the two circumstellar disks through the spiral filaments, which act as streamers.
[BHB2007] 11 has recently been reimaged with ALMA as part of the sample studied within the ALMA Large Program FAUST (Fifty AU STudy of the chemistry in the disc/envelope system of Solar-like protostars, Codella et al. 2021). These observations have already provided additional insight into this system: Vastel et al. (2022) and Vastel et al. (2024) have reported compact emission from complex organic molecules (e.g., methanol, methyl formate, and dimethyl ether) in the inner circumbinary disk and surrounding source B, which may be related to shocked gas from the filamentary structures surrounding both cores. Still, further observations are needed to address the effect of very optically thick dust emission from the two sources (see De Simone et al. 2020) and to confirm the origin of the emission from accretion shocks. Evans et al. (2023) studied the deuteration ratio of H2CO in this system and found that the deuterated species are located in the central regions of the core. This work also reported two elongated H2CO structures detected at large scales outside the circumbinary disk in the SE-NW direction. These structures were detected at velocities of ±1 km s−1 from the systemic velocity of the cloud vsys ~3.6 km s−1 (Hara et al. 2013), and they are aligned almost perpendicular to the main CO outflow reported by Alves et al. (2017) using the CO (2–1) transition. The kinematic analysis of these gas structures suggested that they were not infalling streamers because they could not be fit by streamline-generating models (Evans et al. 2023), which predict increasing velocities toward the central protostar (Pineda et al. 2020). Instead, the kinematics of the blueshifted H2CO emission are consistent with gas that is accelerated radially outward, mimicking the kinematics of an outflow. The redshifted emission presented a flat velocity structure that complicated the interpretation of the origin of the H2CO emission.
In this work, we analyze FAUST observations of the large-scale molecular emission from [BHB2007] 11 in search for more information on the nature of the recently discovered H2CO elongated structures, which may be associated with a potential second outflow in the [BHB2007] 11 system. We also revisit ALMA archival observations of CO (3–2) and compare them with the FAUST data. Our analysis of the FAUST images of H13CO+, CCH and c-C3H2 reveals the elongated structures and the outflowing motions, in agreement with the outflow origin of this emission. The FAUST images also detect compact, faint, and slightly elongated SiO emission associated with the inner binary system, whose alignment coincides with that observed for H13CO+, CCH, and c-C3H2, and that likely arises from shocked material at the base of the second outflow.
2 Observations and data reduction
[BHB2007] 11 was observed with ALMA under the FAUST Large Program (project code 2018.1.01205.L) between 2018 and 2020. Observations, data reduction, and imaging are described in detail in previous FAUST papers on the source (Vastel et al. 2022; Evans et al. 2023; Vastel et al. 2024). The observations were centered at α(2000)=17h11m23.125s, δ(2000)=−27°24′32.87″. The spectral setup consisted of two frequency setups (setups 1 and 2) in Band 6 and one setup (setup 3) in Band 3. The molecular line transitions studied in this work were covered in setups 1 and 2 with a spectral channel width of 122.07 kHz (equivalent to a velocity resolution of 0.14 km s−1). Observations for the two relevant setups were performed with the 12 m and 7 m antennas, with baseline lengths from 15 m to 1.3 km for the 12 m array and from 8.9 m to 48.9 m for the 7 m array. The calibration and imaging of the data was performed with CASA using a modified version of the pipeline developed by the FAUST data reduction team1. The resulting beam size after applying Briggs weighting with a robust parameter of 0.5 is ~0.42″ across the two setups. The images were corrected for the primary beam response. In addition to the line cubes obtained under the FAUST program, we retrieved the CO (3–2) line cube from the ALMA archive (project 2019.1.01566.S). The imaging of these visibilities was made by the ALMA pipeline with a Briggs parameter of 0.5 and primary beam correction. The cube has a spectral resolution of 0.24 MHz (equivalent to ~0.11 km s−1) and a synthesized beam size of 0.11″.
3 Results
3.1 Morphology of the emission
3.1.1 Large-scale structures
Figure 1 shows the integrated-intensity (moment 0) maps of H13CO+ (J=3–2, F1=5/2–3/2, F=2–1, Eu = 24.98 K) at 260.255 GHz (upper panels), CCH (N=3–2, J=7/2–5/2, F=4–3, Eu = 25.15 K) at 262.004 GHz (middle panels), and c-C3H2 (6(0,6)−5(1,5), Eu = 38.61 K) at 217.822 GHz (bottom panels) for the redshifted (left panels) and blueshifted (right) velocities with respect to the systemic velocity of the source (vsys ~ 3.6 km s−1). The velocity ranges in the figure were selected after inspecting the data cubes channel per channel to obtain the clearest view of the structures. Overlaid on the molecular emission, we show the 1.3 mm continuum emission (white contours, Alves et al. 2017) and moment 0 maps of CO (3–2) (black contours).
The continuum traces the inner envelope of radius ~435 au with a position angle (PA) of 167° (Alves et al. 2017). The contours of the CO (3–2) integrated emission between −2.0 and 9.2 km s−1 show the biconical NE-SW outflow identified in CO (2–1) by Alves et al. (2017). To obtain the PA of the CO (3–2) outflow axis, we performed a linear fit of the outermost contours that delineate the outflow in Fig. 1. The NE lobe has a PA of 58 ± 1°, and the SW lobe has a PA of 238 ± 2°. Hence, we derived a CO outflow axis of 58 ± 2°, which is almost perpendicular to the orientation of the continuum. The SW lobe of the outflow is redshifted between 5.4 and 12.5 km s−1 before it shows significant absorption, and it also shows blueshifted emission between −4.0 and 1.6 km s−1 over the same region. The NE lobe shows redshifted emission in its southern part between 5.4 and 16 km s−1 and blueshifted emission in the northern half between −10 and 1.6 km s−1. The morphology of the CO (3–2) emission is similar to that of the CO (2–1) presented by Alves et al. (2017), who associated the redshifted emission of the NE lobe with a weaker component of the outflow. The fact that both lobes of the CO outflow show blueshifted and redshifted emission suggests that the outflow orientation is close to the plane of the sky (Alves et al. 2017). The north-south velocity gradient of the NE lobe was interpreted as outflow rotation from the CO (2–1) observations of Hara et al. (2013) with the Submillimeter Array (SMA), while the SW lobe only showed redshifted emission in their images. At velocities ±2 km s−1 from the systemic velocity of ~3.6 km s−1, the CO (3–2) emission is largely self-absorbed, which prevents us from studying the morphology of the gas with this line at low velocities. This is also the case for the CO (2–1) emission from Alves et al. (2017).
In contrast, H13CO+, CCH, and c-C3H2 present marginal or no self-absorption at velocities close to the systemic velocity of the source. This enabled us to explore the morphology and kinematics of the gas in a velocity range that has not been explored before with CO. The integrated emission of H13CO+ shows two distinct components, with different kinematics and spatial distributions. The inner ~10″, marked in the left panels of Fig. 1 with the dashed ellipse, correspond to the emission from the extended rotating envelope. The PA of this structure is aligned with the PA of the continuum and shows the rotation pattern of the envelope: redshifted in the south, and blueshifted in the north (Alves et al. 2017). At larger distances, however, we find two elongated structures toward the SE and the NW, similar to those identified by Evans et al. (2023) in H2CO. We indicate with an arrow the transition region between the envelope and the elongated structure in the left panels of Fig. 1. The redshifted CCH emission in the inner ~10″ also shows the rotation of the envelope. The blueshifted emission appears in the northern part of the rotating envelope, while we also find some blueshifted emission in the south. This southern emission arises from the more redshifted part of the adjacent CCH transition (N=3–2, J=7/2–5/2, F=3–2) at 262.006 GHz due to its hyperfine structure, which is separated ~2.2 MHz (i.e., ~2.5 km s−1) from the line that we used. The two lines are slightly blended at their highest velocities, but the residual emission from the F=3–2 transition does not affect our analysis of the F=4–3 transition at velocities very close to the systemic velocity. We also find emission from this molecule in the base of the SW lobe of the CO (3–2) outflow at redshifted velocities, as well as for the blueshifted emission in the NE lobe. Therefore, CCH may also trace the cavity walls from the primary CO outflow. Last, the lower panels show the integrated emission from c-C3H2, which can trace regions illuminated by UV radiation, such as photodissociation regions (PDRs; Pety et al. 2005), the envelope of warm carbon-chain chemistry sources (Sakai & Yamamoto 2013), and outflow cavity walls (e.g. Murillo et al. 2018; Tychoniec et al. 2021). The c-C3H2 emission is mainly seen in the elongated structures, beyond the transition region, where the rotating envelope is seen in the other molecular tracers. As in the case of CCH, faint emission is found at the base of the CO (3–2) outflow, suggesting that this molecule also traces its cavity walls. Based on the morphology of the integrated emission of the three tracers, we defined two regions (colored polygons in Fig. 1) that we employed for the kinematic analysis of the gas in Sect. 3.2.
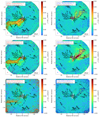 |
Fig. 1 Integrated-intensity maps of H13CO+ (top panels), CCH (middle), and c-C3H2 (bottom) in color scale and colored contours. The left panels correspond to redshifted velocities from the systemic velocity, vsys ~ 3.6 km s−1, and the right panels show blueshifted velocities. The ranges are specified in the text insets of each panel. Overlaid on all panels, we plot the 1.3 mm ALMA continuum (white contours) and the CO (3–2) integrated emission (black contours) from −2.0 to 9.2 km s−1. The H13CO+ and CCH contours are [−5,10,15,20] times the 1σ rms noise level, which is 1.0 mJy beam−1 km s−1 for both maps of H13CO+, and 1.1 mJy beam−1 km s−1 for both CCH maps. The c-C3H2 contours are [−5,3,5,7,10] times the 1σ rms noise level, which is 1.8 mJy beam−1 km s−1 for both maps. Negative contours are represented with dashed lines. CO (3–2) contours are [50,100,200] times the 1σ rms noise of 1.2 mJy beam−1 km s−1. The rms noise of the integrated-intensity maps has been measured before correcting for the primary beam response. The 1.3 mm continuum contours are [20,30,40,50,100, and 200] times the 1σ rms noise of 0.14 mJy beam−1. The dashed curve and arrows in the redshifted panels indicate the transition region between the elongated structure (east, outside the dashed curve) and the rotating envelope (west, delineated by the dashed curve). The red and blue polygons cover the area used to obtain the PV diagrams shown in Figure 3. The synthesized beam sizes are 0.34″ × 0.33″ for the continuum emission, 0.13″ × 0.10″ for CO (3–2), 0.46″ × 0.39″ for H13CO+ and CCH, and 0.42″ × 0.39″ for c-C3H2. The beam ellipses for the H13CO+, CCH and c-C3H2 maps are plotted in the bottom left corner of the corresponding panels. The center of the images is at α(2000)=17h11m23.125s, δ(2000)=−27°24′32.87″. |
3.1.2 Compact SiO emission
The integrated-intensity map of the SiO (5–4) transition at 217.105 GHz (Eu = 31.26 K) is presented in Figure 2. The emission is centered at the peak of the 1.3 mm dust continuum and has a slightly elongated shape with a size of ~3″ and a PA of 114 ± 6° obtained from a Gaussian fitting. This orientation deviates 56 ± 6° from the CO outflow axis (PA=58 ± 2°, Sect. 3.1.1) and does not align with the PA of the continuum either (167°; Alves et al. 2017). The integrated-intensity maps show that the SiO emission is aligned with the large-scale structures seen in H2CO, H13CO+, CCH, and c-C3H2, in contrast to the CO outflow orientation. Moreover, the redshifted emission extends toward the SE and the blueshifted emission toward the NW, as for the other molecular tracers.
3.2 Kinematics
We investigated the kinematics of the elongated components with the position-velocity (PV) diagrams shown in Figure 3 obtained for the emission enclosed in the regions defined in Figure 1. The PV diagrams of the redshifted emission show two components: From the center up to a distance of ~7.5″, the velocity profile is consistent with rotation from the flattened envelope (Alves et al. 2017). From this radial distance onward, the velocity curve is either flat (as seen for H2CO; Evans et al. 2023) or it slightly accelerates when it moves away from the systemic velocity. The latter case is a clear sign of outflowing motions from the central source. We marked the transition region between the rotating envelope and the outflowing gas with arrows, which also corresponds to the change in morphology of the H13CO+ and CCH emission, and the appearance of the outflow cavity tracer c-C3H2 is also marked with arrows at the same distance in Fig. 1. The blueshifted velocity curve clearly reveals accelerating outflowing gas without contamination from the rotating envelope. This is consistent with what was already seen in the PV diagram of the H2CO blueshifted structure (Evans et al. 2023).
3.3 Physical properties
3.3.1 Mass, momentum, and energy
From Fig. 3, we estimated a projected extent of ~13″ or ~2000 au for the elongated structures seen in H13CO+, CCH, and c-C3H2 as measured from the central system. This value is a lower limit since the emission is detected up to the borders of the field of view of our observations, and more material might be present beyond this point. The radial velocity curves are almost flat or show a very small velocity gradient (Fig. 3), which makes it difficult to estimate their actual expansion velocity. The largest velocity difference with respect to vsys at which we detect the emission from the elongated H13CO+ structure is 1.68 ± 0.14 km s−1 (i.e., 12 pixels in the blueshifted PV diagrams of Fig. 3, where the velocity resolution is 0.14 km s−1). We assumed this to be the expansion velocity vexp of the outflow. However, projection effects must be considered. The inclinations of the circumstellar disks with respect to the line of sight are 40 ± 10° (Alves et al. 2019). Assuming that the outflow is launched from one of the circumstellar disks and that its axis is perpendicular to the circumstellar disk plane, we corrected vexp to 2.2 ± 0.4 km s−1. Correcting the length of the structure by the same inclination, we obtained a physical extent of 3300 ± 700 au for the elongated structures. Hence, the corrected dynamical timescale of the outflow would be tdyn = 7000 ± 1900 yr.
We estimated the mass of the outflowing gas by computing the column density of the C18O (2–1) line emission, which is included in the spectral setup of the FAUST observations. To do this, we obtained the integrated C18O line profile across the blue polygon shown in the right panels of Figure 1. For the redshifted emission, we used the emission within the part of the red polygon east of the arrow and the dashed line shown in the left panels of Figure 1 in order to avoid the contribution from the rotating envelope. The Spectral Line Identification and Modelling (SLIM) tool within the MADCUBA package (Martín et al. 2019) was employed to fit the integrated C18O line profile, assuming optically thin emission under local thermodynamic equilibrium (LTE) conditions and a warm outflow with a range of temperatures of 50–100 K (Beuther et al. 2002; Podio et al. 2021). The derived column density for the blueshifted lobe is (2.69±0.19)×1015 cm−2−(4.4±0.3)×1015 cm−2 for temperatures of 50 K and 100 K, respectively. The redshifted emission yields (3.63±0.17)×1015−(5.9±0.3)×1015 cm−2. We used these results to estimate the mass of H2 in the outflow as
![Mathematical equation: $\[M_{H_2}=N\left(\mathrm{C}^{18} \mathrm{O}\right)\left[\frac{\mathrm{H}_2}{\mathrm{C}^{18} \mathrm{O}}\right] \mu_g m_H d^2 A,\]$](/articles/aa/full_html/2025/07/aa54755-25/aa54755-25-eq1.png) (1)
(1)
where [H2/C18O] was obtained considering the isotopic ratio 16O/18O = 560 ± 25 (Wilson & Rood 1994) and the relative abundance of CO to H2, χ(CO) ~ 10−4, μg = 2.3 is the mean atomic weight of the gas, mH is the mass of the hydrogen atom, d = 163 ± 5 pc is the distance toward [BHB2007] 11, and A is the area across which the C18O emission was integrated (21.4 and 24.1″2 for the blueshifted and redshifted lobes, respectively). For the blueshifted lobe, we calculated a mass of (4.0 ± 0.4) × 10−3 M⊙−(6.7 ± 0.6) × 10−3 M⊙ for temperatures of 50 and 100 K, respectively; the results for the redshifted lobe are (5.0 ± 0.5) × 10−3 M⊙−(8.0 ± 0.8) × 10−3 M⊙. Given the small difference between the values at different temperatures, we adopted mean values of (5.4 ± 0.7) × 10−3 M⊙ and (6.5 ± 0.9) × 10−3 M⊙ for the blue- and redshifted emission, respectively. This yielded a total outflowing mass of M = (1.19 ± 0.11) × 10−2 M⊙. Using the mass of the outflow, the estimated dynamical timescale of tdyn = 7000 ± 1900 yr and the measured expansion velocity of vexp = 2.2 ± 0.4 km s−1, we estimated an outflow mass-loss rate of ![Mathematical equation: $\[\dot{M}\]$](/articles/aa/full_html/2025/07/aa54755-25/aa54755-25-eq2.png) = M/tdyn = (1.7 ± 0.5) × 10−6 M⊙ yr−1, a linear momentum injection rate of
= M/tdyn = (1.7 ± 0.5) × 10−6 M⊙ yr−1, a linear momentum injection rate of ![Mathematical equation: $\[\dot{P}=\dot{M} v_{exp}=(3.7 \pm 1.3) \times 10^{-6} M_{\odot} ~\mathrm{km} ~\mathrm{s}^{-1} ~\mathrm{yr}^{-1}\]$](/articles/aa/full_html/2025/07/aa54755-25/aa54755-25-eq3.png) , and a kinetic energy of
, and a kinetic energy of ![Mathematical equation: $\[E=\frac{1}{2} M v_{exp}^{2}=(6 \pm 2) \times 10^{41}\]$](/articles/aa/full_html/2025/07/aa54755-25/aa54755-25-eq4.png) erg. The energy injection rate defined as
erg. The energy injection rate defined as ![Mathematical equation: $\[\dot{E}=E / t_{dyn}\]$](/articles/aa/full_html/2025/07/aa54755-25/aa54755-25-eq5.png) is (9 ± 4) × 1037 erg yr−1. These results are summarized in Table 1 and discussed in Sect. 4.
is (9 ± 4) × 1037 erg yr−1. These results are summarized in Table 1 and discussed in Sect. 4.
The outflow rates derived from the dynamical timescale tdyn may be overestimated, however, because they consider that the whole outflow moves at maximum velocity, which is not true in general. Following the procedure from Hsieh et al. (2023), we employed their Pixel Flux-tracing Technique (PFT) code to compare the results with the tdyn method. The code first calculates the C18O column density for every pixel of the outflow. Then, for every velocity channel of velocity v with respect to the systemic velocity, the crossing time ΔR/v is computed, where ΔR is the pixel size. These values are corrected for the inclination of the outflow with respect to the line of sight. This yields maps of the instantaneous outflow rates for every pixel. In Table 2 we compare the results of the two methods, where the PFT results were also obtained for temperatures of 50 K and 100 K and were averaged. The outflow mass was obtained as the sum of the mass of every pixel and was higher by a factor of 5 than the mass obtained from the column density derived from the fit to the line profile. This proves that the two methods are comparable. Similarly, the energy of the outflow is comparable for the two methods. The mean mass, momentum, and energy rates obtained from the PFT method are lower by between one and two orders of magnitude than those obtained with tdyn, which was also found by Hsieh et al. (2023). This illustrates that the outflow rates derived with the tdyn method must be taken with caution.
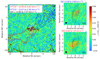 |
Fig. 2 Left: SiO moment 0 map (color map and black contours) overlaid with white contours from the continuum and red and blue contours from the moment 0 maps of H13CO+. The velocity ranges are indicated in the panels. The SiO contours are [−5,3,5,7] times the rms noise value of 5.0 mJy beam−1 km s−1, with negative contours shown as dashed lines. The H13CO+ contours are [−5,10,15] times the 1σ rms noise level of 1.0 mJy beam−1 km s−1. The continuum contours are the same as in Figure 1. Right: Continuum (black contours) and integrated-intensity maps of SiO (color map and colored contours) in the area covered by the square in the left panel. The contour levels are the same as in the left panel for rms noise values of 3.5 mJy beam−1 km s−1 for the blue- and redshifted integrated SiO emission. The synthesized beam sizes of 0.43×0.39″ for SiO and 0.34×0.33″ for the continuum are represented with the ellipse in the bottom left corners with the same color as the corresponding contours. The rms noise of the integrated-intensity maps has been measured before correcting for the primary beam response. The range of the color scale has been expanded with respect to Fig. 1 for better visualization of the SiO emission. |
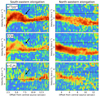 |
Fig. 3 Position-velocity diagrams of the H13CO+ (top panels), CCH (middle), and c-C3H2 (bottom) emission from the areas highlighted in Figure 1. The left panels show the redshifted emission of the putative second outflow, and the right panels show the blueshifted emission counterparts. The dashed lines represent the systemic velocity of the source, vsys ~ 3.6 km s−1. The arrows in the redshifted panels correspond to the transition between the rotating envelope and the outflowing gas, as also specified in Fig. 1. We employed a logarithmic color scale to emphasize the shape of the velocity curve of the outflowing gas. |
Properties of the potential new outflow in [BHB2007] 11.
Comparison between the outflow properties obtained from the tdyn method (Table 1) and from the PFT method (Hsieh et al. 2023).
3.3.2 Rotation of the outflow
Following a similar procedure as Zhang et al. (2018) and Ohashi et al. (2022), we explored the transversal motion of the outflow in order to characterize a possible rotation. We focused on the redshifted emission since it has a higher S/N ratio. In Figure 4 we show a set of PV diagrams obtained perpendicular to the elongated H13CO+ emission with a PA = 8°. The rightmost cut, closest to the star, corresponds to the PV diagram with an offset of 0″, which is the point from which the H13CO+ emission traces the outflow instead of the rotating envelope (see arrows in Figs. 1 and 3). The PV diagrams reveal a velocity gradient across the axis of the outflow, with the redshifted gas located toward the north and the blueshifted gas located toward the south, suggesting either rotation of the gas or shear at the boundary between an outflow and the ambient gas (see Section 4.2). This gradient has the opposite sense with respect to the NE cone of the CO outflow, which shows blueshifted emission in the north and redshifted gas in the south (Alves et al. 2017, Section 3.1). At offsets farther away from the central binary system, the velocity curves are more extended and the velocity gradient flattens out, which would be explained by the progressive opening of a conical outflow and slowing down rotation at larger distances from the launching point. This behavior is the same as was seen in NGC 1333 IRAS 4C (Zhang et al. 2018) and VLA 1623A (Ohashi et al. 2022).
We then employed the PV diagrams to quantify the rotation of the outflow, as done in Zhang et al. (2018). For each PV diagram at an offset z, we obtained the most extreme velocity and distance of the northern and southern parts of the outflow, vN(z) and rN(z), and vS(z) and rS(z), respectively. These points were obtained at the extremes of the curve for each half of the diagram, that is, for the northern and southern emission, within the pixels of 0.6 times the value of the peak intensity, which adequately trace the extent of the curve (Fig. 4). With these values, we computed the radius of the outflow, Rout(z) = [rS(z) − rN(z)]/2, the deviation from the chosen outflow axis Rmed(z) = [rS(z) + rN(z)]/2, the median line-of-sight velocity Vmed(z) = [vS(z) + vN(z)]/2, and the rotation velocity Vrot(z) = [vN(z) − vS(z)]/2. The results are shown in Figure 5. Panel a shows that the outflow extension is nearly constant at lower offsets and increases at larger radial distances from the central binary system, that is, at higher values of z, as shown in Figure 4. Panel b allows us to evaluate how accurate the outflow axis choice for the PV diagrams has been. The points are distributed about 0″, which indicates a correct estimate. Panel c) shows an almost constant outflow line-of-sight expansion velocity with a mean value and standard deviation of 4.08 ± 0.06 km s−1. In panel d) we show the rotation velocity of the outflow, that is, the gradient between the line-of-sight velocity of the northern and southern parts of the outflow. This panel illustrates one of the limitations of the method with our dataset: The spectral resolution of ~0.14 km s−1 is similar to the velocity gradient of the outflow, resulting in differences of 4 or 5 pixels at most. The error bars, computed from this spectral resolution, are larger than the separation between points, and these results should therefore be taken with caution. We combined the information from panels a) and d) to obtain the specific angular momentum of the outflow l(z) = Rout(z)Vrot(z), shown in panel e). The derived mean and standard deviation of the specific angular momentum is 70 ± 25 au km s−1, which lies within the error bars of the value of ~100 au km s−1 found for NGC 1333 IRAS 4C (Zhang et al. 2018) and VLA 1623A (Ohashi et al. 2022). The angular momentum is basically constant, and the points essentially follow the shape of the Rout distribution in panel a. We note that the values of the specific angular momentum should be taken with caution given the large uncertainty in estimating Vrot. In Figure 6, we plot the curve of a constant specific angular momentum of 70 au km s−1 with the 60% intensity emission contours obtained from the PV diagrams of Fig. 4. The curve encloses the emission from the velocity curves at different offsets, which illustrates that the velocity gradients are consistent with rotation with a constant specific angular momentum.
Last, we estimated the launching radius r0 of the outflow employing the method from Anderson et al. (2003),
![Mathematical equation: $\[r_0 \approx 0.7 \mathrm{au}\left(\frac{l}{100 ~\mathrm{au} \mathrm{~km} \mathrm{~s}^{-1}}\right)^{2 / 3}\left(\frac{v_{exp }}{100 \mathrm{~km} \mathrm{~s}^{-1}}\right)^{-4 / 3}\left(\frac{M_*}{1 M_{\odot}}\right)^{1 / 3},\]$](/articles/aa/full_html/2025/07/aa54755-25/aa54755-25-eq16.png) (2)
(2)
where l is the mean specific momentum, and M* is the mass of the central system. We considered the velocity difference of the outflow of vexp = 2.2 ± 0.4 km s−1 (Section 3.3.1), the combined mass of the system (2.25 ± 0.13 M⊙; see Alves et al. 2019), and the derived specific angular momentum l = 70 ± 25 au km s−1. When we assume that the outflow is launched by one of the companions, and considering an equal-mass system as an approximation, the estimated launching radius is r0 = 90 ± 30 au. This radius is at the scale of the circumbinary disk and is similar to the launching radius of the CO outflow, ~90–130 au (Alves et al. 2017). However, this estimate is very sensitive to the value of the specific angular momentum and to the expansion velocity of the outflow vexp, which is estimated with poor accuracy given the low-velocity gradient of the velocity curves (Fig. 3). A value of vexp = 10 km s−1, as assumed for NGC 1333 IRAS 4C (Zhang et al. 2018) and VLA 1623A (Ohashi et al. 2022), would result in an estimate of the launching radius of r0 ≈ 10 au, which is at the scales of the orbit of the binary system. Source B is less massive than its companion and is the main accretor of the system (Alves et al. 2019), which is consistent with predictions from simulations (e.g. Duffell et al. 2020; Ceppi et al. 2022). If the outflow is launched by this object, the lower mass would also result in a shorter launching radius than was derived considering an equal-mass system.
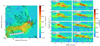 |
Fig. 4 Position-velocity diagrams of the H13CO+ emission along the transversal direction of the outflow. In the left panel, we show the redshifted H13CO+ and CO (3–2) integrated-intensity maps using the same contours and velocity ranges as in Fig. 1. The dashed lines in the left panel represent the cuts separated by 1″ that were used to obtain the PV diagrams reported in the right panels. The contours in the PV diagrams are [0.4, 0.6, and 0.8] times the peak intensity of the image, which is 0.05 Jy beam−1 for every panel. The negative offsets refer to the northern part of the outflow. The dotted lines in the PV diagrams indicate the systemic velociy of the source, vsys ~ 3.6 km s−1. The text insets in both panels show the offset of each cut from the rightmost cut, which corresponds to an offset of 0″. |
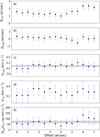 |
Fig. 5 Properties of the rotation of the outflow derived from the transversal PV diagrams of the H13CO+ redshifted emission (Fig. 4) at different offsets z, with z increasing away from the central star. Rout represents the radius of the outflow, Rmed is the deviation from the chosen outflow axis, Vmed is the median line-of-sight velocity, Vrot is the rotation velocity of the outflow, and RoutVrot is the specific angular momentum of the outflow. All quantities are defined in Sect. 3.3.2. The error bars are computed from the synthesized beam size of ~0.4″ and the spectral resolution is 0.14 km s−1. The dotted line in panel b corresponds to a value of 0″. The dotted lines and shadowed areas in panels c and e represent the mean value and standard deviation of the points, respectively. |
3.4 Shocked material at smaller scales
To estimate the abundance of the SiO emission, we first obtained the SiO and C18O column densities in the region defined by the 3σ contour from Figure 2 and then used the following expression:
![Mathematical equation: $\[\chi(\mathrm{SiO})=\frac{N(\mathrm{SiO})}{N\left(\mathrm{C}^{18} \mathrm{O}\right)} \frac{{ }^{18} \mathrm{O}}{{ }^{16} \mathrm{O}} \chi(\mathrm{CO}),\]$](/articles/aa/full_html/2025/07/aa54755-25/aa54755-25-eq17.png) (3)
(3)
with the same values of 16O/18O and χ(CO) as we used in Sect. 3.3. To calculate the column density of C18O and SiO, we considered LTE and optically thin emission,
![Mathematical equation: $\[N_T=\frac{N_u}{g_u} Q\left(T_{e x}\right) e^{E_u / k T_{e x}},\]$](/articles/aa/full_html/2025/07/aa54755-25/aa54755-25-eq18.png) (4)
(4)
where NT is the total column density of the molecule, Nu is the column density of molecules in the upper energy level, gu is the statistical weight of the upper level, Q(Tex) is the partition function at the excitation temperature Tex, and Eu is the upper level energy. To obtain Nu/gu, we used Eq. (12) from Dierickx et al. (2015),
![Mathematical equation: $\[\frac{N_u}{g_u}=1.669 \times 10^{17} \frac{\int T_B ~d \nu\left(\mathrm{~K} \mathrm{~km} \mathrm{~s}^{-1}\right)}{S \mu(\mathrm{D})^2 \nu(\mathrm{MHz})} \mathrm{cm}^{-2},\]$](/articles/aa/full_html/2025/07/aa54755-25/aa54755-25-eq19.png) (5)
(5)
where ∫ TB dv is the integrated line profile, S is the line strength, and μ is the dipole moment. The line profile of both molecules was obtained from their respective data cube with a spatial aperture defined by the 3σ contour from Figure 2. We integrated the line profiles avoiding the central ±3 km s−1 velocities from the systemic velocity of 3.6 km s−1 to minimize the effect of C18O tracing the rotating envelope.
Since only one SiO transition is covered by our setup, we assumed a range of temperatures between 50 and 100 K in our calculations, given the temperature gradients observed in protostellar outflows (Beuther et al. 2002; Podio et al. 2021). Equations (4) and (5) in the selected velocity ranges yield column densities of N(SiO) = (3.4–5.0) × 1013 cm−2 and N(C18O) = (4.7–7.9) × 1016 cm−2 for a temperature range of 50–100 K. From Equation (3), this results in abundances of SiO of χ(SiO) ≥ (1.1–1.3) × 10−10 with respect to H2.
Another possibility is to estimate the SiO abundance with the SiO and H13CO+ column densities,
![Mathematical equation: $\[\chi(\mathrm{SiO})=\frac{N(\mathrm{SiO})}{N\left(\mathrm{H}^{13} \mathrm{CO}^{+}\right)} \frac{{ }^{13} \mathrm{C}}{{ }^{12} \mathrm{C}} \chi\left(\mathrm{HCO}^{+}\right),\]$](/articles/aa/full_html/2025/07/aa54755-25/aa54755-25-eq20.png) (6)
(6)
where 12C/13C~69 (Milam et al. 2005) and χ(HCO+) ~ 10−8 (Irvine et al. 1987). The H13CO+ column density of (2.5–3.8) × 1012 cm−2 yields SiO abundances of χ(SiO) ≥ (1.9–2.0) × 10−9.
The derived abundances are lower by two to four orders of magnitude than the typical values of 10−7−10−6 found for Class 0 sources that drive collimated jets (Podio et al. 2021). Although we avoided the central radial velocities on purpose, a fraction of the measured C18O and H13CO+ emission may still arise from the envelope. These central velocities concentrate most of the SiO line emission, while the line wings are much fainter. This inevitably results in an underestimate of the SiO abundance. Moreover, if the SiO emission arises from compact shocks, it is likely that this emission is diluted within the synthesized beam of our observations, and therefore, the SiO column densities that we obtained are probably lower than the actual values. The derived SiO abundances should therefore be considered as lower limits, which may explain the low values in comparison to other sources.
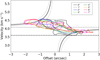 |
Fig. 6 Contours of 0.6 times the maximum value of the PV diagrams from Figure 4. The colors represent different offsets along the outflow, as indicated by the text insets. The dotted black line corresponds to the systemic velocity, vsys ~ 3.6 km s−1, and the dotted gray line shows the mean velocity of the velocity curves, 4.08 km s−1. The solid black curves correspond to a constant specific angular momentum of 70 ± 25 au km s−1 for a central velocity of 4.08 km s−1, where the gray curves represent the limits of the error interval. |
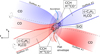 |
Fig. 7 Sketch (not to scale) of the proposed interpretation of the observations toward [BHB2007] 11 where a second outflow is found in addition to the CO outflow reported by Alves et al. (2017). The ellipses at the center represent the flattened envelope. The innermost contour represents the circumbinary disk, where the two stars of the system are represented by the stars. The inner ellipse represents the continuum contours from Figures 1 and 2, where the spiral structures seen in Alves et al. (2017) are emphasized. The tips of these spiral structures are the landing sites of the accretion from the envelope (blue and red arrows) and the launching points of the CO outflow (Alves et al. 2017). We marked the CO outflow from Alves et al. (2017) as Outflow 1, while the new proposed outflow inferred from the observations in this work is named Outflow 2. The launching point of Outflow 2 is unknown, and we draw it from the edge of the circumbinary disk. The SiO emission is represented with the thick contour at the center, corresponding to the 3σ contour from the left panel of Figure 2. The different molecular tracers used to identify each component of the system are overplotted on the sketch in the corresponding part. The rotation axes are indicated with the dashed lines. Blue and red represent blue- and redshifted velocities, respectively. |
4 Discussion
The analysis of multiple molecular tracers has revealed a very detailed picture of the different kinematic components at intermediate scales around [BHB2007] 11. In the following sections, we discuss the new outflow hypothesis based on the evidence gathered from the different molecular tracers, as well as alternative explanations such as the possibilities of a wide-angle outflow cavity, a relic outflow, or accretion from infalling streamers.
4.1 A new outflow in [BHB2007] 11
Our main hypothesis derived from the emission of the multiple molecular lines analyzed in this work consists of a second outflow in addition to the main CO outflow reported by Alves et al. (2017). In Figure 7 we present a summary of the proposed picture.
The structures discovered in H2CO by Evans et al. (2023) were identified in H13CO+, CCH, and c-C3H2 (Figure 1). The PV diagrams obtained in these structures (Figure 3) are consistent with outflowing motion in the blueshifted part, while the redshifted lobe shows tentative acceleration, but not as steep as for the blueshifted gas. The velocity curves are similar to those obtained from H2CO by Evans et al. (2023), which could not be fitted by infalling streamer modeling (Pineda et al. 2020). These results suggest that the two elongated structures are lobes of a second outflow powered by [BHB2007] 11, which remained unidentified in previous works. The reason was that this second outflow may lie close to the plane of the sky, and therefore, its velocities lie in a velocity range that is largely affected by selfabsorption in the observed CO line emission because CO is also present in the extended envelope (Alves et al. 2017). That c-C3H2 is only seen in the elongated structures and at the base of the CO outflow reinforces the second outflow hypothesis, as this molecule has been observed in UV-illuminated environments such as outflow cavities (Murillo et al. 2018; Tychoniec et al. 2021, Sect. 3.1.1). However, while the blueshifted lobe clearly shows acceleration motions, the redshifted lobe might be perturbed by a wider cavity caused by a slower component of the CO outflow (Sect. 4.2.1). It is possible that both structures coexist and emit in the same region of the sky, which complicates the interpretation of the redshifted emission with the current dataset. Additionally, the velocity gradient seen in the blueshifted emission may be caused by a bending of the outflowing gas along the direction of the line of sight. To test this hypothesis, we estimated the velocity difference that would result from a deflection of the outflow. For an initial angle of the outflow with respect to the line of sight of θ = 40°, that is, for the same orientation as the circumstellar disks (Alves et al. 2019), a minimum outflow expansion velocity vexp of 7.3 km s−1 is needed to cause a gradient of 1.7 km s−1 (Fig. 3) purely by bending, and it would require a bending of 40° toward the line of sight. However, in this case, the minimum observed velocity difference with respect to the systemic velocity would be 5.6 km s−1, which is much faster than the velocities we detected. If the initial orientation of the outflow were closer to the plane of the sky, lower outflow velocities would be needed to reproduce the velocity gradient, but conversely, the deflection angles would be much higher. This suggests that the gradient cannot be explained by a bending of the outflow.
Table 1 collects the properties of the second outflow derived in Section 3. The derived mass-loss rate of (1.7 ± 0.5) × 10−6 M⊙ yr−1 is one of the typical values of jets from Class 0 and Class I sources (e.g. Bally 2016; Lee 2020; Podio et al. 2021), and this rate decreases as the protostar enters the Class I phase. Hsieh et al. (2023) recently obtained outflow properties with CO isotopologs observed with ALMA, and reported higher values for the mass and mass-loss rate of the outflows, which are higher by about a factor of two than our derived values. As we noted in Section 3.3, one of the main limitations of our data is that the outflow is potentially not fully covered by the field of view of the observations. This implies that properties such as the mass and the extent of the outflow are underestimated. In addition, the expansion velocity of the outflow vexp is potentially not accurately constrained either because it may expand close to the plane of the sky, given the small gradients in the velocity curves from Fig. 3. Hence, quantities involving the expansion velocity, such as the mass loss and momentum rates and the energy of the outflow, are also potentially underestimated, yielding lower values than those found in the literature. We note that our calculations considered a single expansion velocity for the whole outflow, which is an approximation that may not account for the true velocity of the entrained material.
The PV diagrams obtained along the transversal direction of the redshifted lobe (Fig. 4, Sect. 3.3.2) revealed transversal motions in the opposite sense to the rotation of the CO outflow (Alves et al. 2017). When we assume that the transversal motion corresponds to rotation of the second outflow, an analysis following the method of Zhang et al. (2018) yields a specific angular momentum of 70 ± 25 au km s−1. However, this method is very limited in the case of [BHB2007] 11 because of the low-velocity gradients that are comparable to the velocity resolution of the ALMA observations (see panel d in Figure 5). In addition to the poorly constrained expansion velocity of the outflow, this prevents us from strongly constraining the outflow-launching radius with the current dataset. The derived value of the launch radius is 90 ± 30 au, which corresponds to the scales of the circumbinary disk, although slightly higher expansion velocities would result in much shorter launching radii (Sect. 3.3.2). A value of vexp = 10 km s−1, as assumed for NGC 1333 IRAS 4C (Zhang et al. 2018) and VLA 1623A (Ohashi et al. 2022), would result in a launch radius of r0 ≈ 10 au.
The SiO emission detected at the inner ~300 au extends along the direction of the large-scale structures seen in H2CO, CCH, H13CO+, and c-C3H2, with the redshifted emission seen toward the SE and the blueshifted emission toward the NW (Figure 2). SiO is produced as a consequence of the sputtering of dust grains in shocks (Martin-Pintado et al. 1992; Caselli et al. 1997; Schilke et al. 1997; Jiménez-Serra et al. 2004), which means that it is an excellent outflow-shock tracer. The orientation of the CO outflow is almost perpendicular to the detected SiO structure, and we therefore rule out the possibility that SiO traces the base of the CO outflow. In addition to this, the observed SiO emission peaks toward the dust emission peak (and hence, its origin is located within the central ~0.4″), which contrasts with the large launching radius of the CO outflow of ~90–130 au (i.e., at more than 0.55″) from the center. The abundance of SiO within the structure is ≥(0.11–2.0) × 10−9. Grain-sputtering models show that shock velocities between 10 and 20 km s−1 are needed to sputter sufficient silicon from the icy mantles of dust grains to yield SiO gas-phase abundances of ~10−9 (see e.g. Jiménez-Serra et al. 2008; Gusdorf et al. 2008; Nguyen-Lu’o’ng et al. 2013). The most extreme velocity values of the SiO (5–4) line emission in our dataset are 10 km s−1, or 13 ± 3 km s−1 when we correct them for the disk inclination of 40° ± 10°, which is consistent with the grain-sputtering model predictions.
Ejection of matter is tightly tied to accretion processes in young protostars (e.g. Bally 2016). There are examples of binary protostars hosting multiple outflows, for instance, L1551 IRS5 (e.g. Rodríguez et al. 2003), IRAS 16293A (e.g. van der Wiel et al. 2019), or the debated case of VLA 1623A (Hsieh et al. 2020; Hara et al. 2021; Ohashi et al. 2022). Previous works on [BHB2007] 11 have revealed that accretion occurs at the flattened envelope scale (Alves et al. 2017) and in the inner parts of the circumbinary disk (Alves et al. 2019). Specifically, the less massive member B is thought to be the main accretor of the binary given the evidence of gas streamers in its surroundings, which also agrees with predictions from simulations (e.g. Duffell et al. 2020; Ceppi et al. 2022). The hypothesis of an outflow in addition to the CO outflow launched from the circumbinary disk is consistent with the finding of accretion at the circumstellar disk scale (Alves et al. 2019; Vastel et al. 2022), which must entail angular momentum removal. However, the angular resolution of the current ALMA observations is not high enough to resolve the launch region of the second outflow detected in [BHB2007] 11, and estimates from the current dataset yield high uncertainties (Sect. 3.3.2). Future observations at higher angular resolution may be able to resolve the inner parts of the outflow and provide a reliable estimate of the new outflow-launching radius.
Finally, we note that if the SiO emission indeed traces an outflow from one of the two sources from the binary system, and if the outflow is perpendicular to the disk plane, the circumstellar disk of the driving source would be misaligned with respect to the circumbinary disk. Misaligned outflows in multiple systems are a frequent outcome of the turbulent fragmentation formation scenario of the binary (e.g. Offner et al. 2010, 2023), in contrast to the disk fragmentation theory, in which we expect the circumstellar disk to be aligned with the circumbinary material (Bonnell & Bate 1994). The counter-rotation of the putative new outflow with respect to the CO outflow is also consistent with the turbulent formation scenario. Accretion of material with different net angular momentum causes the misalignment of the circumstellar disks with respect to the axis of the circumbinary disk (Bate 2018), which is possible in the turbulent accretion scenario, as well as in asymmetric accretion coming from infalling streamers (Sect. 4.2.3).
4.2 Alternative interpretations
4.2.1 Cavity walls of the CO outflow
Alternatively, the elongated structures might trace the walls of the cavity that were carved by a slower, wide-angle component of the CO outflow (e.g. de Valon et al. 2022). The location of the elongations, with the redshifted emission located toward the southeast and the blueshifted emission toward the north-west, is consistent with the rotation of the higher-velocity CO outflow. However, under this scenario, we would expect to see both sides of the cavity wall for each lobe, which would delineate a biconical shape in each side of the outflow. This is the case of the outflow cavity in VLA 1623A traced by CCH (Ohashi et al. 2022). The data presented here do not show the expected biconical counterpart of the cavity wall on the other side of the rotation axis of each lobe, although this might be explained by different physical conditions of the ambient cloud.
In addition, in Section 3.3.2, we have reported a transversal velocity gradient for the redshifted part of the elongated SE structure. This gradient is interpreted as rotation in the opposite sense to the sense observed for the main CO outflow and for the envelope. However, we note that this interpretation needs to be taken with caution: There are signs of transversal motions in molecular outflows that could be mistaken for rotation (Frank et al. 2014). Instead of rotation from a separate outflow, this gradient may be explained by shear of the wide-angle wind at the edges of the cavity wall. If this is the correct interpretation, our estimate of the launch radius of the emission should not be considered valid because it relies on the assumption of a rotating outflow, although the derived value is consistent with the value found for the main CO outflow (Alves et al. 2017). Another possible interpretation is that the main CO outflow is in Keplerian rotation and that the emission traces the outer part of the outflow rotation curve, where slower velocities are expected for wider distances from the rotation axis.
To further analyze the possibility of a cavity from a wide-angle wind, Figure A.1 in the appendix presents the channel maps of the CS (5–4) transition at 244.935 GHz, which are also covered by the FAUST spectral setup. CS is a dense gas tracer, and the (5–4) transition emits in the outflow cavity walls (e.g. Ohashi et al. 2022) and does not show absorption close to the systemic velocity. The CS (5–4) emission simultaneously shows the two large-scale components that we discussed: It clearly delineates the cavities of the main CO outflow and also shows emission over the two elongated structures detected toward the SE and NW. As shown in Figure A.1, the panels at 4.53 and 4.08 km s−1 show the redshifted elongation separated from the wall of the northern lobe of the CO outflow, as well as strong emission near the base of the proposed new outflow. Similarly, the blueshifted emission at 2.74 and 2.44 km s−1 traces the elongated emission toward the NW, and strong emission in the SE-NW direction at the base. While the walls of the CO outflow and the elongated structures appear to be separated in the plane of the sky, these images alone do not allow us to discern between the new outflow scenario or the case of a wide-angle, slow molecular wind enclosing the main CO outflow seen at higher velocities.
The SiO emission seen along the main axis of the new outflow, however, remains difficult to explain under this scenario. If the features in H13CO+, CCH, and c-C3H2 are part of a wide-angle, slow molecular wind, the SiO emission should appear aligned in the direction of the main CO outflow (i.e., in the NE-SW direction), which is not observed. As mentioned in Sect. 4.1, a possible explanation is that the two structures (the new second outflow and a wide-angle, slow wind) coexist and their emission overlaps toward the southeastern part of the outflow.
4.2.2 Relic outflow
The observed elongations may be a relic outflow emission from a previous episode of ejection of material. This scenario was proposed by Okoda et al. (2021) as an explanation of the elongated emission found in IRAS 15398–3359 that was perpendicular to the main outflow. The observed low expansion velocity of the elongated structures in [BHB2007] 11 of 2.2 ± 0.4 km s−1 would correspond to a velocity that is much lower than the velocity from the original ejection episode. However, we note that the CO outflow is launched from the circumbinary disk, not by one of the members of the close binary. This means that if the elongations are part of a previous ejection of material from this main outflow, the circumbinary disk should have reoriented 56 ± 6° since then (Sect. 3.1.2). SPIRE data at 250 μm show the dust cavity carved by the main CO outflow extending up to ~30 000 au (Sandell et al. 2021), suggesting that the circumbinary disk from which the main outflow is launched has not recently reorientated. Moreover, Okoda et al. (2021) found an arc-like structure of shocked material a few thousand au from IRAS 15398–3359 traced by SO, SiO, and CH3OH following the orientation of the additional elongated emission. The observations explored in this work, however, only show shocked material from the SiO emission at the base of the putative new outflow, with a similar orientation to its large-scale structure seen in the other molecular tracers. Consequently, we consider the possibility of a relic emission from the main CO outflow as unlikely.
4.2.3 Accretion streamers
One last possibility is that the large-scale structures seen in H13CO+, CCH, and c-C3H2, and the compact SiO emission, are produced by a gas streamer infalling almost parallel to the plane of the sky, releasing SiO at the interaction region with the circumbinary disk, forming an accretion shock. As already mentioned, the free-falling streamer models could not reproduce either the velocity curves of H2CO (Evans et al. 2023) or the large-scale kinematics of the H13CO+, CCH, and c-C3H2 gas. We acknowledge the fact that the redshifted part of the new elongated structures seen in these molecular tracers presents an almost flat velocity structure, which might contradict the hypothesis of an expanding outflow. However, the presence of SiO, a molecule that is sputtered from dust grains in shocks (see e.g. Caselli et al. 1997; Jiménez-Serra et al. 2008), which is aligned with the large-scale H13CO+, CCH, and c-C3H2 structures, supports the idea of a new outflow.
We estimated the impact velocity of a free-falling streamer of material considering the free-fall velocity (7) and the velocity gradient (8) (Stahler & Palla 2004),
![Mathematical equation: $\[v_{f f}=-\sqrt{\frac{2 G M_*}{R}}\]$](/articles/aa/full_html/2025/07/aa54755-25/aa54755-25-eq21.png) (7)
(7)
![Mathematical equation: $\[\nabla v_{f f}=\sqrt{\frac{G M_*}{2 R^3}},\]$](/articles/aa/full_html/2025/07/aa54755-25/aa54755-25-eq22.png) (8)
(8)
where M* is the central mass of the system, 2.25 ± 0.13 M⊙ (Alves et al. 2019), R is the distance to the tip of the elongated structure, 3300 ± 700 au (Sect. 3.2, Table 1), and G is the gravitational constant. The free-fall velocity at the tip of the streamer is vf f = 1.11 ± 0.12 km s−1, and the velocity gradient is ∇vf f = 34 ± 11 km s−1 pc−1, which yields an impact velocity of the material of 1.6 ± 0.2 km s−1. Moreover, magnetohydrodynamical simulations predict that infall velocities at scales of 100–1000 au could be slower than the free-fall velocities (Hirano et al. 2025). Shock velocities lower than 2 km s−1 are unlikely to release SiO abundances of 10−9 (Jiménez-Serra et al. 2008; Nguyen-Lu’o’ng et al. 2013). Kido et al. (2023) interpreted the detection of SiO emission spatially coincident with the landing point of a streamer toward IRAS 16544–1604, with an accretion shock. However, they did not report a value for the measured SiO abundance. In addition, SiO is not predicted to be released in these environments by current models (e.g. van Gelder et al. 2021), which seems to rule out the accretion streamer scenario for the SiO emission in [BHB2007] 11.
5 Conclusions
We have analyzed observations of H13CO+, CCH, and c-C3H2 and SiO obtained toward the young binary [BHB2007] 11 observed within the FAUST ALMA large program. They were crucial to disentangle the different components and the kinematics of the system at intermediate spatial scales. The molecular emission of H13CO+, CCH, and c-C3H2 reveals two elongated structures at scales of ~1000 au that were previously discovered in H2CO (Evans et al. 2023). The axis of these structures is almost perpendicular to the previously identified CO outflow that launched from the circumbinary disk at ~90–130 au from the center of the binary system (Alves et al. 2017). The kinematic analysis of the large-scale gas indicates outflowing motions and outflow rotation in the opposite sense to the main CO outflow. The emission from H13CO+, CCH, and c-C3H2 probes a velocity range of ±2 km s−1 with respect to the systemic velocity of [BHB2077]11, which could not be probed in previous CO observations due to severe self-absorption of the line (Alves et al. 2017). At the central ~300 au, the FAUST images detect compact SiO emission that is elongated in the same direction and expands in the same sense as the large-scale structures detected in H13CO+, CCH, and c-C3H2, suggesting that SiO traces the shocked material at the base of the new outflow. The center of the SiO emission coincides with the peak of the dust emission, which indicates that the new outflow is likely powered by one of the two protostars orbiting inside the circumbinary disk. The binary is known to be strongly accreting through gas streamers connected to the circumbinary disk (Alves et al. 2019). The ejection of a jet that removes the excess of angular momentum is therefore expected.
All the evidence from the observations we analyzed suggests a second outflow in [BHB2007] 11. However, we explored alternative explanations, namely a wide-angle cavity carved by a slower component of the main outflow, a relic outflow, and accretion streamers. From the current data, we cannot completely discard the possibility that these structures coexist with an additional outflow. Further high angular resolution observations will cast light onto this complex system. We illustrated the importance of observing different molecular tracers to explore the morphology and kinematics of jets that are powered by young protostars, which still remain poorly known.
Acknowledgements
A.M.-H. and I.J.-S. acknowledge funding from grant PID2022-136814NB-I00 funded by the Spanish Ministry of Science, Innovation and Universities/State Agency of Research MICIU/AEI/ 10.13039/501100011033 and by “ERDF/EU”. A.M.-H. has received support from grant MDM-2017-0737 Unidad de Excelencia “María de Maeztu” Centro de Astrobiología (CAB, CSIC-INTA) funded by MCIN/AEI/10.13039/501100011033. LP, CICo, EB, and GS acknowledge the PRIN-MUR 2020 BEYOND-2p (Astrochemistry beyond the second period elements, Prot. 2020AFB3FX), the project ASI-Astrobiologia 2023 MIGLIORA (Modeling Chemical Complexity, F83C23000800005), the INAFGO 2023 fundings PROTO-SKA (Exploiting ALMA data to study planet forming disks: preparing the advent of SKA, C13C23000770005), the INAFGO 2024 fundings ICES (tracking the history of ices from the cradles of planets to comets), the INAF MiniGrant 2022 “Chemical Origins” (PI: L. Podio), and the INAF-Minigrant 2023 TRIESTE (“TRacing the chemIcal hEritage of our originS: from proTostars to plan-Ets”; PI: G. Sabatini). LP, ClCo, EB, and GS also acknowledge financial support under the National Recovery and Resilience Plan (NRRP), Mission 4, Component 2, Investment 1.1, Call for tender No. 104 published on 2.2.2022 by the Italian Ministry of University and Research (MUR), funded by the European Union – NextGenerationEU-Project Title 2022JC2Y93 Chemical Origins: linking the fossil composition of the Solar System with the chemistry of protoplanetary disks – CUP J53D23001600006 – Grant Assignment Decree No. 962 adopted on 30.06.2023 by the Italian Ministry of Ministry of University and Research (MUR). E.B. acknowledges contribution of the Next Generation EU funds within the National Recovery and Resilience Plan (PNRR), Mission 4 – Education and Research, Component 2 – From Research to Business (M4C2), Investment Line 3.1 – Strengthening and creation of Research Infrastructures, Project IR0000034 – STILES – Strengthening the Italian Leadership in ELT and SKA. M.B. acknowledges the support from the European Research Council (ERC) Advanced grant MOPPEX 833460. This project has received funding from the European Research Council (ERC) under the European Union Horizon Europe programme (grant agreement No. 101042275, project Stellar-MADE). D.J. is supported by NRC Canada and by an NSERC Discovery Grant. This paper uses the following ALMA data: ADS/JAO.ALMA#2018.1.01205.L, ADS/JAO.ALMA#2019.1.01566.S, ADS/JAO.ALMA#2013.1.00291.S. ALMA is a partnership of ESO (representing its member states), NSF (USA) and NINS (Japan), together with NRC (Canada), MOST and ASIAA (Taiwan), and KASI (Republic of Korea), in cooperation with the Republic of Chile. The Joint ALMA Observatory is operated by ESO, AUI/NRAO, and NAOJ. The National Radio Astronomy Observatory is a facility of the National Science Foundation operated under cooperative agreement by Associated Universities, Inc.
Appendix A CS (5-4) channel maps
Figure A.1 shows a selection of channel maps from the CS (5-4) (Eu = 35.26 K) line emission, which traces the CO outflow discovered by Alves et al. (2017) as well as part of the elongated structures discovered by Evans et al. (2023) and analyzed in this work.
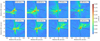 |
Fig. A.1 CS (5-4) channel maps: the velocity of the channel is indicated in the panel at the top right corner of each map. The dashed black line delineates the cavity of the CO outflow of Alves et al. (2017), and the red and blue dashed lines indicate the regions where the redshifted and blueshifted elongated structures are found, respectively. The synthesized beam size is of 0.49″×0.42″. |
References
- Alves, F. O., Girart, J. M., Caselli, P., et al. 2017, A&A, 603, L3 [NASA ADS] [CrossRef] [EDP Sciences] [Google Scholar]
- Alves, F. O., Girart, J. M., Padovani, M., et al. 2018, A&A, 616, A56 [NASA ADS] [CrossRef] [EDP Sciences] [Google Scholar]
- Alves, F. O., Caselli, P., Girart, J. M., et al. 2019, Science, 366, 90 [NASA ADS] [CrossRef] [Google Scholar]
- Anderson, J. M., Li, Z.-Y., Krasnopolsky, R., & Blandford, R. D. 2003, ApJ, 590, L107 [Google Scholar]
- Bally, J. 2016, ARA&A, 54, 491 [Google Scholar]
- Bate, M. R. 2018, MNRAS, 475, 5618 [Google Scholar]
- Beuther, H., Schilke, P., Gueth, F., et al. 2002, A&A, 387, 931 [NASA ADS] [CrossRef] [EDP Sciences] [Google Scholar]
- Bianchi, E., Chandler, C. J., Ceccarelli, C., et al. 2020, MNRAS, 498, L87 [NASA ADS] [CrossRef] [Google Scholar]
- Bonnell, I. A., & Bate, M. R. 1994, MNRAS, 271, 999 [NASA ADS] [CrossRef] [Google Scholar]
- Brooke, T. Y., Huard, T. L., Bourke, T. L., et al. 2007, ApJ, 655, 364 [NASA ADS] [CrossRef] [Google Scholar]
- Caselli, P., Hartquist, T. W., & Havnes, O. 1997, A&A, 322, 296 [NASA ADS] [Google Scholar]
- Ceppi, S., Cuello, N., Lodato, G., et al. 2022, MNRAS, 514, 906 [CrossRef] [Google Scholar]
- Codella, C., Ceccarelli, C., Chandler, C., et al. 2021, Front. Astron. Space Sci., 8, 227 [NASA ADS] [CrossRef] [Google Scholar]
- Codella, C., Podio, L., De Simone, M., et al. 2024, MNRAS, 528, 7383 [NASA ADS] [CrossRef] [Google Scholar]
- Czekala, I., Chiang, E., Andrews, S. M., et al. 2019, ApJ, 883, 22 [NASA ADS] [CrossRef] [Google Scholar]
- De Simone, M., Ceccarelli, C., Codella, C., et al. 2020, ApJ, 896, L3 [NASA ADS] [CrossRef] [Google Scholar]
- de Valon, A., Dougados, C., Cabrit, S., et al. 2022, A&A, 668, A78 [NASA ADS] [CrossRef] [EDP Sciences] [Google Scholar]
- Dierickx, M., Jiménez-Serra, I., Rivilla, V. M., & Zhang, Q. 2015, ApJ, 803, 89 [Google Scholar]
- Duffell, P. C., D’Orazio, D., Derdzinski, A., et al. 2020, ApJ, 901, 25 [NASA ADS] [CrossRef] [Google Scholar]
- Dzib, S. A., Loinard, L., Ortiz-León, G. N., Rodríguez, L. F., & Galli, P. A. B. 2018, ApJ, 867, 151 [Google Scholar]
- Evans, L., Vastel, C., Fontani, F., et al. 2023, A&A, 678, A160 [NASA ADS] [CrossRef] [EDP Sciences] [Google Scholar]
- Forbrich, J., Lada, C. J., Muench, A. A., Alves, J., & Lombardi, M. 2009, ApJ, 704, 292 [NASA ADS] [CrossRef] [Google Scholar]
- Frank, A., Ray, T. P., Cabrit, S., et al. 2014, in Protostars and Planets VI, eds. H. Beuther, R. S. Klessen, C. P. Dullemond, & T. Henning, 451 [Google Scholar]
- Gusdorf, A., Pineau Des Forêts, G., Cabrit, S., & Flower, D. R. 2008, A&A, 490, 695 [NASA ADS] [CrossRef] [EDP Sciences] [Google Scholar]
- Hara, C., Shimajiri, Y., Tsukagoshi, T., et al. 2013, ApJ, 771, 128 [CrossRef] [Google Scholar]
- Hara, C., Kawabe, R., Nakamura, F., et al. 2021, ApJ, 912, 34 [NASA ADS] [CrossRef] [Google Scholar]
- Hirano, S., Aikawa, Y., & Machida, M. N. 2025, ApJ, 982, 166 [Google Scholar]
- Hsieh, C.-H., Lai, S.-P., Cheong, P.-I., et al. 2020, ApJ, 894, 23 [NASA ADS] [CrossRef] [Google Scholar]
- Hsieh, C.-H., Arce, H. G., Li, Z.-Y., et al. 2023, ApJ, 947, 25 [NASA ADS] [CrossRef] [Google Scholar]
- Irvine, W. M., Goldsmith, P. F., & Hjalmarson, A. 1987, in Interstellar Processes, 134, eds. D. J. Hollenbach, J. Thronson, & A. Harley, 561 [Google Scholar]
- Jiménez-Serra, I., Martín-Pintado, J., Rodríguez-Franco, A., & Marcelino, N. 2004, ApJ, 603, L49 [CrossRef] [Google Scholar]
- Jiménez-Serra, I., Caselli, P., Martín-Pintado, J., & Hartquist, T. W. 2008, A&A, 482, 549 [NASA ADS] [CrossRef] [EDP Sciences] [Google Scholar]
- Kido, M., Takakuwa, S., Saigo, K., et al. 2023, ApJ, 953, 190 [NASA ADS] [CrossRef] [Google Scholar]
- Lee, C.-F. 2020, A&A Rev., 28, 1 [NASA ADS] [CrossRef] [Google Scholar]
- Martín, S., Martín-Pintado, J., Blanco-Sánchez, C., et al. 2019, A&A, 631, A159 [Google Scholar]
- Martin-Pintado, J., Bachiller, R., & Fuente, A. 1992, A&A, 254, 315 [NASA ADS] [Google Scholar]
- Maureira, M. J., Pineda, J. E., Segura-Cox, D. M., et al. 2020, ApJ, 897, 59 [NASA ADS] [CrossRef] [Google Scholar]
- Milam, S. N., Savage, C., Brewster, M. A., Ziurys, L. M., & Wyckoff, S. 2005, ApJ, 634, 1126 [Google Scholar]
- Murillo, N. M., van Dishoeck, E. F., van der Wiel, M. H. D., et al. 2018, A&A, 617, A120 [NASA ADS] [CrossRef] [EDP Sciences] [Google Scholar]
- Nguyen-Lu’o’ng, Q., Motte, F., Carlhoff, P., et al. 2013, ApJ, 775, 88 [CrossRef] [Google Scholar]
- Offner, S. S. R., Kratter, K. M., Matzner, C. D., Krumholz, M. R., & Klein, R. I. 2010, ApJ, 725, 1485 [Google Scholar]
- Offner, S. S. R., Moe, M., Kratter, K. M., et al. 2023, in Protostars and Planets VII, eds. S. Inutsuka, Y. Aikawa, T. Muto, K. Tomida, & M. Tamura, Astronomical Society of the Pacific Conference Series, 534, 275 [Google Scholar]
- Ohashi, S., Codella, C., Sakai, N., et al. 2022, ApJ, 927, 54 [NASA ADS] [CrossRef] [Google Scholar]
- Okoda, Y., Oya, Y., Francis, L., et al. 2021, ApJ, 910, 11 [CrossRef] [Google Scholar]
- Oya, Y., Sakai, N., López-Sepulcre, A., et al. 2016, ApJ, 824, 88 [Google Scholar]
- Pety, J., Teyssier, D., Fossé, D., et al. 2005, A&A, 435, 885 [NASA ADS] [CrossRef] [EDP Sciences] [Google Scholar]
- Pineda, J. E., Segura-Cox, D., Caselli, P., et al. 2020, Nat. Astron., 4, 1158 [NASA ADS] [CrossRef] [Google Scholar]
- Pineda, J. E., Arzoumanian, D., Andre, P., et al. 2023, in Protostars and Planets VII, eds. S. Inutsuka, Y. Aikawa, T. Muto, K. Tomida, & M. Tamura, Astronomical Society of the Pacific Conference Series, 534, 233 [NASA ADS] [Google Scholar]
- Podio, L., Tabone, B., Codella, C., et al. 2021, A&A, 648, A45 [NASA ADS] [CrossRef] [EDP Sciences] [Google Scholar]
- Ray, T. P., & Ferreira, J. 2021, New A Rev., 93, 101615 [NASA ADS] [CrossRef] [Google Scholar]
- Rodríguez, L. F., Porras, A., Claussen, M. J., et al. 2003, ApJ, 586, L137 [CrossRef] [Google Scholar]
- Sakai, N., & Yamamoto, S. 2013, Chem. Rev., 113, 8981 [Google Scholar]
- Sakai, N., Sakai, T., Hirota, T., et al. 2014, Nature, 507, 78 [Google Scholar]
- Sandell, G., Reipurth, B., Vacca, W. D., & Bajaj, N. S. 2021, ApJ, 920, 7 [Google Scholar]
- Schilke, P., Walmsley, C. M., Pineau des Forets, G., & Flower, D. R. 1997, A&A, 321, 293 [NASA ADS] [Google Scholar]
- Shu, F. H. 1977, ApJ, 214, 488 [Google Scholar]
- Stahler, S. W., & Palla, F. 2004, The Formation of Stars (Wiley-VCH) [Google Scholar]
- Terebey, S., Shu, F. H., & Cassen, P. 1984, ApJ, 286, 529 [Google Scholar]
- Tychoniec, Ł., van Dishoeck, E. F., van’t Hoff, M. L. R., et al. 2021, A&A, 655, A65 [NASA ADS] [CrossRef] [EDP Sciences] [Google Scholar]
- van der Wiel, M. H. D., Jacobsen, S. K., Jørgensen, J. K., et al. 2019, A&A, 626, A93 [NASA ADS] [CrossRef] [EDP Sciences] [Google Scholar]
- van Gelder, M. L., Tabone, B., van Dishoeck, E. F., & Godard, B. 2021, A&A, 653, A159 [CrossRef] [EDP Sciences] [Google Scholar]
- Vastel, C., Alves, F., Ceccarelli, C., et al. 2022, A&A, 664, A171 [NASA ADS] [CrossRef] [EDP Sciences] [Google Scholar]
- Vastel, C., Sakai, T., Ceccarelli, C., et al. 2024, A&A, 684, A189 [NASA ADS] [CrossRef] [EDP Sciences] [Google Scholar]
- Wilson, T. L., & Rood, R. 1994, ARA&A, 32, 191 [Google Scholar]
- Zhang, Y., Higuchi, A. E., Sakai, N., et al. 2018, ApJ, 864, 76 [NASA ADS] [CrossRef] [Google Scholar]
All Tables
Comparison between the outflow properties obtained from the tdyn method (Table 1) and from the PFT method (Hsieh et al. 2023).
All Figures
|
Fig. 1 Integrated-intensity maps of H13CO+ (top panels), CCH (middle), and c-C3H2 (bottom) in color scale and colored contours. The left panels correspond to redshifted velocities from the systemic velocity, vsys ~ 3.6 km s−1, and the right panels show blueshifted velocities. The ranges are specified in the text insets of each panel. Overlaid on all panels, we plot the 1.3 mm ALMA continuum (white contours) and the CO (3–2) integrated emission (black contours) from −2.0 to 9.2 km s−1. The H13CO+ and CCH contours are [−5,10,15,20] times the 1σ rms noise level, which is 1.0 mJy beam−1 km s−1 for both maps of H13CO+, and 1.1 mJy beam−1 km s−1 for both CCH maps. The c-C3H2 contours are [−5,3,5,7,10] times the 1σ rms noise level, which is 1.8 mJy beam−1 km s−1 for both maps. Negative contours are represented with dashed lines. CO (3–2) contours are [50,100,200] times the 1σ rms noise of 1.2 mJy beam−1 km s−1. The rms noise of the integrated-intensity maps has been measured before correcting for the primary beam response. The 1.3 mm continuum contours are [20,30,40,50,100, and 200] times the 1σ rms noise of 0.14 mJy beam−1. The dashed curve and arrows in the redshifted panels indicate the transition region between the elongated structure (east, outside the dashed curve) and the rotating envelope (west, delineated by the dashed curve). The red and blue polygons cover the area used to obtain the PV diagrams shown in Figure 3. The synthesized beam sizes are 0.34″ × 0.33″ for the continuum emission, 0.13″ × 0.10″ for CO (3–2), 0.46″ × 0.39″ for H13CO+ and CCH, and 0.42″ × 0.39″ for c-C3H2. The beam ellipses for the H13CO+, CCH and c-C3H2 maps are plotted in the bottom left corner of the corresponding panels. The center of the images is at α(2000)=17h11m23.125s, δ(2000)=−27°24′32.87″. |
| In the text | |
|
Fig. 2 Left: SiO moment 0 map (color map and black contours) overlaid with white contours from the continuum and red and blue contours from the moment 0 maps of H13CO+. The velocity ranges are indicated in the panels. The SiO contours are [−5,3,5,7] times the rms noise value of 5.0 mJy beam−1 km s−1, with negative contours shown as dashed lines. The H13CO+ contours are [−5,10,15] times the 1σ rms noise level of 1.0 mJy beam−1 km s−1. The continuum contours are the same as in Figure 1. Right: Continuum (black contours) and integrated-intensity maps of SiO (color map and colored contours) in the area covered by the square in the left panel. The contour levels are the same as in the left panel for rms noise values of 3.5 mJy beam−1 km s−1 for the blue- and redshifted integrated SiO emission. The synthesized beam sizes of 0.43×0.39″ for SiO and 0.34×0.33″ for the continuum are represented with the ellipse in the bottom left corners with the same color as the corresponding contours. The rms noise of the integrated-intensity maps has been measured before correcting for the primary beam response. The range of the color scale has been expanded with respect to Fig. 1 for better visualization of the SiO emission. |
| In the text | |
|
Fig. 3 Position-velocity diagrams of the H13CO+ (top panels), CCH (middle), and c-C3H2 (bottom) emission from the areas highlighted in Figure 1. The left panels show the redshifted emission of the putative second outflow, and the right panels show the blueshifted emission counterparts. The dashed lines represent the systemic velocity of the source, vsys ~ 3.6 km s−1. The arrows in the redshifted panels correspond to the transition between the rotating envelope and the outflowing gas, as also specified in Fig. 1. We employed a logarithmic color scale to emphasize the shape of the velocity curve of the outflowing gas. |
| In the text | |
|
Fig. 4 Position-velocity diagrams of the H13CO+ emission along the transversal direction of the outflow. In the left panel, we show the redshifted H13CO+ and CO (3–2) integrated-intensity maps using the same contours and velocity ranges as in Fig. 1. The dashed lines in the left panel represent the cuts separated by 1″ that were used to obtain the PV diagrams reported in the right panels. The contours in the PV diagrams are [0.4, 0.6, and 0.8] times the peak intensity of the image, which is 0.05 Jy beam−1 for every panel. The negative offsets refer to the northern part of the outflow. The dotted lines in the PV diagrams indicate the systemic velociy of the source, vsys ~ 3.6 km s−1. The text insets in both panels show the offset of each cut from the rightmost cut, which corresponds to an offset of 0″. |
| In the text | |
|
Fig. 5 Properties of the rotation of the outflow derived from the transversal PV diagrams of the H13CO+ redshifted emission (Fig. 4) at different offsets z, with z increasing away from the central star. Rout represents the radius of the outflow, Rmed is the deviation from the chosen outflow axis, Vmed is the median line-of-sight velocity, Vrot is the rotation velocity of the outflow, and RoutVrot is the specific angular momentum of the outflow. All quantities are defined in Sect. 3.3.2. The error bars are computed from the synthesized beam size of ~0.4″ and the spectral resolution is 0.14 km s−1. The dotted line in panel b corresponds to a value of 0″. The dotted lines and shadowed areas in panels c and e represent the mean value and standard deviation of the points, respectively. |
| In the text | |
|
Fig. 6 Contours of 0.6 times the maximum value of the PV diagrams from Figure 4. The colors represent different offsets along the outflow, as indicated by the text insets. The dotted black line corresponds to the systemic velocity, vsys ~ 3.6 km s−1, and the dotted gray line shows the mean velocity of the velocity curves, 4.08 km s−1. The solid black curves correspond to a constant specific angular momentum of 70 ± 25 au km s−1 for a central velocity of 4.08 km s−1, where the gray curves represent the limits of the error interval. |
| In the text | |
|
Fig. 7 Sketch (not to scale) of the proposed interpretation of the observations toward [BHB2007] 11 where a second outflow is found in addition to the CO outflow reported by Alves et al. (2017). The ellipses at the center represent the flattened envelope. The innermost contour represents the circumbinary disk, where the two stars of the system are represented by the stars. The inner ellipse represents the continuum contours from Figures 1 and 2, where the spiral structures seen in Alves et al. (2017) are emphasized. The tips of these spiral structures are the landing sites of the accretion from the envelope (blue and red arrows) and the launching points of the CO outflow (Alves et al. 2017). We marked the CO outflow from Alves et al. (2017) as Outflow 1, while the new proposed outflow inferred from the observations in this work is named Outflow 2. The launching point of Outflow 2 is unknown, and we draw it from the edge of the circumbinary disk. The SiO emission is represented with the thick contour at the center, corresponding to the 3σ contour from the left panel of Figure 2. The different molecular tracers used to identify each component of the system are overplotted on the sketch in the corresponding part. The rotation axes are indicated with the dashed lines. Blue and red represent blue- and redshifted velocities, respectively. |
| In the text | |
|
Fig. A.1 CS (5-4) channel maps: the velocity of the channel is indicated in the panel at the top right corner of each map. The dashed black line delineates the cavity of the CO outflow of Alves et al. (2017), and the red and blue dashed lines indicate the regions where the redshifted and blueshifted elongated structures are found, respectively. The synthesized beam size is of 0.49″×0.42″. |
| In the text | |
Current usage metrics show cumulative count of Article Views (full-text article views including HTML views, PDF and ePub downloads, according to the available data) and Abstracts Views on Vision4Press platform.
Data correspond to usage on the plateform after 2015. The current usage metrics is available 48-96 hours after online publication and is updated daily on week days.
Initial download of the metrics may take a while.