Fig. 6
Download original image
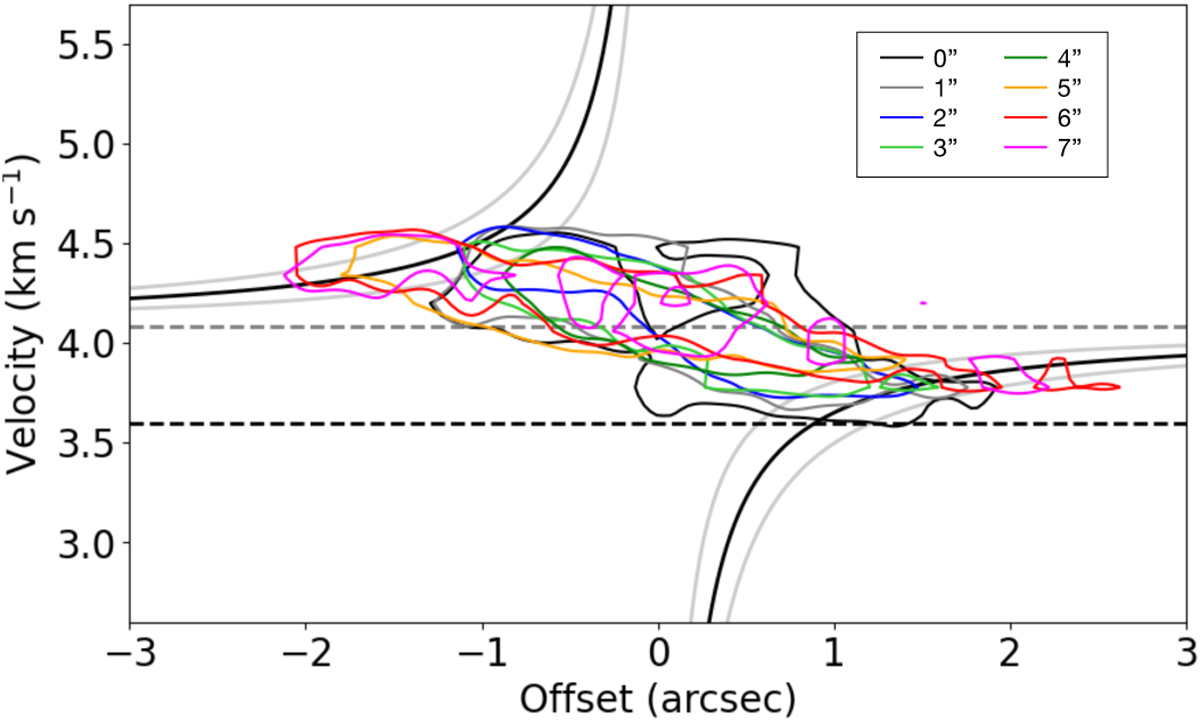
Contours of 0.6 times the maximum value of the PV diagrams from Figure 4. The colors represent different offsets along the outflow, as indicated by the text insets. The dotted black line corresponds to the systemic velocity, vsys ~ 3.6 km s−1, and the dotted gray line shows the mean velocity of the velocity curves, 4.08 km s−1. The solid black curves correspond to a constant specific angular momentum of 70 ± 25 au km s−1 for a central velocity of 4.08 km s−1, where the gray curves represent the limits of the error interval.
Current usage metrics show cumulative count of Article Views (full-text article views including HTML views, PDF and ePub downloads, according to the available data) and Abstracts Views on Vision4Press platform.
Data correspond to usage on the plateform after 2015. The current usage metrics is available 48-96 hours after online publication and is updated daily on week days.
Initial download of the metrics may take a while.