Fig. 3
Download original image
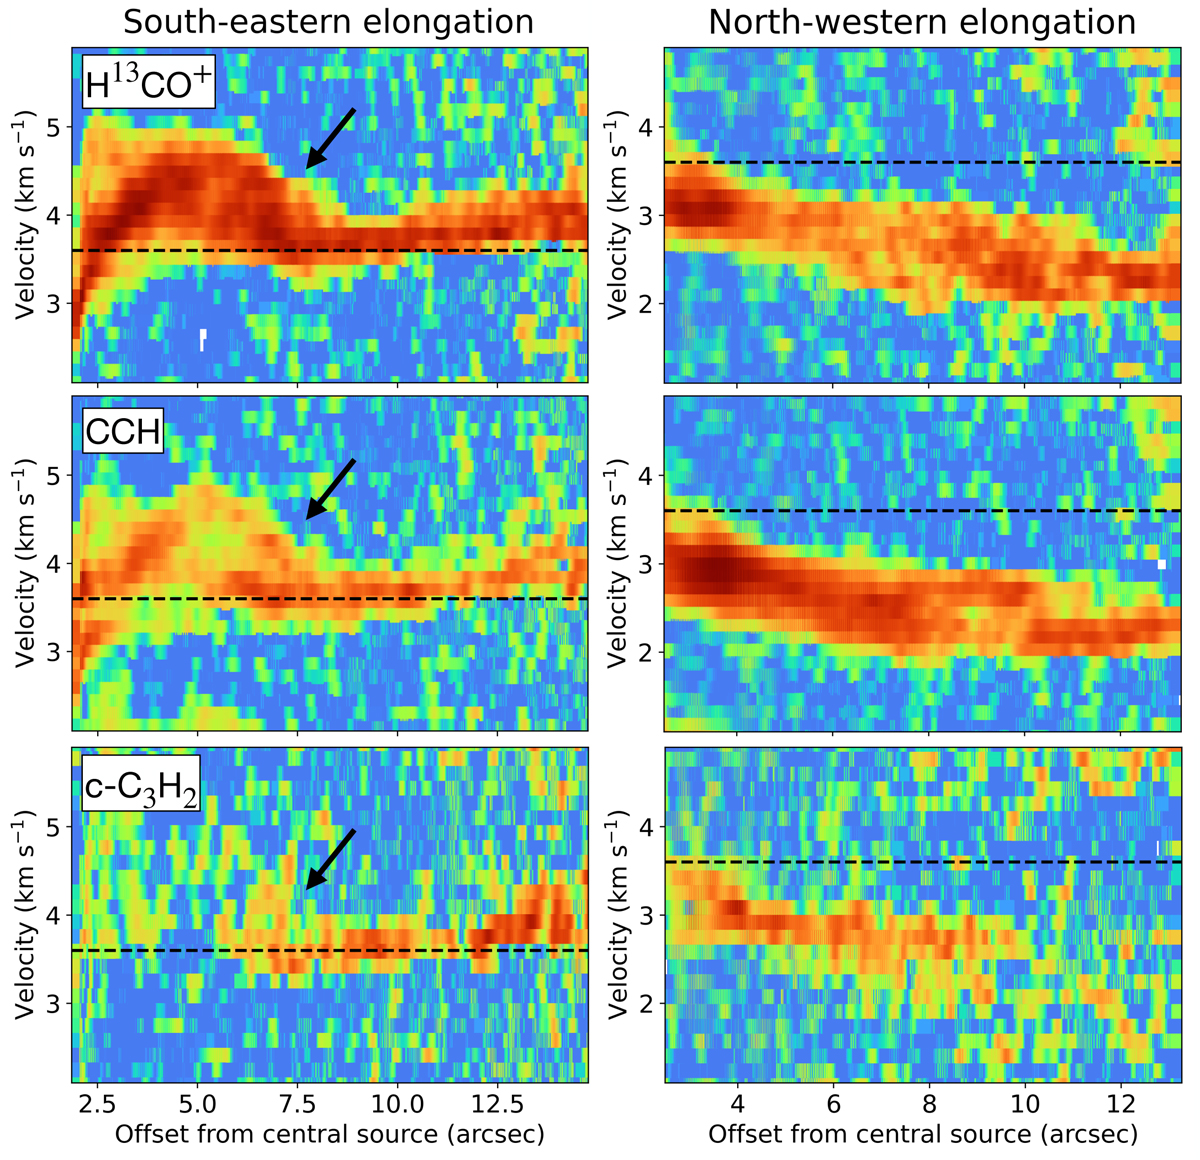
Position-velocity diagrams of the H13CO+ (top panels), CCH (middle), and c-C3H2 (bottom) emission from the areas highlighted in Figure 1. The left panels show the redshifted emission of the putative second outflow, and the right panels show the blueshifted emission counterparts. The dashed lines represent the systemic velocity of the source, vsys ~ 3.6 km s−1. The arrows in the redshifted panels correspond to the transition between the rotating envelope and the outflowing gas, as also specified in Fig. 1. We employed a logarithmic color scale to emphasize the shape of the velocity curve of the outflowing gas.
Current usage metrics show cumulative count of Article Views (full-text article views including HTML views, PDF and ePub downloads, according to the available data) and Abstracts Views on Vision4Press platform.
Data correspond to usage on the plateform after 2015. The current usage metrics is available 48-96 hours after online publication and is updated daily on week days.
Initial download of the metrics may take a while.