Fig. 4
Download original image
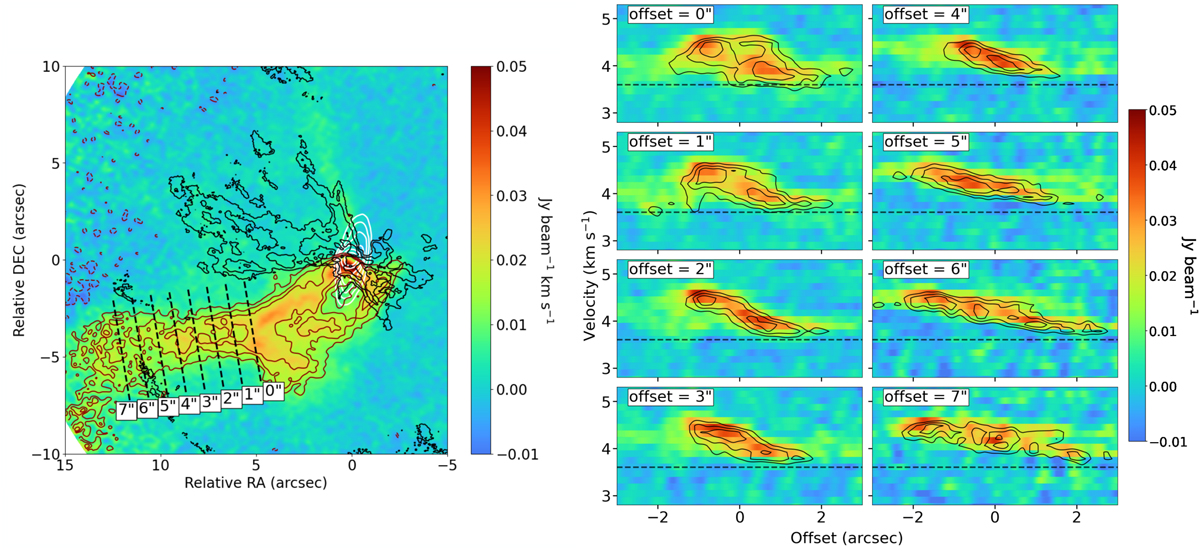
Position-velocity diagrams of the H13CO+ emission along the transversal direction of the outflow. In the left panel, we show the redshifted H13CO+ and CO (3–2) integrated-intensity maps using the same contours and velocity ranges as in Fig. 1. The dashed lines in the left panel represent the cuts separated by 1″ that were used to obtain the PV diagrams reported in the right panels. The contours in the PV diagrams are [0.4, 0.6, and 0.8] times the peak intensity of the image, which is 0.05 Jy beam−1 for every panel. The negative offsets refer to the northern part of the outflow. The dotted lines in the PV diagrams indicate the systemic velociy of the source, vsys ~ 3.6 km s−1. The text insets in both panels show the offset of each cut from the rightmost cut, which corresponds to an offset of 0″.
Current usage metrics show cumulative count of Article Views (full-text article views including HTML views, PDF and ePub downloads, according to the available data) and Abstracts Views on Vision4Press platform.
Data correspond to usage on the plateform after 2015. The current usage metrics is available 48-96 hours after online publication and is updated daily on week days.
Initial download of the metrics may take a while.