Fig. A.1
Download original image
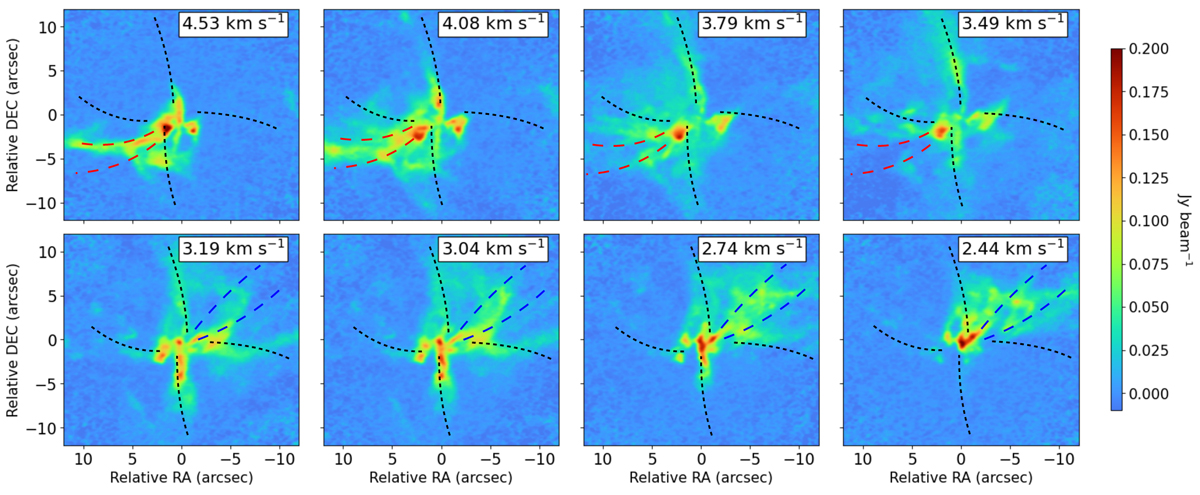
CS (5-4) channel maps: the velocity of the channel is indicated in the panel at the top right corner of each map. The dashed black line delineates the cavity of the CO outflow of Alves et al. (2017), and the red and blue dashed lines indicate the regions where the redshifted and blueshifted elongated structures are found, respectively. The synthesized beam size is of 0.49″×0.42″.
Current usage metrics show cumulative count of Article Views (full-text article views including HTML views, PDF and ePub downloads, according to the available data) and Abstracts Views on Vision4Press platform.
Data correspond to usage on the plateform after 2015. The current usage metrics is available 48-96 hours after online publication and is updated daily on week days.
Initial download of the metrics may take a while.