Fig. 2
Download original image
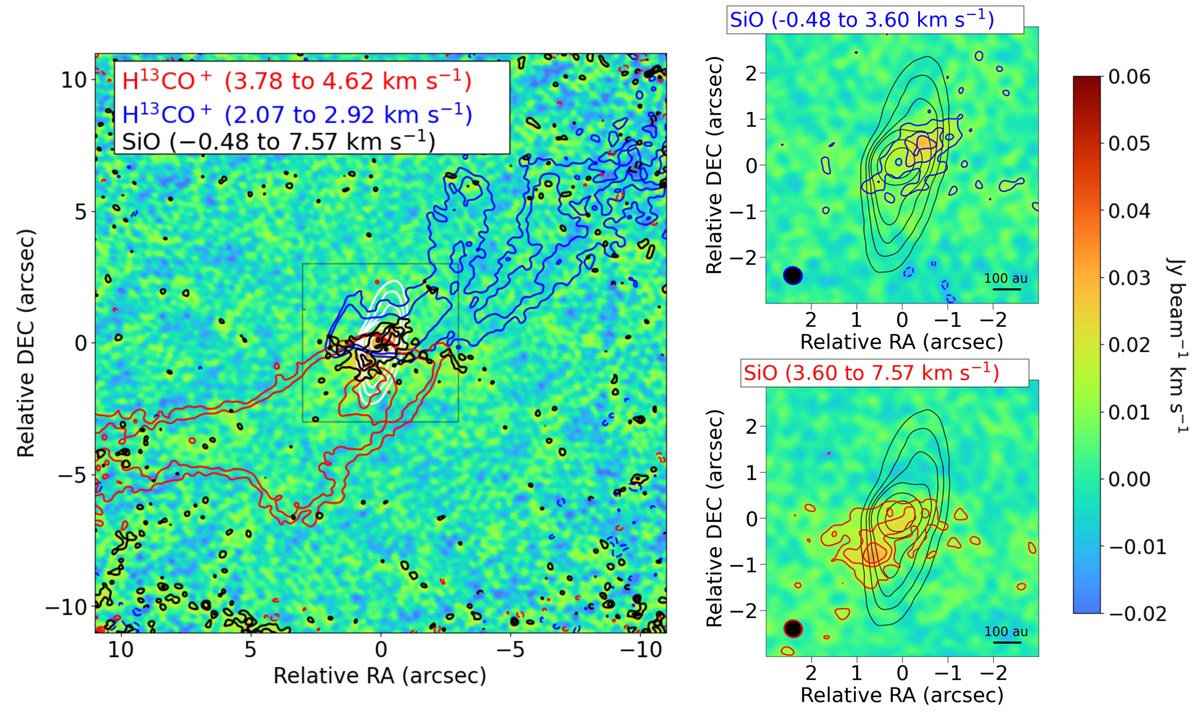
Left: SiO moment 0 map (color map and black contours) overlaid with white contours from the continuum and red and blue contours from the moment 0 maps of H13CO+. The velocity ranges are indicated in the panels. The SiO contours are [−5,3,5,7] times the rms noise value of 5.0 mJy beam−1 km s−1, with negative contours shown as dashed lines. The H13CO+ contours are [−5,10,15] times the 1σ rms noise level of 1.0 mJy beam−1 km s−1. The continuum contours are the same as in Figure 1. Right: Continuum (black contours) and integrated-intensity maps of SiO (color map and colored contours) in the area covered by the square in the left panel. The contour levels are the same as in the left panel for rms noise values of 3.5 mJy beam−1 km s−1 for the blue- and redshifted integrated SiO emission. The synthesized beam sizes of 0.43×0.39″ for SiO and 0.34×0.33″ for the continuum are represented with the ellipse in the bottom left corners with the same color as the corresponding contours. The rms noise of the integrated-intensity maps has been measured before correcting for the primary beam response. The range of the color scale has been expanded with respect to Fig. 1 for better visualization of the SiO emission.
Current usage metrics show cumulative count of Article Views (full-text article views including HTML views, PDF and ePub downloads, according to the available data) and Abstracts Views on Vision4Press platform.
Data correspond to usage on the plateform after 2015. The current usage metrics is available 48-96 hours after online publication and is updated daily on week days.
Initial download of the metrics may take a while.