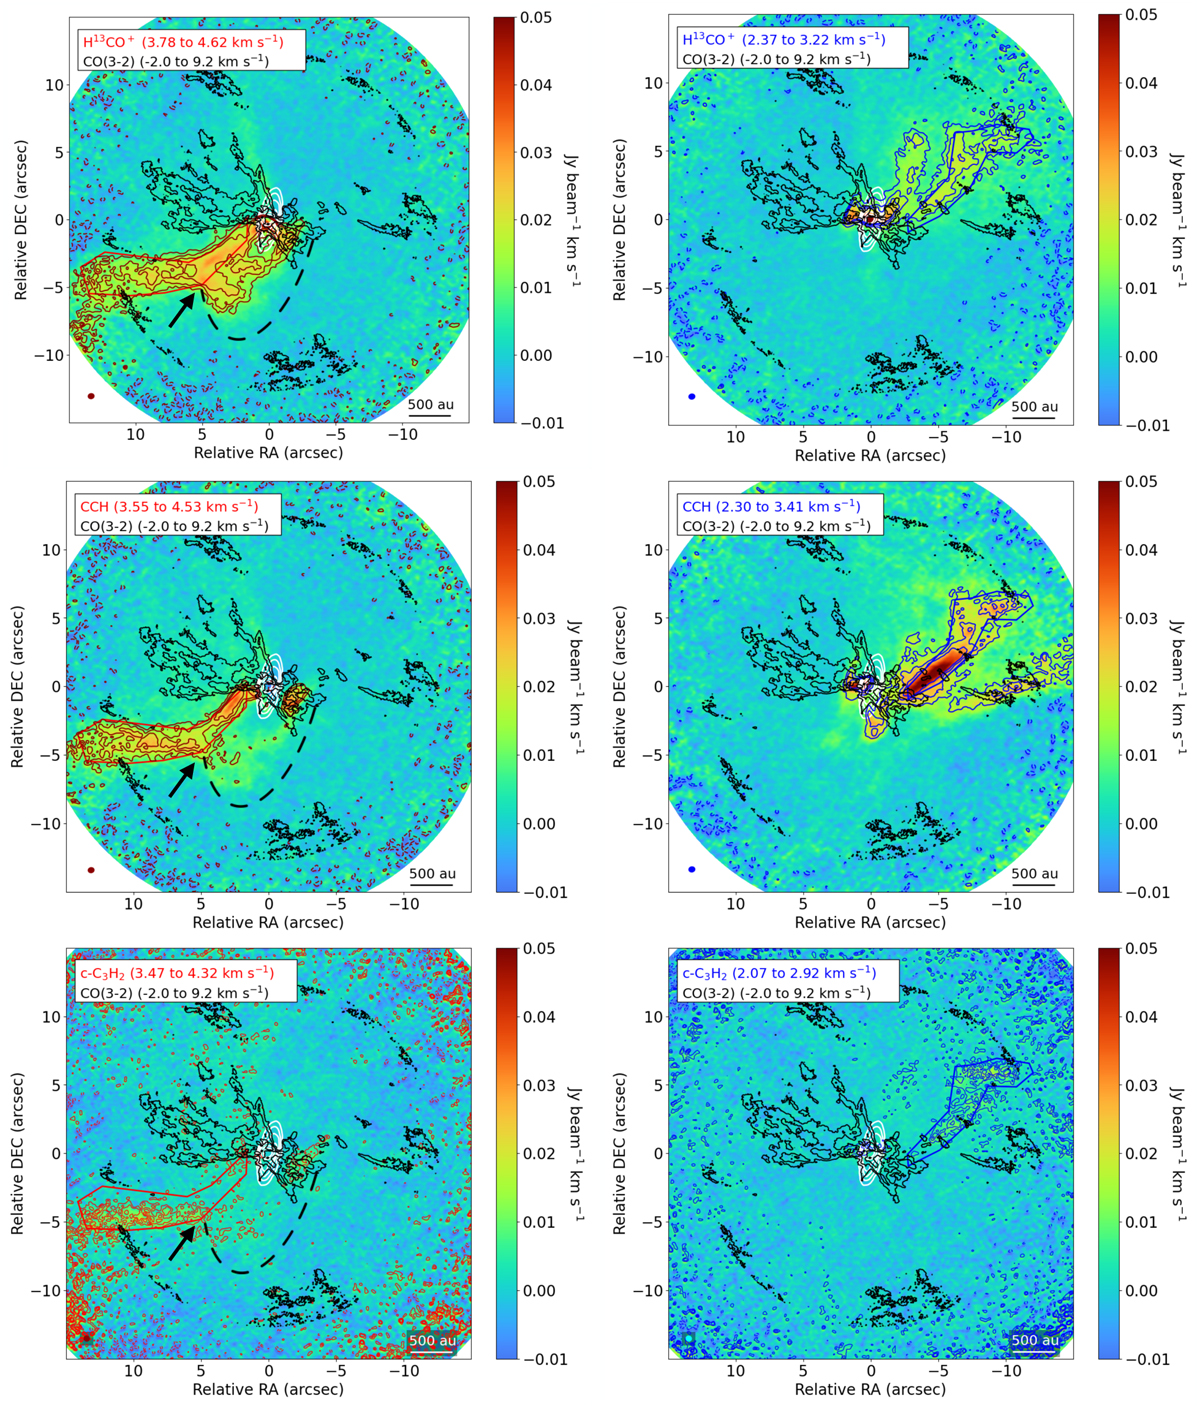
Fig. 1
Download original image
Integrated-intensity maps of H13CO+ (top panels), CCH (middle), and c-C3H2 (bottom) in color scale and colored contours. The left panels correspond to redshifted velocities from the systemic velocity, vsys ~ 3.6 km s−1, and the right panels show blueshifted velocities. The ranges are specified in the text insets of each panel. Overlaid on all panels, we plot the 1.3 mm ALMA continuum (white contours) and the CO (3–2) integrated emission (black contours) from −2.0 to 9.2 km s−1. The H13CO+ and CCH contours are [−5,10,15,20] times the 1σ rms noise level, which is 1.0 mJy beam−1 km s−1 for both maps of H13CO+, and 1.1 mJy beam−1 km s−1 for both CCH maps. The c-C3H2 contours are [−5,3,5,7,10] times the 1σ rms noise level, which is 1.8 mJy beam−1 km s−1 for both maps. Negative contours are represented with dashed lines. CO (3–2) contours are [50,100,200] times the 1σ rms noise of 1.2 mJy beam−1 km s−1. The rms noise of the integrated-intensity maps has been measured before correcting for the primary beam response. The 1.3 mm continuum contours are [20,30,40,50,100, and 200] times the 1σ rms noise of 0.14 mJy beam−1. The dashed curve and arrows in the redshifted panels indicate the transition region between the elongated structure (east, outside the dashed curve) and the rotating envelope (west, delineated by the dashed curve). The red and blue polygons cover the area used to obtain the PV diagrams shown in Figure 3. The synthesized beam sizes are 0.34″ × 0.33″ for the continuum emission, 0.13″ × 0.10″ for CO (3–2), 0.46″ × 0.39″ for H13CO+ and CCH, and 0.42″ × 0.39″ for c-C3H2. The beam ellipses for the H13CO+, CCH and c-C3H2 maps are plotted in the bottom left corner of the corresponding panels. The center of the images is at α(2000)=17h11m23.125s, δ(2000)=−27°24′32.87″.
Current usage metrics show cumulative count of Article Views (full-text article views including HTML views, PDF and ePub downloads, according to the available data) and Abstracts Views on Vision4Press platform.
Data correspond to usage on the plateform after 2015. The current usage metrics is available 48-96 hours after online publication and is updated daily on week days.
Initial download of the metrics may take a while.