| Issue |
A&A
Volume 699, July 2025
|
|
|---|---|---|
| Article Number | A84 | |
| Number of page(s) | 20 | |
| Section | Planets, planetary systems, and small bodies | |
| DOI | https://doi.org/10.1051/0004-6361/202554497 | |
| Published online | 10 July 2025 | |
Shock effects of Fa50 iron-rich olivine: Spectral and microstructural implications for Mars and Phobos
1
Research Center for Planetary Science, College of Earth and Planetary Sciences, Chengdu University of Technology,
Chengdu
610059,
PR
China
2
Chinese Academy of Sciences Center for Excellence in Comparative Planetology,
Hefei
230026,
PR
China
3
Institute of Atomic and Molecular Physics, Sichuan University,
Chengdu
610065,
PR
China
4
State Key Laboratory of Space Weather, National Space Science Center, Chinese Academy of Sciences,
Beijing
101499,
PR
China
5
Center for High Pressure Science and Technology Advanced Research,
Beijing
100193,
PR
China
6
State Key Laboratory of Ore Deposit Geochemistry, Institute of Geochemistry, Chinese Academy of Sciences,
Guiyang
550081,
PR
China
7
Key Laboratory of Earth and Planetary Physics, Institute of Geology and Geophysics, Chinese Academy of Sciences,
Beijing
100029,
PR
China
8
Nanjing Institute of Geology and Palaeontology, Chinese Academy of Sciences,
Nanjing
210008,
PR
China
★ Corresponding author: zhaoyuyan@cdut.edu.cn
Received:
12
March
2025
Accepted:
19
May
2025
Context. Global remote sensing and in situ investigations indicate that the Martian crust is enriched in iron, with olivine averaging an iron number (Fa#) of ~50. However, due to scarce terrestrial analogs, the shock behavior and preservation potential of Fe-rich olivine remain poorly constrained, limiting our ability to assess impact-induced mineralogical and spectral changes on Mars and potentially Phobos.
Aims. This study examines the microstructural and spectral modifications in Fa50 olivine induced by shock, offering insights into impact-driven alterations on Fe-rich planetary surfaces.
Methods. Shock recovery experiments were conducted on synthetic Fa50 olivine using one- and two-stage light gas guns at pressures of 18, 31, 41, and 47 GPa, corresponding to impact velocities between 0.89 and 1.95 km/s. Post-shock samples were analyzed using scanning electron microscopy (SEM), focused ion beam sectioning (FIB), and transmission electron microscopy (TEM) as well as Raman, visible-near-infrared (VNIR), and mid-infrared (MIR) spectroscopy to assess microstructural, compositional, and spectral modifications.
Results. Shocked Fa50 olivine exhibited systematic changes with increasing pressure. At ≥31 GPa, Fe migrated to form a three-layer zoning pattern with nanoscale α-/γ-Fe particles and minor magnetite. Vesicles associated with dislocations and grain boundaries indicated localized gas release. Raman spectra showed progressive peak shifts, increasing separation, and the full width at half maximum (FWHM) broadening. VNIR spectra exhibited spectral bluing at 18 GPa, followed by reduced reflectance, redshifted and weakened absorption features at 31–47 GPa. MIR spectra showed pressure-dependent shifts in the Christiansen feature (CF) and Reststrahlen bands (RB1 and RB4), particularly at ≥31 GPa.
Conclusions. Natural impacts likely induce more extensive Fe migration and secondary particle growth than observed in laboratory simulations. On Mars, impacts into Fe-rich olivine may contribute surface redox changes independent of water. Nanoscale Fe0, magnetite, and vesicles formed on Fe-rich silicates may contribute to spectral reddening and localized bluing on Phobos and Deimos.
Key words: shock waves / methods: analytical / meteorites, meteors, meteoroids / planets and satellites: surfaces / planets and satellites: terrestrial planets
© The Authors 2025
 Open Access article, published by EDP Sciences, under the terms of the Creative Commons Attribution License (https://creativecommons.org/licenses/by/4.0), which permits unrestricted use, distribution, and reproduction in any medium, provided the original work is properly cited.
This article is published in open access under the Subscribe to Open model. Subscribe to A&A to support open access publication.
1 Introduction
Iron is the second most abundant metal element in the solar system and plays a crucial role in planetary crustal evolution. The surface of Mars, in particular, is highly enriched in iron, primarily in the form of olivine and pyroxene (Boynton et al. 2007). The OMEGA instrument on Mars Express has detected extensive olivine exposures along the hemispheric dichotomy boundary, in mid-to-low latitudes of the southern hemisphere, and within the rims and floors of impact craters (Hoefen et al. 2003; Hamilton & Christensen 2005; Mustard et al. 2005; McSween Jr et al. 2015). Thermal Emission Spectrometer (TES) data from Mars Global Surveyor indicate that these olivine grains are predominantly Fe-rich, with an approximately average Fa# (i.e., Fe molar fraction in Fe-Mg solid solution) of 50 (Bridges & Warren 2006; Koeppen & Hamilton 2008). Beyond Mars, silicates have also been identified on Martian moons and certain asteroids (Bibring et al. 1992). Numerical physical simulations of Phobos and Deimos suggested that they may have formed in situ from debris generated by giant impacts of Mars (Bagheri et al. 2021; Canup & Salmon 2018). This implies that the primordial building blocks of Phobos and Deimos could also contain iron-rich olivine, given its widespread presence in the Martian crust (Koeppen & Hamilton 2008). Visible-near infrared spectroscopic studies of S(I)-type asteroids indicate the likely presence of Fe-rich olivine ranging from Fa30 to Fa51 (Sanchez et al. 2014). However, due to the lack of systematic experimental studies and well-characterized analog samples, our understanding of the alteration processes Fe-rich olivine undergoes on planetary surfaces, particularly impact-induced phase transformations and spectral alterations, remains highly limited.
Martian meteorites, with olivine compositions ranging from Fa20 to Fa85, provide key insights into the shock-induced phase transformations of Fe-rich olivine (Warren 1994). high-pressure phases such as ringwoodite and wadsleyite have been identified in Martian meteorites, lunar samples, and ordinary chondrites, indicating shock pressures exceeding 25–30 GPa (Walton 2013; Miyahara et al. 2016). The nanoscale Fe-rich olivine phase allensite (Fa52), found in the Tissint meteorite, is estimated to have formed under >30 GPa and 1470–2100 K (Ma et al. 2016). Metastable phases such as ε*-olivine (Fa25) and ζ-phase olivine (Fa25–34) have been reported in shocked chondrites and Martian meteorites at 25–35 GPa, representing transitional products in incomplete phase transformations (Tomioka & Okuchi 2017; Van De Moortele et al. 2007a). Additionally, olivine decomposes into perovskite and magnesiowüstite near melting veins at ~25 GPa and ≥700 °C (Miyahara et al. 2011).
Previous experimental studies on Fe-rich olivine under high-pressure conditions have primarily focused on static high-pressure experiments. Laboratory studies have shown that forsterite (Fa10) undergoes a wadsleyite transition at ~14 GPa and 1400 °C, followed by transformation to ringwoodite at ~20 GPa and 1400 °C (Wu et al. 2012). Under even higher pressures (25 GPa, 1600 °C), forsterite decomposes into magnesite (MgO) and bridgmanite (MgSiO3), corresponding to the Earth’s mantle transition zone (Irifune et al. 1998). In contrast, pure fayalite (Fa100) transforms into ahrensite (γ-phase olivine) at only 6–7 GPa and 1740 K (Chanyshev et al. 2021), and decomposes into FeO and SiO2 at 25 GPa and 3000 °C (Bassett & Ming 1972). Due to the scarcity of intermediate Fe-content olivine samples, thermodynamic and first-principles calculations have been used to predict high-pressure phase equilibria across varying Fe compositions (Chanyshev et al. 2021). While significant progress has been made in understanding static high-pressure transformations of olivine, these results do not fully capture the rapid, nonequilibrium processes associated with planetary impacts.
Dynamic high-pressure studies using shock experiments provide a more realistic simulation of impact processes on planetary surfaces (King Jr et al. 1992; Kring et al. 2017). Currently, there are limited shock simulation studies on iron-rich olivine. Most existing research focuses on terrestrial samples dominated by forsterite, with occasional studies on fayalite. Light gas gun experiments have demonstrated that forsterite (Fa10) does not undergo phase transitions even at peak pressures of 65 GPa, but instead exhibits Raman spectral shifts and structural deformation (Chen et al. 2016; Harriss & Burchell 2016). Shock recovery experiments on terrestrial olivine (pure forsterite or Fa10) show that at 31 GPa, localized melting and fragmentation occur along shear planes (Obata et al. 2023), while at 60 GPa, the mid-infrared peak position shifts, indicating changes in Si-O vibrational frequencies (Stojic et al. 2021). Fayalite (Fa100), however, decomposes into FeO and SiO2 at 35 GPa, whereas forsterite remains stable under similar conditions (Syono et al. 1981; Chen et al. 2002). These studies indicate that Fe-rich olivine undergoes phase transformations and melting at lower pressures than Mg-rich olivine.
Despite advancements, key knowledge gaps remain regarding the shock response of Fe-rich olivine, particularly those with intermediate Fe-contents that represent the average Martian crust. Additionally, most previous studies have examined either spectral or microstructural changes, leading to a lack of correlation between spectroscopic signatures and microstructural transformations. To address these gaps, this study conducts shock recovery experiments on synthesized Fa50 olivine at four peak pressures (18, 31, 41, and 47 GPa). Detailed characterization is performed using a combination of visible-near-infrared (VNIR), Raman, and mid-infrared (MIR) spectroscopy along with scanning electron microscopy (SEM) analysis, focused ion beam (FIB) technology, and transmission electron microscopy (TEM) analysis. By bridging the compositional gap between forsterite and fayalite, this research provides insights into impactinduced modifications of Fe-rich olivine on Mars, Phobos, and asteroids, contributing to the interpretation of remote sensing data and the analysis of future returned samples.
2 Methods
2.1 Sample synthesis and processing
The fayalite endmember (Fa100) powders were synthesized from Fe2O3 and SiO2 powders with a molar ratio of 1:1.002 in one-atmosphere furnace. An excess of SiO2 was added to ensure the complete reduction of all Fe3+ to Fe2+. The procedure involved mixing powders with a particle size of <10 μm, reacting at 1410 K for 22 hours, followed by grinding and annealing at 1450 K for 44 hours (Zhao et al. 2009; Qi et al. 2021). Fa50 samples were synthesized by mixing the Fa100 powder with natural San Carlos olivine (Fa10). The mixture was ground to a particle size of <10 μm and annealed at 1670 K for 16 hours in one-atmosphere furnace. Then the synthetic Fa50 olivine samples were ground to powders, and further cold-pressed into Ni capsules and then hot-pressed for 2 to 12 h at 300 MPa and 1533 K, to prepare low-porosity, rock-like bulk Fa50 samples. Details of hot-pressing experiments can be found in Zhao et al. (2009) for anhydrous conditions. The synthetic Fa50 thus consisted of 41.6 wt% FeO, 23.3 wt% MgO, 33.2 wt% SiO2, 0.19 wt% Al2O3, 0.24 wt% CaO, 0.16 wt% MnO, and 0.08 wt% Ni (Xu et al. 2023).
The synthetic Fa50 samples were cut into semicircular slices with a thickness of 1 mm and a diameter of 12 mm using a diamond wire saw (Fig. A.1a). The cut slices were then affixed to a copper base, creating a circular surface suitable for shock recovery experiments (Fig. A.1b). The mounted samples were polished to a mirror-like finish using 2000-mesh SiC sandpaper. Finally, the samples were cleaned using ethanol with an ultrasonic cleaner and dried in a constant-temperature oven at 80 °C for 24 h.
2.2 Shock recovery experiments
Shock simulations were conducted using the light gas gun facility at the Institute of Atomic and Molecular Physics, Sichuan University. The samples were placed in copper sample holders, sealed with lids, and mounted within a stainless steel chamber designed to dissipate shock pressure. A 4 mm-thick copper flyer plate was attached to a sabot to assemble the projectile. The shock wave propagation process and underlying principles are detailed in Gan et al. (2021).
The projectile velocity (ω) was recorded on an oscilloscope via the electromagnetic method. In this study, projectile velocities ranged from 0.89 to 1.95 km/s in the four shock recovery experiments. The peak shock pressures and corresponding temperatures were calculated based on the physical parameters of the projectile and samples (Table A.1). Considering previous shock simulation studies on Mg-rich olivine and the maximum velocity limitations of two-stage light gas gun, shock recovery experiments were conducted at pressures of 18 GPa, 31 GPa, 41 GPa, and 47 GPa (Stojic et al. 2021; Obata et al. 2023). After the shock experiments, the top and side surfaces of the recovered copper sample holders were removed using lathe machining, and the containers were cut open with a saw to extract the samples (Figs. A.1c, A.1d). Water and heat were carefully avoided throughout the process to prevent any potential alteration of the samples. To minimize the influence of boundary effects potentially induced from shock impedance mismatch, samples for spectroscopic and microstructural analyses were collected from the central region of the recovered material.
2.3 Spectral analysis
Raman spectra for all the samples were acquired via a Renishaw inVia Raman spectrometer at the Institute of Geochemistry, Chinese Academy of Sciences (CAS). The laser wavelength was set to 532 nm and the spectral resolution is 0.1 cm−1. After calibrating the instrument to 520.5 cm−1 using a silicon standard (scan time of 1 s and a laser energy of 10%), the samples were analyzed with an integration time of 10 s and a laser energy of 5%. The samples were placed under a microscope connected to the spectrometer, and Raman data were collected from relatively flat surface regions to ensure consistency. The raw spectra were processed by baseline removal, smoothing, and averaging techniques, yielding the Raman spectra of Fa50 olivine under different shock pressures.
Mid-infrared reflectance (MIR) spectra for all the samples were obtained via a Thermo Fisher Scientific Nicolet IS50 FTIR spectrometer at the Institute of Geochemistry, CAS. Prior to sample measurement, the instrument was calibrated using a gold (Au) target. The spectral range was set to 400–4000 cm−1 with a resolution of 4 cm−1, and each spectrum was averaged over 256 scans to improve signal quality. Due to the presence of surface cracks observed under an optical microscope, the aperture was adjusted to 100 μm × 100 μm to avoid contamination from cracks and copper signals introduced during the shock experiments. The spectra were processed via baseline removal, smoothing, and averaging, providing the MIR reflectance spectra of initial Fa50 olivine and those at different shock pressures.
Visible-near infrared reflectance (VNIR) spectra for all samples were acquired using an IdeaOptics R1 angularly resolved spectrometer at the National Space Science Center, CAS. The wavelength range was set to 0.4 ~ 1.7 μm, with a spectral resolution of 20 nm. Measurements were performed using two spectrometers: a VIS spectrometer for 0.4–1.0 μm and an NIR spectrometer for 1.0–1.7 μm. The built-in light source was used at 100% intensity, with an integration time of 1500 ms. All the spectra were measured on the principal planes with a fixed incidence angle of 30° and an emission angle of 0°, resulting in a phase angle of 30°. A Labsphere Spectralon calibration panel with a nominal reflectance of 99% was used as a reflectance standard. Absolute reflectance spectra were obtained by dividing the sample brightness by the Spectralon brightness measured under identical illumination and measurement conditions, correcting for the inherent spectral properties (Yang et al. 2019). The reflectance spectra were calculated using the following formula:
![$\[R_{\text {sample }}(i, e, \lambda)=\frac{D N_{\text {sample }}-D N_{\text {background }}}{D N_{\text {spectralon }}-D N_{\text {background }}} \times R_{\text {spectralon }}(i, e, \lambda)\]$](/articles/aa/full_html/2025/07/aa54497-25/aa54497-25-eq1.png)
where i and e represent the incidence and emission angles, respectively, λ denotes the radiation wavelength, and DN refers to the digital number recorded by the spectrometer. After smoothing and averaging the VNIR reflectance data from multiple points on the samples, absolute VNIR reflectance spectra of Fa50 olivine at different shock pressures were obtained. The spectra were normalized at 700 nm following continuum removal.
2.4 Microscopic analysis
All micrometer-scale surface morphologies and compositions of the samples, both before and after impact, were determined via an FEI Scios dual-beam scanning electron microscope (SEM) at the Institute of Geochemistry, CAS. Sample morphology was observed in secondary electron (SE) mode at 15/20 kV, while the compositional analysis was conducted in back-scattered electron mode at 20 kV using energy-dispersive X-ray spectroscopy (EDS) with a working distance of 7 mm.
A focused ion beam (FIB) was used to extract cross-sections from regions of interest in the samples. This procedure was carried out on dual-beam SEM facilities. To protect the sample surface, a platinum (Pt) coating was firstly applied. Crosssections were extracted at a working distance of 5/7 mm and thinned to less than 100 nm via a Ga ion beam. All the FIB thin sections were prepared in three institutions, including Institute of Geochemistry, CAS, the Analytical and Testing Center of Guangzhou University of Technology, and the Nanjing Institute of Geology and Palaeontology, CAS.
The crystal structure and elemental composition of the FIB-prepared thin sections were analyzed using an FEI Talos F200X transmission electron microscope (TEM) at the Suzhou Institute of Nano-tech and Nano-bionics, CAS, operating at an accelerating voltage of 200 kV. Dark field (DF) imaging combined with EDS mapping was used to determine the distribution of elements with an atomic number greater than 3. The crystal structure of minerals was determined via selected area electron diffraction (SAED) or high-resolution transmission electron microscopy (HRTEM) in bright-field (BF) mode. By integrating the crystal structure and elemental composition data, high-pressure phase products at the nano- or microscale were identified.
Note that SEM observations were conducted on the upper surface of the solid sample, and FIB analysis was targeted at regions that exhibited the most significant features in the SEM images. This approach ensured that high-resolution analyses were focused on areas of greatest scientific interest. Additionally, the analyzed material was taken from the central portion of the recovered sample, which lies closest to the impact center and therefore approximates the stagnation point of the penetrating projectile, where pressure–temperature (P–T) conditions are expected to reach their maximum (Stöffler et al. 2018).
3 Results
3.1 SEM characteristics of the shocked samples
The color and morphology of post-shocked Fa50 olivine samples varied substantially under different shock pressure conditions (Fig. A.1). Under the naked eye, the unshocked sample appeared as a black, solid block. After impact, samples subjected to 18 GPa and 31 GPa exhibited substantial fragmentation, with the resulting powdered samples appearing greenish white. At higher shock pressures (41 GPa and 47 GPa), melting and agglomeration occurred, resulting in a predominantly dark appearance (Fig. A.1d).
SEM observations revealed distinct morphological changes across the four shock pressures (Fig. 1). The powdered greenish-white sample shocked at 18 GPa displayed a rough, “slag-like” surface under the SEM (Fig. 1b). At 31 GPa, the resultant two distinct regions (i.e., powdered greenish-white region versus melt dark region) (Fig. A.1d) were observed separately. The greenish-white region exhibited similar textures to those powdered samples observed at 18 GPa (data not shown). The melt dark region demonstrated abundant flocculent structures and evidence of melting-induced shrinkage features (Figs. 1c, 1d). The sample shocked at 41 GPa appeared as a dense block overall, with localized regions exhibiting strong shrinkage features due to melting (Fig. 1e). At 47 GPa, localized melting became more pronounced, resulting in the formation of numerous voids due to shrinkage (Fig. 1f).
Micron-scale fractures were observed in all samples. Lower shock pressures resulted in more visible fractures, whereas higher-pressure samples exhibited fewer externally visible fractures. This suggests that at higher shock pressures, fracturing may have become more localized within the mineral grains, leading to overall fragmentation and a reduction in surface-visible fractures. Consequently, FIB thin-section samples were extracted from the most prominently altered regions at each shock pressure condition to further investigate microstructural changes.
In addition, the molar Fe/(Fe+Mg)*100 (i.e., Fa#) of the impacted olivine samples were analyzed using SEM-EDS. Figure 2 illustrates the trends in Fa# variation across different shock pressures. The results indicate that the Fa# of the post-impact olivine increased at lower shock pressures (18 GPa and 31 GPa), corresponding to higher contrast features in BSE mode. In contrast, at higher shock pressures (47 GPa), Fa# of the post-impact olivine decreased, leading to lower contrast features in BSE mode. For the 41 GPa condition, insufficient data were obtained during SEM analysis, making it unavailable for comparison.
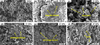 |
Fig. 1 Scanning electron microscope (SEM) images illustrating the morphological changes in olivine samples before and after impact. (a) Secondary electron (SE) image of unshocked Fa50 olivine, showing its original texture. (b) SE image of olivine shocked at 18 GPa, displaying a distinctive “slag-like” texture. (c) SE image of olivine shocked at 31 GPa (melt dark region), revealing the development of flocculent structures. The olivine displays loose, irregular features resembling floccules. (d) SE image of olivine shocked at 31 GPa (melt dark region), revealing the development of shrinkage structures. The olivine underwent a noticeable reduction in volume after impact, accompanied by surface wrinkling. (e) SE image of olivine shocked at 41 GPa, displaying pronounced shrinkage features. (f) SE image of olivine shocked at 47 GPa, showing intense shrinkage and melting, with conspicuous voids formed due to contraction. |
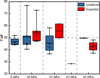 |
Fig. 2 Box plot of iron content in shocked olivine measured by SEMEDS. The blue and red boxes represent the interquartile ranges (25–75%) of the primary iron content in unshocked and shocked samples, respectively, under different shock pressures. The whiskers extending from the boxes represent the maximum and minimum iron content values. Diamond-shaped markers above the boxes denote individual iron content data points for olivine samples at different shock pressures, whereas the black horizontal lines indicate the mean iron content. No box is shown for the 41 GPa condition due to insufficient SEM data collected during measurements. |
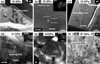 |
Fig. 3 Crystal defects in shocked minerals observed via TEM. (a) Bright-field (BF) TEM image of olivine shocked at 18 GPa, showing dislocations and dislocation lines within the crystal. The crystallographic direction of the operative vector (g) for parallel dislocations is (011). (b) High-resolution TEM (HRTEM) image and fast Fourier transform (FFT) pattern of the region outlined by the dashed box in image (a), identifying the mineral as fayalite after calibration. (c) BF TEM image of olivine shocked at 18 GPa, revealing dislocation loops within the olivine. (d) HRTEM image and selected area electron diffraction (SAED) pattern of a sample shocked at 31 GPa, identifying the mineral as augite, with stacking faults distributed perpendicular to the a-axis. (e) BF TEM image and SAED pattern of olivine shocked at 41 GPa, showing intersecting dislocations at nodes. (f) BF TEM image of olivine shocked at 47 GPa, where intersections of two or three different dislocations at nodes are observed. |
3.2 TEM characteristics of the impacted samples
3.2.1 Crystal structure defects
Under TEM observations, numerous linear defects (dislocations) were clearly visible within the shocked olivine, whereas planar defects (stacking faults) were found in augite grains (nominal composition Ca(Mg, Fe)Si2O6) that were sporadically observed in 18 GPa and 31 GPa shocked samples.
Due to lattice distortions near dislocations, substantial variations in diffraction contrast were observed in the TEM images (Fig. 3). The dislocations within the shocked olivine were categorized into four types based on their morphology: (1) parallel dislocations resulting from depth-of-field effects (Fig. 3a); (2) dislocations connected to form extended dislocation lines (Fig. 3a); (3) closed dislocation rings (Fig. 3c); and (4) intersecting dislocations forming nodes (Fig. 3f). Quantitative assessment of dislocation density was not conducted in this study due to our inability to conduct the EBSD analysis, which limits a systematic evaluation of its correlation with shock pressure. However, comparative TEM observations suggest that the shocked olivine grains contain a higher density of dislocations than the nearly defect-free starting material (data not shown). While plastic deformation is generally associated with increasing dislocation density at higher pressures (Tielke et al. 2022), such a trend could not be distinctly verified in our experimental samples based on qualitative observations.
Note that several lines of evidence suggest that the observed augite grains are not products of shock-related processes. First, the grains are euhedral and display well-developed crystallinity over a relatively large spatial extent (~6 μm), in contrast to the nanocrystalline, polycrystalline, or partially amorphous textures typically produced by shock-induced transformations (Tiwari et al. 2021). Second, sharp compositional boundaries between augite and adjacent olivine grains indicate minimal Fe-Mg inter-diffusion, inconsistent with solid-state reaction expected under shock conditions. Third, no residual silica or reaction rims were observed around the augite, which would typically accompany pyroxene formed through incomplete reaction between olivine and silica during shock. Finally, high-pressure polymorphs of olivine were not detected in the same samples (see Section 4.4 for details). Since augite can form via crystallization from melt following olivine breakdown under high-pressure conditions (Tiwari et al. 2021), the absence of such phases further argues against a shock origin. We therefore interpret these augite grains as products of localized reactions during the initial synthesis of the Fa50 starting material. The presence of ~0.24 wt% CaO in the synthetic bulk (Xu et al. 2023), likely derived from minor Ca contamination from the San Carlos olivine precursor, may have facilitated augite crystallization under high-temperature annealing conditions prior to shock loading.
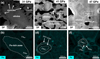 |
Fig. 4 Iron migration in minerals observed via TEM. (a and b) Dark-field (DF) TEM image and corresponding iron elemental mapping of olivine shocked at 31 GPa. A ring of vesicles is observed along the grain edges (a). The interior of the olivine is Fe-rich, with an average Fa# of 50, whereas the edges are relatively Fe-poor, with an average Fa# of 34 (b). (c and d) DF TEM image and iron elemental mapping of olivine shocked at 41 GPa. Nanoscale Fe-rich particles are concentrated at grain corners. The Fe distribution within the olivine exhibits a three-layer zoning pattern. The core maintains its original Fe composition with an average Fa# of 50. The intermediate layer shows a substantial decrease in Fe content, with an average Fa# of 35. In contrast, the outermost rim has the highest Fe enrichment, reaching an average Fa# of 74. (e and f) DF TEM image and Fe elemental mapping of olivine shocked at 47 GPa. Nanoscale metallic iron particles are dispersed at grain corners, edges, and within the interior. The iron distribution follows a similar zonal pattern as those observed in (d). The core maintains its initial Fa# of 54, with the middle layer relatively Fe-poor (average Fa# of 37) and the outermost rim Fe-enriched (average Fa# values 75). These variations in Fe contents indicate substantial Fe migration within the olivine due to the shock events. |
3.2.2 Migration of Fe and formation of Fe-rich nanoparticles
No observable changes of Fe were found at 18 GPa (data not shown). In comparison, the impact pressures at 31 GPa, 41 GPa, and 47 GPa induced a zonal Fe distribution in olivine, forming a core-to-edge gradient (Fig. 4). At 31 GPa, the peripheral region of the olivine grain core, where radial-patterned vesicles have developed, exhibited a decrease in average Fa# to 34 compared to the core (Figs. 4a, 4b). In the 41 GPa impacted sample, the Fe distribution exhibited a three-layer zoning pattern: the core maintained its original Fa# of 50; the intermediate layer showed a substantial decrease to an average Fa# of 35; the outermost rim increased to an average Fa# of 78 (Figs. 4c, 4d). A similar three-layer Fe zoning pattern was observed at 47 GPa, with average Fa# values of 54, 37, and 75 from the core to the rim, respectively (Figs. 4e, 4f).
Additionally, nanoscale Fe-rich particles were observed in the shocked olivine samples (Figs. 5 and 6). In the sample shocked at 47 GPa, Fe-rich particles were present at grain corners, edges, and within the olivine crystals. These particles were categorized into two types: (1) round particles (~120 nm in diameter) and (2) angular particles (20–50 nm in diameter) (Figs. 4e and 5). Elemental mapping and line scans confirmed that these particles were composed of Fe, while fast Fourier transform (FFT) analysis identified their structure as metallic Fe (Fig. 5). The larger round particles exhibited a body-centered cubic (BCC) structure, characteristic of nanoscale α-Fe (Fig. 5d), whereas the smaller angular particles displayed a face-centered cubic (FCC) structure, corresponding to nanoscale γ-Fe (Fig. 6c). Notably, the lattice structure within the nanoscale α-Fe particles exhibited regional variations (Fig. 5d). The upper and lower portions were well-crystallized but displayed different crystallographic orientations of ![$[1\[\bar1\\[\bar1\]$](/articles/aa/full_html/2025/07/aa54497-25/aa54497-25-eq2.png) and
and ![$[2\[\bar1\]2]$](/articles/aa/full_html/2025/07/aa54497-25/aa54497-25-eq3.png) , respectively (Figs. 5f, 5h). The middle region exhibited a mix of amorphous and crystalline features, with the crystalline region oriented along the
, respectively (Figs. 5f, 5h). The middle region exhibited a mix of amorphous and crystalline features, with the crystalline region oriented along the ![$[1\[\bar1\\[\bar1\]$](/articles/aa/full_html/2025/07/aa54497-25/aa54497-25-eq4.png) axis (Fig. 5g).
axis (Fig. 5g).
At 41 GPa, another type of Fe-rich particles (20–50 nm in diameter) grew at grain corners (Fig. 6). Elemental line scans revealed that these particles contained a substantial amount of oxygen, and FFT images confirmed their crystal structure as magnetite with a [![$\[\bar3\]$](/articles/aa/full_html/2025/07/aa54497-25/aa54497-25-eq5.png) ] axis (Fig. 6a).
] axis (Fig. 6a).
To better visualize Fe migration, the Fa# of olivine shocked at 31 GPa, 41 GPa, and 47 GPa was statistically analyzed (Fig. 7). The results showed that the average Fa# of the core and near-core regions of olivine associated with γ-phase Fe formation at 31 GPa and 41 GPa were relatively similar. At 47 GPa, the average Fa# values for the core, middle, and edge regions of olivine associated with γ-phase Fe particles were 54, 37, and 85, respectively, while those associated with α-phase Fe particles were 43, 27, and 75, respectively. The α-phase regions exhibited slightly lower Fa# values compared to the γ-phase regions.
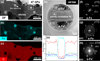 |
Fig. 5 TEM images of iron particles. (a) DF image of olivine shocked at 47 GPa, showing nanoscale particles concentrated at the corners of olivine grains. The dashed arrow marks the location of the elemental line scan, while the dashed box marks the area corresponding to image (d). (b and c) Fe and O elemental mapping of olivine shocked at 47 GPa, revealing that the nanoscale particles are iron-rich and oxygen-free. (d) HRTEM image of an iron particle, with a diameter reaching up to 100 nm. The particle exhibits distinct contrast variations, divided into upper, middle, and lower regions, which are identified as α-Fe through FFT calibration. (e) Elemental line scan across the iron particle, demonstrating a sharp increase in Fe abundance, while the O, Mg, and Si abundances drop to zero within the particle. (f–h) FFT patterns of the upper, middle, and lower regions of the iron particle. The upper region has a crystal orientation of |
![$[1\[\bar1\\[\bar1\]$](/articles/aa/full_html/2025/07/aa54497-25/aa54497-25-eq6.png)
![$[1\[\bar1\\[\bar1\]$](/articles/aa/full_html/2025/07/aa54497-25/aa54497-25-eq7.png)
![$\[\bar1\]$](/articles/aa/full_html/2025/07/aa54497-25/aa54497-25-eq8.png)
3.2.3 Vesicles
Shocked olivine samples commonly develop nanoscale vesicles within their structure (Fig. 8). Unlike micron-scale voids formed by thermal contractions, these vesicles are substantially smaller (Fig. 8a). Following impact, fractures approximately 100 nm wide formed within the olivine, creating vesicles with varying contrast (Fig. 8b). HRTEM analysis revealed that the lattice structure on both sides of the fractures remained continuous, without angular distortion or bending (Fig. 8c). In the sample subjected to the highest shock pressure at 47 GPa, numerous nanoscale vesicles (≤70 nm in diameter) were closely associated with parallel dislocation structures (Fig. 8d).
Notably, at 31 GPa, a ring of “radial” vesicles formed along the rim of the shocked olivine. Some of these vesicles appeared elongated, with their long axis oriented perpendicular to the olivine growth edge (Fig. 4a). The lengths of these elongated vesicles range from 60 to 190 nm.
3.2.4 Other characteristics
The shocked Fa50 olivine samples also exhibit additional features (Fig. A.2). In the 18 GPa shocked sample, polycrystalline olivine was observed on the surface of the FIB-prepared thin section. These polycrystalline olivine fragments were embedded within an olivine matrix with indistinct lattice structures. Although these fragments did not exhibit high-pressure phase transitions, their characteristics resembled those of olivine shocked at 11.7 GPa or 14 GPa (Kudoh & Takeda 1986). Additionally, excess residual SiO2 phases from fayalite (Fa100) synthesis were observed adjacent to olivine in the lowest-pressure samples.
3.3 Spectral characterization of post-shock olivine
3.3.1 Raman spectral characterization
Raman spectra before and after shock were collected for all samples, with detailed analysis focusing on the 800–870 cm−1 range, which encompasses the most characteristic peaks of olivine (Harriss & Burchell 2016). After multi-peak fitting, the characteristic doublet peaks of olivine were identified, with doublet 1 (DB1) positioned between 817.5 and 821.3 cm−1 and doublet 2 (DB2) ranging from 847.0 to 849.5 cm−1. The peak position (xc), full width at half maximum (FWHM), peak position difference (ω=|xc1-xc2|), cumulative FWHM (ΣFWHM, defined as the sum of FWHM values for peaks xc1 and xc2), and peak areas of DB1 and DB2 were extracted and plotted (Table A.2; Fig. 9).
The Raman doublet peaks of unshocked Fa50 olivine were located at 821.3 cm−1 and 849.5 cm−1, corresponding to the most characteristic Si-O bond stretching vibrations in olivine (Harriss & Burchell 2016). After impact, the Raman peaks generally shifted to lower wavenumbers, indicating a decrease in the coupled symmetric and asymmetric stretching vibration frequencies of SiO4 tetrahedra (Fig. 9a). The 41 GPa shocked sample exhibited the largest peak shift, with DB1 and DB2 shifting to 817.5 cm−1 and 846.7 cm−1, respectively. This sample also had the lowest Fa# of 28 at 41 GPa (Fig. 2). The FWHM, which reflects the crystallinity of the post-impact particles, showed a gradual increase in DB1, whereas DB2 initially decreased before increasing again (Fig. 9b). Similarly, the cumulative ΣFWHM and peak area, which also serve as indicators of overall crystallinity, exhibited an initial decline followed by an increase (Figs. 9c, 9d). Additionally, the peak separation (ω) of the shocked olivine samples generally increased with shock pressure.
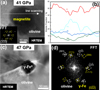 |
Fig. 6 TEM images of iron particles. (a) HRTEM image of an iron-rich particle region in the sample shocked at 41 GPa. The iron-rich particle is identified as magnetite, with a crystal axis orientation of |
![$[\[\bar3\][\bar3\][\bar3\]$](/articles/aa/full_html/2025/07/aa54497-25/aa54497-25-eq9.png)
![$[0\[\bar2\]\[\bar2\]$](/articles/aa/full_html/2025/07/aa54497-25/aa54497-25-eq10.png)
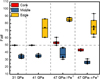 |
Fig. 7 Statistical analysis of Fa# in Fa50 olivine under different shock pressures via TEM-EDS. The red, blue, and yellow boxes represent the distribution ranges (25–75%) of iron content in the core, middle layer, and rim of olivine under different shock pressures, respectively. Whiskers extending from the boxes indicate the maximum and minimum Fe content values. The diamond-shaped markers above the boxes correspond to individual Fe content data points for olivine samples at various shock pressures, whereas the black horizontal lines denote the mean Fe content. “47 GPa-γ Fe0” and “47 GPa-α Fe0” represent olivine regions where γ-phase and α-phase metallic Fe formed, respectively. |
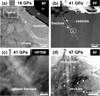 |
Fig. 8 Vesicles observed via TEM in shocked samples. (a) BF TEM image of olivine shocked at 18 GPa, showing a small number of vesicles distributed along fractures within the olivine. (b) DF TEM image of olivine shocked at 41 GPa, where low-contrast vesicles are visible along fractures of the olivine grains. The dashed box marks the location of the HRTEM image in (c). (c) HRTEM image of a fracture in olivine, revealing that crystal planes on both sides of the fracture remain continuous and fully connected. (d) BF TEM image of olivine shocked at 47 GPa, displaying numerous dislocation structures within the olivine, accompanied by nanoscale vesicles. |
3.3.2 MIR spectral characterization
In the mid-infrared (MIR) spectra, the Christiansen feature (CF) peak corresponds to the minimum reflectance value, occurring where the real part of the refractive index or reflectance changes rapidly and converges. This feature is associated with the strongest Si-O stretching vibration of silicates, with the CF peak of olivine located around 1100 cm−1 (Salisbury & Walter 1989). The Reststrahlen band (RB) feature peaks are unique to the MIR reflectance spectra, with Si-O stretching vibrations of olivine between 830 and 1030 cm−1. In the spectra, RB4 and RB2 represent the ν1 symmetric and ν3 asymmetric Si–O stretching vibrations, respectively (Fig. 10).
The CF peak of the unshocked Fa50 olivine was located at 1106.0 cm−1. For samples shocked at 18 GPa and 31 GPa, the CF peak showed minimal or no change. However, the 41 GPa shocked sample exhibited the largest shift, with the CF peak decreasing to 1104.1 cm−1, corresponding to a 2.4% reduction in the strongest Si-O stretching vibration frequency.
Among the RB peaks, the RB1 peak (centered at ~1021.3 cm−1 in unshocked olivine) shifted to 1007.7 cm−1 and appeared as a shoulder in samples shocked at 41 GPa and 47 GPa. The RB2 peak (centered at ~965.8 cm−1 in unshocked olivine) remained relatively stable, with the largest shift (−0.4%) occurring at 47 GPa. The RB3 peak frequency increased from 896.2 cm−1 to 905.9 cm−1 in the 18 GPa shocked sample, representing the largest shift (1.1%). The RB4 peak exhibited the most changes among the RB bands, with the 18 GPa shocked sample showing the largest shift, decreasing from 848.3 cm−1 to 824.5 cm−1 (−2.8%).
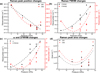 |
Fig. 9 Statistical analysis of Raman spectra. The black and red solid circles correspond to DB1 and DB2, respectively, while the dashed lines indicate overall trends. (a) Scatter plot showing variations toward lower wavenumbers in Raman peak positions across different shock pressures. (b) Scatter plot illustrating changes in Raman full width at half maximum (FWHM) under different shock pressures, showing that the FWHM of DB1 gradually increases, while the FWHM of DB2 first decreases and then increases. (c) Scatter plot depicting the difference in Raman peak positions, along with the cumulative frequency distribution of FWHM across different shock pressures. The peak separation (ω) of the shocked olivine samples showed an overall increasing trend, while the cumulative ΣFWHM exhibited a trend of first decreasing and then increasing. (d) Scatter plot displaying a trend of first decreasing and then increasing variations in Raman peak areas as a function of shock pressures. |
3.3.3 VNIR spectral characterization
Three spectral parameters, absolute reflectance, absorption depth, and slope, were extracted from both the original and normalized VNIR spectra (Fig. 11). The absolute reflectance was taken at 700 nm. The absorption depth was determined from the continuum-removed reflectance curve, defined as the minimum reflectance value at the absorption center near 1055 nm. The slope was calculated from the 700 nm-normalized relative reflectance spectrum, defined as the ratio of the absolute reflectance at 1650 nm to that at 700 nm.
The absorption center near 1055 nm shifted across the shocked samples. In unshocked olivine, the absorption center was located at 1040 nm, whereas the absorption center varied, appearing at 1068 nm, 1060 nm, 1039 nm, and 1075 nm under different shock pressures. The unshocked olivine sample exhibited an absorption feature near 1300 nm, but this peak was not identifiable in shocked samples, inhibiting direct comparisons. The unshocked Fa50 olivine had the lowest absolute reflectance value (0.084), consistent with its black surface, as observed by the naked eye. For the sample shocked at 31 GPa, VNIR spectra were collected separately from powdered and melt regions; compared with the powdered regions, the melt regions presented lower reflectance values and shallower absorption depths. As shown in Figs. 11a and 11c, the 18 GPa shocked sample had the highest absolute reflectance value (0.339) and the deepest absorption (0.514). In comparison, the 47 GPa shocked sample had the lowest post-shock reflectance value (0.125) and the shallowest absorption depth (0.218).
The spectral slopes of the shocked samples decreased slightly at 18 GPa, indicating a blueshift, whereas the slopes increased for samples shocked at 31 GPa, 41 GPa, and 47 GPa, with relative changes of 10.4%, 47.2%, and 25.1%, respectively, indicating a redshift trend at higher shock pressures. For the 31 GPa sample, the melt regions presented a redder trend than powdered regions.
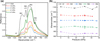 |
Fig. 10 Mid-infrared spectra and statistical analysis of unshocked and shocked Fa50 olivine. (a) Average mid-infrared spectra of olivine in the range of 1250–650 cm−1 under different shock pressures. The MIR reflectance intensity of the shocked olivine samples exhibited a general decrease compared to that of the initial unshocked samples. (b) Point-line plot illustrating the variations in the CF (Christiansen feature) and RB (Reststrahlen band) peaks positions in the mid-infrared spectra of olivine samples as a function of shock pressure. At 47 GPa, RB1 developed a shoulder peak, causing it to be excluded from the statistical graph. Note that, at 31 GPa, two distinct regions, greenish white (powdered) and black (melted), were observed with the naked eye (Fig. A.1d). This results in CF and RB exhibiting two different values for the 31 GPa condition, representing the powdered and melted results, respectively. The RB2 and RB3 peaks remain relatively stable overall, CF, RB1, and RB4 peaks exhibited evident shifts under shock pressures. |
4 Discussion
4.1 Formation process of metallic iron nanoparticles
The shock Fa50 olivine samples exhibited Fe redistribution producing zoning structures and the formation of Fe-rich nanoparticles. Iron migration was commonly observed at pressure ≥31 GPa, whereas metallic iron particles began to form at pressure ≥41 GPa. In shock simulation experiments on schist, element migration has been widely documented in minerals such as plagioclase, biotite, garnet, and staurolite (Fel’dman et al. 2006). Additionally, micron-sized Fe particles were reported in shock experiments on Fa10 olivine at pressures exceeding 60 GPa, attributed to a combination of shock pressure and frictional heating, which led to the melting of both the olivine sample and the Fe-bearing experimental container (Stojic et al. 2021). However, due to the incorporation of additional Fe from container, these micron-sized particles do not fully represent the intrinsic changes in olivine. In our study, both Fe migration and the formation of Fe nanoparticles were observed in shocked Fa50 olivine, suggesting a potential link between these two processes.
Following shock, the Fa50 olivine samples exhibited zoning structures, with the Fa# of the core remaining nearly unchanged, while the Fa# of the layer adjacent to the core decreased to approximately 34 (Fig. 11). In cases where the Fe distribution exhibited a three-layer structure, the outermost layer displayed an increased Fa# (~75), with Fe nanoparticles forming both within the olivine grains and in the interparticle gaps. These observations suggest that the Fe in these newly produced nanoparticles originated from the intermediate layer. During fluctuations in Fe concentration within olivine, Fe atoms underwent exsolution via atomic hopping, leading to the formation of metallic Fe particles.
Nanoscale (10 nm) Fe and Fe–Ni particles have been reported in several types of meteorites, with particularly well-documented occurrences in shergottites (Treiman et al. 2007; Van de Moortèle et al. 2007b; Takenouchi et al. 2017) Olivine decomposition due to impact heating is presumed to produce metallic Fe particles via Fe2+ disproportionation (Treiman et al. 2007; Van de Moortèle et al. 2007b). However, Fe2+ disproportionation is typically accompanied by the formation of high-pressure or metastable high-pressure olivine phases, none of which were detected in our experiments. Although valence state measurements were not conducted, the absence of these phases suggests that Fe2+ disproportionation was not the dominant formation mechanism in our study.
The formation of metallic Fe particles during shock events was thermodynamically driven. At ambient pressure, the transition to γ-phase Fe0 (face-centered cubic structure) occurs at 1188 K (Dewaele et al. 2018). However, this transformation is strongly pressure-dependent. Under high-pressure conditions, the α-γ phase transition requires simultaneous conditions exceeding 8.7 ± 1.0 GPa and 750 ± 30 K (Dewaele et al. 2018). The shock P-T phase diagram compiled by Li et al. (2020) further demonstrates that γ-Fe0 remains stable below 2500 K at 47 GPa. Given the uncertainty in the precise pressure-temperature trajectory during Fe exsolution and phase transformation in our experiments, we conservatively estimate that γ-phase Fe0 formation under peak shock conditions (~47 GPa) would require temperatures between 750 and 2500 K. Studies have shown that γ-phase Fe particles have a size limitation during growth, typically reaching only several tens of nanometers, before reverting to the α-phase upon further heating (Del Bianco et al. 1998). Therefore, in our study, it is inferred that some larger α-phase Fe particles were formed through the aggregation and phase transformation of γ-phase Fe.
The formation process of metallic Fe particles likely occurred as follows: As the shock wave propagated through the olivine, it generated heat, driving Fe atoms near the core to undergo exsolution within the solid-state olivine. These Fe atoms migrated outward and rapidly formed amorphous nuclei (<10 nm). Over time, these nuclei acted as aggregation centers, allowing Fe atoms to coalesce and form small α-phase Fe particles (Greer 2016). As the shock wave super-imposed within the sample, temperatures rose but remained below 2500 K, facilitating the transformation of some small α-phase Fe particles into γ-phase Fe particles (20–50 nm in size). Under prolonged thermal conditions, some γ-phase Fe reverted to the α-phase Fe, while others remained stable. Meanwhile, some small a-phase Fe particles underwent further particle aggregation, forming larger α-phase Fe particles (~120 nm in diameter). Consequently, both nanoscale α-phase (~120 nm in diameter) and γ-phase (20–50 nm in diameter) metallic Fe particles were observed in Fa50 olivine shocked at 47 GPa.
Beyond thermodynamic factors, the stability of individual metallic Fe phases was also influenced by kinetic constraints. During heterogeneous nucleation of a new phase, structural defects within the mineral reduce the interfacial energy required for nucleation, while the crystallographic orientation of the new phase aligns with the principle of low entropy (Cahn & Hilliard 1958). The high density of dislocation defects in shocked olivine substantially lowered the energy barrier for Fe particle formation. TEM analysis revealed that Fe particles formed at grain corners were larger than those at the edges and faces. This trend aligns with observations that the energy barrier for Fe particle nucleation is lowest at grain corners, followed by the edges and highest at grain faces (Sheldon & Rankin 2002).
Iron diffusion in olivine within meteorites occurs through two primary mechanisms. The first involves a disproportionation reaction induced by high-pressure shock under transient high-temperature conditions (>1500 K), as reported by Takenouchi et al. (2017) in the NWA 1950 shergottite. In this case, Fe2+ within the olivine lattice undergoes partial disproportionation into Fe0 and Fe3+, resulting in the formation of metallic iron particles. The second mechanism, operating under relatively low temperature conditions (<700 °C), is diffusiondominated and characterized by Fe-Mg zoning at olivine-metal interfaces (Boland & Duba 1981; Miyamoto et al. 1986; Reisener et al. 2006). The observations in our study, including gradual Fe enrichment at grain boundaries, are more consistent with the latter process.
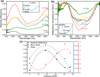 |
Fig. 11 VNIR spectra and statistical analysis of Fa50 olivine under different shock pressures. (a) Average VNIR spectra of olivine under different shock pressures. (b) Normalized VNIR spectra at 700 nm with continuum removal across different shock pressures. Note that, at 31 GPa, two distinct regions, greenish white (powdered) and black (melted), were observed with the naked eye (Fig. A.1d). The spectra shown in blue represent the average of these two regions, while the insets in (a) and (b) display the VNIR spectra of these two regions separately, along with their averaged spectrum. (c) Point-line plot illustrating variations in absolute reflectance values, absorption depths, and spectral slopes of average olivine spectra under different shock pressures. Absolute reflectance and absorption depth correspond to the left y-axis, while spectral slope corresponds to the right y-axis. The band depth is defined as the minimum reflectance value at the absorption center near 1055 nm, determined from the continuum-removed reflectance curves. The slope is defined as the ratio of absolute reflectance at 1650 nm to that at 700 nm, calculated from reflectance spectra normalized at 700 nm. The dashed lines represent trend lines fitted using quadratic or cubic functions. The VNIR reflectance values and band depth of the shocked samples generally increased at lower shock pressure (18 GPa) but decreased at higher shock pressures. Additionally, the shocked olivine samples exhibited a blue shift at lower shock pressure (18 GPa), but a red shift at higher shock pressures. |
4.2 Formation of nanovesicles
Shocked olivine often contains nanoscale vesicles within its interior. The FIB thin sections used in this study were approximately 100 nm thick, and the vesicles associated with dislocations and fractures did not exceed this thickness. During FIB sample preparation, small vesicles retain their gaseous material inside; however, no structural or compositional information about these vesicles can be obtained via TEM analysis. Synchrotron radiation scanning transmission X-ray microscopy (STXM) has been shown to reveal the chemical composition and even the crystal structure of vesicles ranging from 10 to 100 nm in size (Zhang et al. 2013). Given that the samples in this study consisted solely of pure olivine without other substances, it is inferred that the vesicles within the shocked olivine were primarily composed of oxygen. Similar processes have been observed in shock experiments on impact targets involving magnetite and quartz, where the reactions between magnetite and quartz produced Fe-rich silicate melts, and the reduction of magnetite led to the formation of wüstite, both involving the loss of oxygen (Henrichs et al. 2020). Henrichs et al. (2020) further supported this interpretation by attributing the presence of small circular pores in specific sample regions to the release of gaseous O2 under localized extreme temperatures during and after impact.
In shocked olivine, vesicles are frequently associated with dislocations and fractures, as their formation requires energy. Just as dislocations lower the energy barrier for the nucleation of Fe particles, they also reduce the energy required for vesicle formation. As a result, vesicles commonly coexist with dislocations fractures within the olivine samples. Beyond internal vesicles, elongated “radial” vesicles were observed along the olivine grain boundaries (Fig. 4a), suggesting a close relationship between their formation and the shock process. As the shock wave propagates through the sample, available energy was first used to form vesicles, followed by Fe exsolution. However, the remaining energy supply was insufficient to allow Fe atoms to overcome the energy barrier required for nucleation and particle formation after aggregating at the edges of olivine grains. This explains why no Fe-rich particles were observed in olivine samples with distinct Fe zoning (e.g., those shocked at 31 GPa), where vesicles were prevalent.
Vesicle formation in olivine has been documented in a variety of meteorite types. In Kamargaon L6 chondrite, Tiwari et al. (2022) observed vesicle-rich regions surrounding olivine cores within shock veins, interpreted as resulting from localized melting at high shock temperatures (>900 K) followed by degassing during decompression. Similar vesiculated textures have been reported in CK4 carbonaceous chondrites (e.g., Kobe and Karoonda), where vesicles likely formed through localized melting and were subsequently quenched to glassy melt pockets (Ohnishi et al. 2007; Tomeoka et al. 2001). In contrast, vesicles in eucrites, which often contain CO and CO2 gases, have been attributed to deep metamorphic processes (McCoy et al. 2006), indicating an alternative origin distinct from shock-induced mechanisms.
4.3 Formation mechanisms of magnetite nanoparticles
At 41 GPa, a pressure slightly lower than that required for metallic Fe formation, nano-sized magnetite (Fe3O4) particles were observed at the grain corners of olivine. At temperatures above 800 °C, Mg-rich olivine readily undergoes oxidation upon solidification, leading to the formation of magnetite and enstatite (Gunnlaugsson et al. 2006). Additionally, variations in oxygen fugacity, annealing temperature, and mineralogical conditions can result in further phase transformation, such as the conversion of magnetite to maghemite (γ-Fe2O3) or hematite (α-Fe2O3) (Haggerty & Baker 1967; Hoye & Evans 1975; Jolivet & Tronc 1988; Barbosa & Lagoeiro 2010). In our study, no hematite was found in the shocked olivine samples, suggesting that the observed magnetite particles formed through one of two possible mechanisms: (1) olivine releases oxygen and forms vesicles upon heating, and subsequently undergoes oxidation, leading to magnetite formation; (2) olivine undergoes exsolution to form metallic iron particles, some of which are subsequently oxidized by oxygen released from vesicles, producing magnetite nanoparticles.
Given that the magnetite particles are similar in size to that of the γ-phase metallic Fe particles, we propose that, metallic Fe, formed during the shock process, served as their precursor. This shock-induced magnetite formation mechanism offers a new perspective on the origin of magnetite observed near impact craters on Mars. In situ observations have identified magnetite particles at multiple locations on Mars, including Gusev Crater, Meridiani Planum, and Gale Crater. In Gale Crater, nonstoichiometric magnetite (Fe3–xTixO4) is suggested to have formed in redox-stratified lakes or in the source region of sediments, with acidic diagenetic alteration being considered the most plausible mechanism (Hurowitz et al. 2017; Rampe et al. 2017). Although magnetite is more likely to form through aqueous-relevant processes in regions with aqueous activity prevalent, our study proposes an alternative mechanism formation pathway for magnetite under anhydrous conditions, likely near impact craters: shock-induced exsolution of metallic iron from olivine, followed by oxidation. Furthermore, these metallic iron particles could serve as precursors for nanoscale Fe-bearing oxides, such as goethite, hematite, and maghemite, which are widely observed in Martian regolith (Van de Moortèle et al. 2007b).
Magnetite formation in Martian meteorites reflects diverse origins. In nakhlites, magnetite is attributed to aqueous alteration processes on Mars (Bridges et al. 2001). In ALH 84001, it has been linked to both hydrothermal processes and shock events. Shock experiments on siderite at 49 GPa demonstrated transformation to magnetite, supporting the possibility that magnetite in ALH 84001 formed via thermal decomposition at at >470 °C or impact-induced breakdown (Brearley 2003; Isambert et al. 2006; Bell 2007). However, an exogenous origin has also been proposed (Thomas-Keprta et al. 2009). Impact-related processes are further evidenced in other meteorites. In Chassignites, ferropericlase (FeO) has been observed as a product of shockinduced melting of olivine. Ferropericlase crystallizes from the melt, accompanied by the crystallization of clinopyroxene from olivine/bridgmanite melt (Miyahara et al. 2019).
Recent findings from Chang’e-5 returned samples have broadened our understanding of the magnetite formation mechanisms. Guo et al. (2022) reported that submicron magnetite and metallic Fe particles formed via eutectoid decomposition of FeO during complex gas-liquid reactions involving lunar sulfides under impact conditions. Similarly, Cao et al. (2024) identified magnetite-rich sulfide particles and proposed that reactions between sulfide droplets and silicate melts, catalyzed by ilmenite (FeTiO3) or Ti-rich phases, could also generate magnetite. Building on these insights, our study proposes a third formation pathway: the oxidation of metallic iron, exsolved from Fe-rich olivine under shock. Unlike previous models that require sulfide precursors or liquid phases, this mechanism involves direct redox transformation of shock-exsolved Fe0, offering a new perspective on impact-induced oxidation processes on planetary surfaces.
4.4 Absence of high-pressure phases following impact
In this study, a series of shock recovery experiments with peak pressures up to 47 GPa were conducted on Fa50 olivine, yet no high-pressure phase minerals were found in the post-shock samples. Such observations contrast with static high-pressure experiments using multi-anvil apparatus, where Mg-rich olivine transforms to wadsleyite at ~14 GPa under controlled temperature and pressure conditions and further transforms into ringwoodite within the 12–22 GPa range (Katsura et al. 2004; Inoue et al. 2006). For pure fayalite, the transition occurs at even lower pressures (5 GPa; Yagi et al. 1987).
The absence of high-pressure phases in Fa50 olivine shocked at 47 GPa is most likely attributable to the extremely short duration of the experimental shock event. In both laboratory and natural contexts, shock durations typically range from microseconds to milliseconds, imposing fundamental kinetic constraints on atomic diffusion, metallic iron formation, and oxidation – processes that require substantial atomic reorganization. These constraints inherently favor subsolidus deformation mechanisms, such as dislocation formation and amorphization, over thermodynamical equilibrium phase transformations (Ahrens & Rubin 1993; Grieve et al. 1996; Sharp & DeCarli 2006). Furthermore, melting in dense silicate rocks typically requires shock pressures exceeding 80 GPa (Stöffler et al. 2018), well above the estimated pressure conditions reached in our experiments.
In particular, reconstructive phase transformations such as the olivine-to-β/γ transition involve a complete structural reorganization, including the breakdown of SiO4 tetrahedra and FeO6 octahedra and formation of intermediate SiO5 trigonal bipyramids (Smyth et al. 1997; Tripoliti et al. 2023), before finally achieving new SiO4/FeO6 frameworks (Nestola et al. 2011). These transitions proceed via nucleation-growth mechanisms and require high activation energies and sustained elevated temperatures (Chen et al. 2004; Ohtani et al. 2004; Xie & Sharp 2004). As such, they are kinetically inhibited under the sub-microsecond timescales (<1 μs) typical in shock experiments (Langenhorst & Deutsch 2012). The observed microstructures and mineral assemblages in our samples are therefore consistent with subsolidus deformation rather than high-pressure phase transformation.
We also considered the possibility that high-pressure Fe-rich olivine phases formed transiently during shock and subsequently decomposed during pressure release. According to Henrichs et al. (2020), such retrograde decomposition would typically produce a suite of reaction products, including iron oxides and coexisting silica or high-pressure silica phases. Although magnetite was observed in our samples, no associated silica phases-expected from retrograde decomposition of high-pressure Fe-rich olivine were detected. The absence of these diagnostic products, combined with the strong kinetic limitations of shock durations and the lack of any high-pressure polymorphs, indicates that the observed features are more consistent with subsolidus deformation rather than the formation and subsequent breakdown of high-pressure phases.
Due to the challenges in synthesizing Fe-rich olivine samples, no prior shock experiments have been conducted on Fa50 olivine. However, previous shock experimental studies have examined natural olivine, synthetic pure fayalite (i.e., the Fe-olivine endmember), and natural olivine-bearing rocks. Experiments on Fa10 olivine have shown that, despite Raman and mid-infrared peak shifts at pressures >65 GPa, no high-pressure phases were observed (Chen et al. 2016; Harriss & Burchell 2016; Henrichs et al. 2020; Stojic et al. 2021; Obata et al. 2023). Similarly, shock experiments on pure fayalite revealed that olivine decomposed into wüstite and stishovite assemblages at 20–55 GPa (Chen et al. 2002), while pressure was approximately 25 GPa in static high-pressure experiments (Bassett & Ming 1972). Shock experiments on metamorphic rocks (plagioclase-quartz-biotite schist) identified ringwoodite at pressures nearly ten times higher than those required in static experiments (Fel’dman et al. 2006). However, this transformation was attributed to element migration and mineral replacement associated with biotite rather than direct olivine phase transformation (Fel’dman et al. 2006; Sazonova et al. 2006). These findings suggest that both Mg-rich olivine and fayalite have not undergone phase transformations in shock experiments.
In contrast, high-pressure olivine phases such as ahrensite, bridgmanite, ringwoodite, and metastable olivine phases are commonly found in meteorites, particularly within olivine melt veins (Van De Moortele et al. 2007a; Ma et al. 2016; Okuchi et al. 2021). Additionally, olivine can dissociate into bridgmanite ((Mg, Fe) SiO3) and magnesiowüstite under impact conditions (Miyahara et al. 2011). While high-pressure phase formation in meteorites is typically inferred from static high-pressure experiments, shock experiments may provide a more accurate representation of impact dynamics. A critical distinction between natural impacts and laboratory shock experiments is that natural events have longer durations and slower cooling rates, allowing heat to propagate more effectively and enabling high-pressure phases to crystallize (Fel’dman et al. 2006). As a result, the pressure and temperature thresholds for olivine phase transformation in natural impacts are likely lower than those observed in shock experiments.
4.5 Spectral characteristics analyzed in conjunction with microscale results
4.5.1 Raman interpretation
The Raman peaks of shocked Fa50 olivine exhibited systematic shifts (Fig. 9a). The trend of the Raman peaks shifting to lower wavenumbers is consistent with the frequency shifts observed in shocked San Carlos olivine (Fa10), which were attributed to defect accumulation or structural rearrangement (Harriss & Burchell 2016). In contrast, Raman analysis of shocked forsterite residues revealed that while DB1 shifted to lower wavenumbers, DB2 shifted to higher wavenumbers (Farrell-Turner et al. 2005). The Raman shift results of shocked Mg-rich olivine from these two studies are not entirely consistent. The discrepancies in Raman shift trends among shocked Mg-rich olivine samples from these studies suggest that no universal correlation exists between Fa# and Raman wavenumber shifts in shocked olivine. For unshocked olivine, however, a clear relationship between Fa# and wavenumber shifts has been established: Mg-rich olivine exhibits higher Raman wavenumbers than Fe-rich olivine (Kuebler et al. 2006). Therefore, based on previous shock metamorphism experiments, we conclude that frequency shifts in DB1 or DB2 alone cannot reliably indicate changes in Fe content in shocked olivine.
Raman spectroscopy also provides insights into crystallinity changes in the shocked samples. The cumulative FWHM frequency of shocked Fa50 olivine initially decreased slightly but subsequently increased, indicating that the crystallinity remained largely unchanged at lower shock pressures but deteriorated at pressures (≥31 GPa) (Fig. 9c). According to SEM observations, localized melting of olivine occurred in regions of approximately 100 μm × 100 μm in size at pressures above 31 GPa (Figs. 1c–f). The affected areas exhibit distinct shrinkage textures, consistent with partial melting features previously reported in shock experiments (Langenhorst 2002). Given that the melting point of Fa50 olivine (~1470 K) is substantially lower than that of forsteritic olivine, and that shock conditions at 31 GPa can transiently produce temperatures approaching 2500 K (Li et al. 2020), it is plausible that localized melting and recrystallization occurred, resulting in reduced crystallinity in the affected zones. Additionally, greater grain damage at higher shock pressures, potentially leading to grain size reduction, contributed to the increased peak width.
The Raman peak area of shocked Fa50 olivine followed a tended to initial decrease and subsequent increase, with only the 47 GPa sample exhibiting a peak area larger than that of the unshocked sample (Fig. 9d). The peak area reflects the combined effect of intensity and width. In this study, although cumulative FWHM frequency increased at 31 GPa and 41 GPa, the peak intensity substantially decreased, leading to an overall reduction in peak area. The peak position difference (ω) of Raman spectroscopy also provides information about Fe content variations. In our experiments, the peak position difference (ω) of the shocked olivine generally increased (Fig. 9c). Previous studies have shown that ω is inversely proportional to Fe contents (Foster et al. 2013). SEM measurements confirmed that the average Fa# of shocked olivine (considering both over unaltered and impacted regions) decreased, aligning with the observed increase in ω, consistent with previous conclusions.
4.5.2 MIR interpretation
The MIR reflectance intensity and peak positions of the shocked samples exhibited varying degrees of change. In general, the MIR reflectance intensity decreased across all shocked olivine samples (Fig. 10a). This reduction was primarily attributed to localized melting on the sample surfaces and increased surface roughness in non-melted regions, both of which enhanced diffuse reflection and weakened peak intensity. The shifts in the CF and RB peaks followed these trends: the CF peak shift reached 2.4% in the sample shocked at 41 GPa; the RB4 peak in the 18 GPa shocked sample exhibited the largest shift (−2.8%); the RB1 peak displayed the substantial changes at higher pressures, shifting by −1.3% at 41 GPa and developing a shoulder peak at 41 GPa; the RB2 and RB3 peaks remained relatively stable, with shifts no exceeding 1.1% (Fig. 10b). These results indicate that, under shock pressures up to 47 GPa, the Si–O stretching vibrations and symmetric stretching vibrations in the SiO4 tetrahedra were substantially affected by shock-induced structural modifications. Based on these findings, Fourier transform mid-infrared (FT-MIR) reflectance data can be used to identify shock-induced alterations in olivine by focusing on shifts in the CF, RB1, and RB4 peaks.
In contrast, MIR results from shock experiments on San Carlos olivine (Fa10) indicated a different trend, that the RB2 peak (~980 cm−1) exhibited the most profound shift, while the CF peak (~1060 cm−1) showed substantial variations in intensity (Stojic et al. 2021). Such differences may be attributed to higher Fe content in Fa50 olivine compared to Fa10. The presence of iron atoms bonded to SiO4 tetrahedra alters the vibrational frequencies of Si–O bonds within the tetrahedral structure, leading to distinct spectral shifts.
4.5.3 VNIR interpretation
The VNIR spectra of the shocked samples exhibited varying degrees of change in absolute reflectance, spectral slopes, and absorption depths. Compared to unshocked olivine, the VNIR reflectance of the shocked samples generally increased (Figs. 11a, 11c). Such an increase was primarily due to the fragmentation of the originally dark solid samples into powdered greenish-white particles at lower shock pressures (18 GPa), leading to higher reflectance. At higher shock pressures (31 GPa, 41 GPa, and 47 GPa), contraction and melting altered the color of samples to black. While the reflectance values at these pressures were lower than those at 18 GPa, they remained higher than those of unshocked samples. In samples shocked at 31 GPa, regions subjected to stronger impacts exhibited localized melting and lower reflectance, resulting in a darker appearance than merely fragmented regions.
The shocked olivine samples exhibited a blueshift at lower shock pressures (18 GPa) and a redshift at higher shock pressures (Figs. 11b, 11c). The blueshift at 18 GPa was attributed to the formation of vesicles and dislocations. Nanoscale vesicles induce Rayleigh scattering, leading to a blueshift, and dislocation defects act as color centers, enhancing the blue effect (Yavas et al. 1993; Shklyaev et al. 2010). At pressures ≥41 GPa, nanoscale Fe-rich particles are produced. Numerous studies have shown that such particles increase the VNIR spectral slope, contributing to a reddening effect (Pieters & Noble 2016).
The trend in absorption depth was inversely related to the spectral slope (Figs. 11b, 11c). A greater absorption depth near 1055 nm enhances olivine detectability. However, at higher shock pressures, absorption depth decreased, likely due to localized melting of olivine during intense shock events. On airless bodies, space weathering caused by micrometeorite impact is known to alter surface composition and remote sensing spectral features. Simulated micrometeorite impacts on a series of Fe-rich olivine samples have shown that under lunar- and Phobos-like irradiation conditions, the VNIR absorption center near 1080 nm shifts by ~10 nm, while the 1350 nm feature shifts by ~5 nm, remaining relatively stable overall (Wang et al. 2024). In our study, the absorption center near 1050 nm in the VNIR spectra of Fa50 olivine (measured at a phase angle of 30°) shifted substantially by up to 35 nm after shock. However, due to the indistinct peak center near 1030 nm in the shocked samples, further discussion of this feature is not possible.
5 Implications
5.1 Impact-induced oxidation processes and atmospheric evolution on early Mars
Our study demonstrates that shock processes in Fe-rich olivine induce structural modifications (e.g., grain fragmentation, localized melting, and the formation of nanoscale metallic iron and magnetite) and generate oxygen vesicles. The release of oxygen during these events could have contributed to oxidation processes on Mars, potentially influencing atmospheric redox evolution and the transition from a reducing to an oxidizing environment. During the pre-Noachian and Noachian periods, volcanic eruptions and impacts released reducing gases (e.g., H2, CH4, NH4, CO2, and H2O), potentially contributing to a strong greenhouse effect (Lammer et al. 2018). In addition, studies of impact glasses and meteorites indicate that the redox state of impact melts plays a key role in the release of volatiles (Black & Brounce 2023). During the Noachian period, impactors striking silicate minerals likely generated oxidizing gases such as O2, contributing to surface oxidation. However, the potentially active aqueous environments prevalent during this period suggest that substantial impact-induced oxidation effects may have been confined to localized water-limited areas.
Based on the observed melting and vesicle formation at impact pressures starting from 31 GPa in this study, we hypothesize that impacts generating pressures of ≥31 GPa on Fa50 olivine could act as a source of oxygen gas into the Martian atmosphere. The typical average impact velocity on the Martian surface is approximately 9.3 km/s, based on dynamical modeling of impactor populations in the Martian environment (Steel 1998). Pressures generated in such impacts can readily exceed 31 GPa (see Table B.1). Therefore, the role of impact-induced oxidation from rock-forming silicate minerals in the Martian crust (without the involvement of water) cannot be overlooked throughout the early history of Mars. However, the threshold impact pressures required for other rock-forming silicates (e.g., pyroxene, plagioclase) to release oxidizing gases remain poorly constrained and warrant further experimental investigation.
The formation of magnetite nanoparticles and oxygen vesicles observed in our study highlights a mechanism by which impact events can drive Fe (II) oxidation within olivine. This suggests that repeated impacts not only alter the mineralogy of planetary surfaces but also promote large-scale oxidation. Combined with ultraviolet irradiation and the gradual shift toward a more oxidizing atmosphere, Fe (II) in minerals could undergo progressive oxidation, ultimately contributing to the formation of Martian characteristic red regolith. The interplay between shock-induced Fe migration, oxidation, and vesicle formation provides a new perspective on how impact processes modify the redox state of Fe-rich planetary surface materials.
5.2 Implications for Phobos and Deimos
In contrast to the Martian surface, which is shaped by diverse geological processes (mostly involving aqueous fluids), the Martian moons Phobos and Deimos, are predominantly influenced by space weathering and impact events. Laboratory simulations of space weathering on Phobos-like regolith suggest that irradiation generates nanoscale metallic iron within amorphous layers on the rim of Fe-rich olivine grains (Xu et al. 2023). Thus, if Phobos and Deimos are fragments originated from Martian crust and inherit Fe-rich olivine, nanoscale Fe particles could originate from both impact processes (forming between olivine grains) and space weathering (forming within amorphous layers), along with magnetite particles formed via impact-induced oxidation.
Our shock experiments on Fa50 olivine demonstrate that high-pressure impacts substantially alter both mineralogical and spectral properties of Fe-rich olivine, including changes in grain size, color, surface roughness, Fe content, and crystallinity. These impact-induced modifications, reflected in shifts in Raman, VNIR, and MIR spectral features, establish a direct link between impact dynamics and the physical evolution of Fe-rich planetary surface materials.
Remote sensing data suggest that the surfaces of Phobos and Deimos exhibit moderate spectral reddening in the VNIR range, previously attributed to intense space weathering (Murchie & Erard 1996; Pang et al. 1980). Here, we propose that impact-induced Fe-rich nanoparticles may also contribute to this spectral reddening. Our experiments further demonstrate that the nanoscale Fe particles produced during shock are closely associated with spectral reddening effects in VNIR data.
Phobos surface exhibits localized bluer units, which have been interpreted as exposure of fresh materials from deeper layers (Murchie & Erard 1996; Rivkin et al. 2002). The spectral slope differences between the blue and red units on Phobos are thought to result from varying degrees of space weathering of materials excavated during the formation of Stickney crater (Poggiali et al. 2022; Xu et al. 2023). In our experiments, Fa50 olivine subjected to lower shock pressures exhibited slight spectral bluing in the VNIR range, primarily associated with the formation of nanovesicles. This suggests that impact-induced nanovesicles might also contribute to the bluing observed in younger regions on the surface of Phobos.
This suggests that impact processes, together with space weathering, may play a critical role in shaping the spectral properties of planetary surfaces, particularly on Phobos and Deimos (assuming their surfaces were Fe-rich olivine similar to the Martian surface). high-pressure shock events also induce shifts in Raman, VNIR, and MIR spectral features, reflecting changes in crystallinity, Fa#, and surface roughness. In naturally shocked Fe-rich olivine, these transformations are characterized by lower Raman peak wavenumbers, increased peak separations, broader FWHMs, higher VNIR reflectance, weaker absorption depths, and an overall spectral reddening effect. These spectral alterations provide critical insights for interpreting remote sensing observations of Mars, Phobos, and other Fe-rich asteroids.
Meanwhile, the impact products on Phobos’ surface are likely more complex than those produced in laboratory shock experiments. Compared to shock-simulation experiments, natural impact melts cool over timescales of hundreds to thousands of years, allowing for prolonged annealing, phase transformations, and enhanced crystallization of nanoscale particles (Simonds et al. 1978). As a result, impact-driven Fe migration on Martian moons, such as Phobos, may be more extensive, leading to larger particle sizes and lower temperature-pressure thresholds for these transformations. Based on our experiments, we infer that Fe-rich olivine subjected to peak impact pressures ≤41 GPa (corresponding to estimated transient temperatures ≤1188 K) could form nanoscale metallic iron and magnetite particles.
In addition, the FeFe-rich olivine in Phobos’ crust may contain trace elements such as Cu, Ni, S, Cr, and Al, while the crust itself may host a complex mixture of Fe-rich silicates, Fe oxides, and Fe-Ni metals. Several factors contribute to this compositional and textural complexity, including: 1) the redeposition of impact ejecta near craters, 2) the cumulative effects of multiple impact events over time, 3) the prevalence of oblique impacts compared to vertical collisions, and 4) variations in the porosity and cooling rates of impact melts. These factors underscore the need for further experimental studies to better constrain the impact-induced modification processes that may have shaped Phobos, ultimately contributing to a more comprehensive understanding of the formation and evolution of the Martian Moons.
Together, all these findings provide valuable insights for the interpretation of remote sensing spectra, for understanding impact-induced modifications, and for supporting the analysis of returned samples from upcoming missions, such as Martian Moons Exploration mission (MMX) by JAXA, Tianwen-3 mission by China, and Mars sample return mission by NASA and ESA (Kminek et al. 2022; Kuramoto et al. 2022; Hou et al. 2024).
6 Conclusion
This study conducted a series of shock-recovery experiments (dynamic impacts at velocities ranging from 0.89 to 1.95 km/s; shock pressures of 18 GPa, 31 GPa, 41 GPa, and 47 GPa) on Fa50 olivine samples, analyzing changes in Raman, VNIR, and MIR spectra, as well as microstructural modifications before and after impact. In particular, our study advances the understanding of the characteristics and formation mechanisms of shock products in Fa50 iron-rich olivine while addressing the limitations of previous dynamic shock studies by integrating simultaneous microscopic and spectral analyses. Here are the major findings of this study:
- (1)
Correlation between alteration characteristics of Fe-rich olivine and its spectral properties. After impact, Fa50 olivine exhibited reduced grain size, increased surface roughness, decreased crystallinity, and lower overall Fe content. These structural changes resulted in shifts to lower wavenumbers in Raman and MIR spectra, weakened VNIR absorption features, and increases in Raman peak area, FWHM, and peak position differences. VNIR reflectance values varied with post-shock appearance, with samples that turned greenish-white exhibiting decreased reflectance, while remelted dark samples showed increased reflectance;
- (2)
Correlation between shock products and VNIR spectral slopes. The study established a clear correlation between shock-induced microscopic features and VNIR spectral slopes. At lower shock pressures (≤31 GPa), the formation of numerous dislocations and vesicles within Fa50 olivine caused a blueshift in the VNIR spectra. At higher shock pressures (≥41 GPa), the appearance of nanoscale metallic Fe and magnetite particles at olivine grain boundaries led to a redshift in the VNIR spectra;
- (3)
Formation mechanism of shock products in Fe-rich olivine. At shock pressures ≥31 GPa, Fe zoning developed within olivine, and Fe atoms migrated through atomic hopping, aggregating into α-phase Fe0 particles (20–50 nm). As temperatures increased, some of these particles transformed into γ-phase Fe0 particles (20–50 nm). With further temperature rise, continued aggregation and phase transformation led to the formation of larger α-phase metallic Fe particles, reaching a diameter up to ~120 nm;
- (4)
Nanoscale α-phase and γ-phase metallic Fe, along with magnetite particles, were observed at olivine grain boundaries at shock pressures ≥41 GPa (corresponding to estimated transient temperatures ≥1188 K). Magnetite can form not only through the direct decomposition of olivine but also via the oxidation of nanoscale metallic iron particles by oxygen vesicles generated during the impact process. This study also indicates that impacts on Fe-rich silicates, independent of aqueous alteration, represent an alternative mechanism influencing both the redox evolution of Martian surface and the composition of its early atmosphere;
- (5)
Absence of high-pressure phase transformations. Under dynamic single-shock conditions for pressures ≤47 GPa, no phase transformation to high-pressure phases of olivine was observed in our experiments. Given that natural impact events may last substantially longer than laboratory shock experiments, high-pressure phases may still occur when Fe-rich olivine subject to the shock pressures as those examined in our experiments;
- (6)
Impact-induced nanoscale metallic iron, magnetite particles, and nanovesicles may directly contribute to the spectral reddening and localized bluing observed on Martian Moons Phobos and Deimos. Compared to laboratory conditions, natural impact processes on Phobos likely involve longer cooling times, more extensive Fe migration, and larger particle formation, highlighting the need for further experimental and observational studies to fully understand how impact processes shape the composition and spectral characteristics of the Martian moons.
Acknowledgements
The authors gratefully acknowledge the anonymous reviewer and Associate Editor Emmanuel Lellouch for their careful reviews and constructive comments, which have substantially improved the quality and clarity of this manuscript. This research was supported by the National Natural Science Foundation of China (Grant Nos. 42441803, 42373042, 42422201, and 42003054). Youjun Zhang is supported by the Sichuan Science and Technology Program (Grants No. 2023NSFSC1910).
Appendix A Supplementary information about the experiments
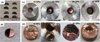 |
Fig. A.1 Photographs of processed and shocked samples. (a) Photograph of the cut samples, showing a semicircular Fa50 olivine slab with a thickness of 1 mm and a diameter of 12 mm. (b) Photograph of the sample mounted on a copper holder, prepared for shock experiments. (c) Photograph of the shocked sample embedded in the recovery target. The flyer plate exhibits inward deformation due to the shock impact at 18, 31, 41, and 47 GPa. (d) Photographs of the shocked samples after recovery using a lathe, with the samples remain enclosed within the residual copper sample holders. After impact, samples subjected to 18 GPa and 31 GPa exhibited substantial fragmentation, with the resulting powdered samples appearing greenish white. Meanwhile, the 31 GPa sample was partially melted and appeared black. At higher shock pressures (41 GPa and 47 GPa), melting occurred in the impacted olivine, resulting in a predominantly black appearance. |
Parameters related to shock simulation in this experiment.
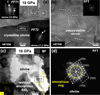 |
Fig. A.2 Additional features of the shocked samples observed via TEM. (a) HRTEM image of olivine shocked at 18 GPa. The upper part of the olivine exhibits a crystal structure similar to that of olivine shocked at 14 GPa, whereas the lower part resembles the characteristics of olivine shocked at 11.7 GPa (Kudoh & Takeda 1986). The dashed boxes indicate the locations for FFT analysis in the upper and lower parts. The dashed box on the upper right marks the area corresponding to image (b). (b) HRTEM image of olivine, showing numerous well-defined olivine fragments distributed within a matrix of olivine with less distinct lattice structures. The FFT pattern reveals polycrystalline rings, indicating structural disorder. (c) BF TEM image of olivine shocked at 18 GPa, where residual SiO2 from the synthesis is visible. The dashed box marks the location of image (d). (d) FFT patterns of olivine and SiO2. The white dashed lines serve as symmetry guides for the olivine crystal structure, whereas the yellow dashed lines highlight the amorphous ring of SiO2. |
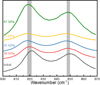 |
Fig. A.3 Raman spectra of Fa50 olivine under different shock pressures. The gray-shaded regions on the left and right indicate the minimum and maximum wavenumbers for the DB1 and DB2 doublets of Fa50 olivine across different shock pressures. The left gray region spans from 817.5 cm−1 to 821.3 cm−1, and the right gray region extends from 847.0 cm−1 to 849.5 cm−1. |
Raman spectral parameters before and after shock simulation.
MIR spectral parameters before and after shock simulation.
VNIR spectral parameters before and after shock simulation.
Appendix B Shock pressure estimation for basalt and olivine on Mars
When meteorites impact the Martian crust at an average velocity of 9.3 km/s, the particle velocity (Up) is related to the projectile velocity (ω) by Up = 1/2 * ω, yielding Up = 4.6 km/s. For Mg-rich olivine and basalt, shock wave velocity (Us) and Up exhibit a linear relationship below 42 GPa, described by Us = 3.56 + 2.57 * Up for Mg-rich olivine (Huang et al. 2016) and Us = 3.5 + 1.3 * Up for basalt (Sekine et al. 2008). These relationships initially predict peak pressures of 243.8 GPa for Mg-rich olivine (density = 3.38 g·cm−3) and 124.3 GPa for basalt (density = 2.8 g·cm−3), exceeding the valid range of these linear equations. To correct for this, high-pressure equations were applied. Using Us = 4.17 + 1.656 * Up - 0.008 * Up2, proposed by Chidester et al. (2021) for pressures ranging from 166 to 1465 GPa, the corrected peak pressures were 183.8 GPa for Mg-rich olivine and 152.3 GPa for basalt. These values are consistent with those derived from the equation Us = 6.89 + 1.22 * Up - 1.50 * Up * exp (−0.4 * Up) proposed by Root et al. (2018) for Up > 4.1 km/s, yielding 180.4 GPa for Mg-rich olivine and 149.4 GPa for basalt. These results (listed in Table B.1) indicate that when basaltic or Mg-rich olivine materials impact similar rocks on Mars, the pressures generated within impact craters could easily exceed 31 GPa, a threshold relevant to shock-induced mineral and spectral changes for Fa50 olivine.
Literature-based estimates of shock pressure prediction for Mg-rich olivine and basalt on Mars.
References
- Ahrens, T. J., & Rubin, A. M. 1993, J. Geophys. Res.-Planets, 98, 1185 [Google Scholar]
- Bagheri, A., Khan, A., Efroimsky, M., Kruglyakov, M., & Giardini, D. 2021, Nat. Astron., 5, 539 [NASA ADS] [CrossRef] [Google Scholar]
- Barbosa, P. F., & Lagoeiro, L. 2010, Am. Mineralogist, 95, 118 [Google Scholar]
- Bassett, W. A., & Ming, L.-C. 1972, Phys. Earth Planet. Inter., 6, 154 [Google Scholar]
- Bell, M. S. 2007, Meteorit. Planet. Sci., 42, 935 [Google Scholar]
- Bibring, J., Ksanfomality, L., Langevin, I., et al. 1992, Adv. Space Res., 12, 13 [NASA ADS] [CrossRef] [Google Scholar]
- Black, B. A., & Brounce, M. 2023, Geology, 51, 978 [Google Scholar]
- Boland, J., & Duba, A. 1981, Nature, 294, 142 [Google Scholar]
- Boynton, W. V., Taylor, G. J., Evans, L. G., et al. 2007, J. Geophys. Res.-Planets, 112, E12S99 [Google Scholar]
- Brearley, A. J. 2003, Meteorit. Planet. Sci., 38, 849 [Google Scholar]
- Bridges, J., & Warren, P. 2006, J. Geol. Soc., 163, 229 [Google Scholar]
- Bridges, J. C., Catling, D., Saxton, J., et al. 2001, in Chronology and Evolution of Mars: Proceedings of an ISSI Workshop, 10–14 April 2000 (Bern, Switzerland: Springer), 365 [Google Scholar]
- Cahn, J. W., & Hilliard, J. E. 1958, J. Chem. phys., 28, 258 [Google Scholar]
- Canup, R., & Salmon, J. 2018, Sci. Adv., 4, eaar6887 [NASA ADS] [CrossRef] [Google Scholar]
- Cao, Z., Guo, Z., Li, C., et al. 2024, Sci. Adv., 10, eadn2301 [Google Scholar]
- Chanyshev, A., Bondar, D., Fei, H. Z., et al. 2021, Contrib. Mineral. Petrol., 176 [Google Scholar]
- Chen, G. Q., Ahrens, T. J., & Stolper, E. M. 2002, Phys. Earth Planet. Inter., 134, 35 [Google Scholar]
- Chen, M., Goresy, A. E., & Gillet, P. 2004, Proc. Natl. Acad. Sci., 101, 15033 [Google Scholar]
- Chen, Z. A., Yuan, X. H., Huang, X. G., et al. 2016, Chinese J. Geophys.-Chinese Ed., 59, 152 [Google Scholar]
- Chidester, B., Millot, M., Townsend, J., et al. 2021, Geophys. Res. Lett., 48, e2021GL092471 [Google Scholar]
- Del Bianco, L., Ballesteros, C., Rojo, J., & Hernando, A. 1998, Phys. Rev. Lett., 81, 4500 [Google Scholar]
- Dewaele, A., Svitlyk, V., Bottin, F., Bouchet, J., & Jacobs, J. 2018, Appl. Phys. Lett., 112, 201906 [Google Scholar]
- Farrell-Turner, S., Reimold, W., Nieuwoudt, M., & Erasmus, R. 2005, Meteorit. Planet. Sci., 40, 1311 [Google Scholar]
- Fel’dman, V. I., Sazonova, L. V., & Kozlov, E. A. 2006, Petrology, 14, 540 [Google Scholar]
- Foster, N., Wozniakiewicz, P. J., Price, M. C., Kearsley, A. T., & Burchell, M. J. 2013, Geochim. Cosmochim. Acta, 121, 1 [Google Scholar]
- Gan, B., Zhang, Y. J., Huang, Y. Q., et al. 2021, Geophys. Res. Lett., 48, e94446 [Google Scholar]
- Greer, A. 2016, J. Chem. phys., 145, 211704 [Google Scholar]
- Grieve, R. A., Langenhorst, F., & Stöffler, D. 1996, Meteorit. Planet. Sci., 31, 6 [Google Scholar]
- Gunnlaugsson, H. P., Helgason, Ö., Kristjánsson, L., et al. 2006, Phys. Earth Planet. Inter., 154, 276 [Google Scholar]
- Guo, Z., Li, C., Li, Y., et al. 2022, Nat. Commun., 13, 7177 [Google Scholar]
- Haggerty, S. E., & Baker, I. 1967, Contrib. Mineral. Petrol., 16, 233 [Google Scholar]
- Hamilton, V. E., & Christensen, P. R. 2005, Geology, 33, 433 [Google Scholar]
- Harriss, K. H., & Burchell, M. J. 2016, Meteorit. Planet. Sci., 51, 1289 [Google Scholar]
- Henrichs, L. F., Kontny, A., Reznik, B., et al. 2020, Meteorit. Planet. Sci., 55, 56 [Google Scholar]
- Hoefen, T. M., Clark, R. N., Bandfield, J. L., et al. 2003, Science, 302, 627 [Google Scholar]
- Hou, Z., Liu, J., Xu, Y., et al. 2024, Natl. Sci. Rev., 11, nwae313 [Google Scholar]
- Hoye, G., & Evans, M. 1975, Geophys. J. Int., 41, 139 [Google Scholar]
- Huang, X., Yuan, X., Chen, Z., Liu, F., & Bai, W. 2016, Sci. China Earth Sci., 59, 619 [Google Scholar]
- Hurowitz, J. A., Grotzinger, J. P., Fischer, W. W., et al. 2017, Science, 356, eaah6849 [Google Scholar]
- Inoue, T., Irifune, T., Higo, Y., et al. 2006, Phys. Chem. Miner., 33, 106 [Google Scholar]
- Irifune, T., Nishiyama, N., Kuroda, K., et al. 1998, Science, 279, 1698 [Google Scholar]
- Isambert, A., De Resseguier, T., Gloter, A., et al. 2006, Earth Planet. Sci. Lett., 243, 820 [Google Scholar]
- Jolivet, J.-P., & Tronc, E. 1988, J. Colloid Interface Sci., 125, 688 [Google Scholar]
- Katsura, T., Yamada, H., Nishikawa, O., et al. 2004, J. Geophys. Res.-Solid Earth, 109, B02209 [Google Scholar]
- King Jr, H., Herbolzheimer, E., & Cook, R. L. 1992, J. Appl. Phys., 71, 2071 [Google Scholar]
- Kminek, G., Meyer, M. A., Beaty, D. W., et al. 2022, Astrobiology, 22, S1 [Google Scholar]
- Koeppen, W. C., & Hamilton, V. E. 2008, J. Geophy. Res.-Planets, 113, E05001 [Google Scholar]
- Kring, D. A., Claeys, P., Gulick, S. P., Morgan, J. V., & Collins, G. S. 2017, GSA Today, 27, 4 [Google Scholar]
- Kudoh, Y., & Takeda, H. 1986, Physica B+C, 139, 333 [Google Scholar]
- Kuebler, K. E., Jolliff, B. L., Wang, A., & Haskin, L. A. 2006, Geochim. Cosmochim. Acta, 70, 6201 [CrossRef] [Google Scholar]
- Kuramoto, K., Kawakatsu, Y., Fujimoto, M., et al. 2022, Earth Planets Space, 74, 12 [NASA ADS] [CrossRef] [Google Scholar]
- Lammer, H., Zerkle, A. L., Gebauer, S., et al. 2018, Astron. Astrophys. Rev., 26, 1 [Google Scholar]
- Langenhorst, F. 2002, Bull. Czech Geolog. Surv., 77, 265 [Google Scholar]
- Langenhorst, F., & Deutsch, A. 2012, Elements, 8, 31 [Google Scholar]
- Li, J., Wu, Q., Li, J., et al. 2020, Geophys. Res. Lett., 47, e2020GL087758 [Google Scholar]
- Ma, C., Tschauner, O., Beckett, J. R., et al. 2016, Geochim. Cosmochim. Acta, 184, 240 [Google Scholar]
- McCoy, T. J., Ketcham, R. A., Wilson, L., et al. 2006, Earth Planet. Sci. Lett., 246, 102 [Google Scholar]
- McSween Jr, H. Y., Labotka, T. C., & Viviano-Beck, C. E. 2015, Meteorit. Planet. Sci., 50, 590 [Google Scholar]
- Miyahara, M., Ohtani, E., Ozawa, S., et al. 2011, Proc. Natl. Acad. Sci. U.S.A., 108, 5999 [Google Scholar]
- Miyahara, M., Ohtani, E., El Goresy, A., Ozawa, S., & Gillet, P. 2016, Phys. Earth Planet. Inter., 259, 18 [Google Scholar]
- Miyahara, M., Ohtani, E., Nishijima, M., & El Goresy, A. 2019, Phys. Earth Planet. Inter., 291, 1 [Google Scholar]
- Miyamoto, M., McKay, D. S., McKay, G. A., & Duke, M. B. 1986, J. Geophys. Res.-Solid Earth, 91, 12804 [Google Scholar]
- Murchie, S., & Erard, S. 1996, Icarus, 123, 63 [CrossRef] [Google Scholar]
- Mustard, J., Poulet, F., Gendrin, A., et al. 2005, Science, 307, 1594 [Google Scholar]
- Nestola, F., Balic-Zunic, T., Koch-Muller, M., et al. 2011, Mineral. Mag., 75, 2649 [Google Scholar]
- Obata, M., Mashimo, T., Ando, J., et al. 2023, Phys. Earth Planet. Inter., 338, 107009 [Google Scholar]
- Ohnishi, I., Tomeoka, K., & Ishizaki, N. 2007, J. Mineral. Petrol. Sci., 102, 346 [Google Scholar]
- Ohtani, E., Litasov, K., Hosoya, T., Kubo, T., & Kondo, T. 2004, Phys. Earth Planet. Inter., 143, 255 [Google Scholar]
- Okuchi, T., Seto, Y., Tomioka, N., et al. 2021, Nat. Commun., 12, 4305 [Google Scholar]
- Pang, K. D., Rhoads, J. W., Lane, A. L., & Ajello, J. M. 1980, Nature, 283, 277 [Google Scholar]
- Pieters, C. M., & Noble, S. K. 2016, J. Geophy. Res.-Planets, 121, 1865 [Google Scholar]
- Poggiali, G., Matsuoka, M., Barucci, M., et al. 2022, Mon. Not. Roy. Astron. Soc., 516, 465 [Google Scholar]
- Qi, C., Zhao, Y.-H., Zimmerman, M. E., Kim, D., & Kohlstedt, D. L. 2021, J. Geophys. Res.-Solid Earth, 126, e2020JB019629 [Google Scholar]
- Rampe, E., Ming, D., Blake, D., et al. 2017, Earth Planet. Sci. Lett., 471, 172 [Google Scholar]
- Reisener, R., Goldstein, J., & Petaev, M. 2006, Meteorit. Planet. Sci., 41, 1839 [Google Scholar]
- Rivkin, A., Brown, R., Trilling, D., Bell Iii, J., & Plassmann, J. 2002, Icarus, 156, 64 [NASA ADS] [CrossRef] [Google Scholar]
- Root, S., Townsend, J. P., Davies, E., et al. 2018, Geophys. Res. Lett., 45, 3865 [Google Scholar]
- Salisbury, J. W., & Walter, L. S. 1989, J. Geophys. Res.-Solid Earth, 94, 9192 [Google Scholar]
- Sanchez, J. A., Reddy, V., Kelley, M. S., et al. 2014, Icarus, 228, 288 [CrossRef] [Google Scholar]
- Sazonova, L. V., Fel’dman, V. I., Kozlov, E. A., Dubrovinskaya, N. A., & Dubrovinskii, L. S. 2006, Geochem. Int., 44, 137 [Google Scholar]
- Sekine, T., Kobayashi, T., Nishio, M., & Takahashi, E. 2008, Earth Planets Space, 60, 999 [Google Scholar]
- Sharp, T. G., & DeCarli, P. S. 2006, Meteor. Early Solar Syst. II, 943, 653 [Google Scholar]
- Sheldon, B. W., & Rankin, J. 2002, J. Am. Ceram. Soc., 85, 683 [Google Scholar]
- Shklyaev, A., Latyshev, A. V., & Ichikawa, M. 2010, Semiconductors, 44, 432 [Google Scholar]
- Simonds, C. H., Floran, R. J., McGee, P. E., Phinney, W. C., & Warner, J. L. 1978, J. Geophys. Res.-Solid Earth, 83, 2773 [Google Scholar]
- Smyth, J. R., Kawamoto, T., Jacobsen, S. D., et al. 1997, Am. Miner., 82, 270 [Google Scholar]
- Steel, D. 1998, Planet Space Sci., 46, 473 [Google Scholar]
- Stöffler, D., Hamann, C., & Metzler, K. 2018, Meteorit. Planet. Sci., 53, 5 [Google Scholar]
- Stojic, A. N., Morlok, A., Tollan, P., et al. 2021, Icarus, 357, 114162 [Google Scholar]
- Syono, Y., Goto, T., Sato, J., & Takei, H. 1981, J. Geophys. Res.-Solid Earth, 86, 6181 [Google Scholar]
- Takenouchi, A., Mikouchi, T., & Kogure, T. 2017, Meteorit. Planet. Sci., 52, 2491 [Google Scholar]
- Thomas-Keprta, K. L., Clemett, S. J., Mckay, D. S., Gibson, E. K., & Wentworth, S. J. 2009, Geochim. Cosmochim. Acta, 73, 6631 [Google Scholar]
- Tielke, J. A., Peslier, A. H., Christoffersen, R., et al. 2022, J. Geophys. Res. Planets, 127, e2021JE007042 [Google Scholar]
- Tiwari, K., Ghosh, S., Miyahara, M., & Ray, D. 2021, Geophys. Res. Lett., 48, e2021GL093592 [Google Scholar]
- Tiwari, K., Ghosh, S., Miyahara, M., & Ray, D. 2022, J. Geophys. Res.-Planets, 127, e2022JE007420 [Google Scholar]
- Tomeoka, K., Ohnishi, I., & Nakamura, N. 2001, Meteorit. Planet. Sci., 36, 1535 [Google Scholar]
- Tomioka, N., & Okuchi, T. 2017, Sci. Rep., 7, 17351 [Google Scholar]
- Treiman, A. H., Dyar, M. D., McCanta, M., Noble, S. K., & Pieters, C. M. 2007, J. Geophy. Res.-Planets, 112, E04002 [Google Scholar]
- Tripoliti, E. K., Dobson, D. P., Fortes, A. D., et al. 2023, Mineral. Mag., 87, 789 [Google Scholar]
- Van De Moortele, B., Reynard, B., McMillan, P. F., et al. 2007a, Earth Planet. Sci. Lett., 261, 469 [CrossRef] [Google Scholar]
- Van de Moortèle, B., Reynard, B., Rochette, P., et al. 2007b, Earth Planet. Sci. Lett., 262, 37 [CrossRef] [Google Scholar]
- Walton, E. L. 2013, Geochim. Cosmochim. Acta, 107, 299 [Google Scholar]
- Wang, Z., Lin, H., Ye, B., et al. 2024, A&A, 690, A138 [NASA ADS] [CrossRef] [EDP Sciences] [Google Scholar]
- Warren, P. H. 1994, Icarus, 111, 338 [NASA ADS] [CrossRef] [Google Scholar]
- Wu, Y., Wang, Y. B., Zhang, Y. F., et al. 2012, Chin. Sci. Bull., 57, 894 [Google Scholar]
- Xie, Z., & Sharp, T. G. 2004, Meteorit. Planet. Sci., 39, 2043 [Google Scholar]
- Xu, J., Mo, B., Wu, Y., et al. 2023, A&A, 672, A115 [NASA ADS] [CrossRef] [EDP Sciences] [Google Scholar]
- Yagi, T., Akaogi, M., Shimomura, O., Suzuki, T., & Akimoto, S.-I. 1987, J. Geophys. Res.-Solid Earth, 92, 6207 [Google Scholar]
- Yang, Y., Li, S., Milliken, R. E., et al. 2019, J. Geophy. Res.-Planets, 124, 31 [Google Scholar]
- Yavas, O., Leiderer, P., Park, H. K., et al. 1993, Phys. Rev. Lett., 70, 1830 [Google Scholar]
- Zhang, L., Zhao, B., Xue, L., et al. 2013, J. Synchrot. Radiat., 20, 413 [Google Scholar]
- Zhao, Y., Zimmerman, M. E., & Kohlstedt, D. L. 2009, Earth Planet. Sci. Lett., 287, 229 [CrossRef] [Google Scholar]
All Tables
Literature-based estimates of shock pressure prediction for Mg-rich olivine and basalt on Mars.
All Figures
|
Fig. 1 Scanning electron microscope (SEM) images illustrating the morphological changes in olivine samples before and after impact. (a) Secondary electron (SE) image of unshocked Fa50 olivine, showing its original texture. (b) SE image of olivine shocked at 18 GPa, displaying a distinctive “slag-like” texture. (c) SE image of olivine shocked at 31 GPa (melt dark region), revealing the development of flocculent structures. The olivine displays loose, irregular features resembling floccules. (d) SE image of olivine shocked at 31 GPa (melt dark region), revealing the development of shrinkage structures. The olivine underwent a noticeable reduction in volume after impact, accompanied by surface wrinkling. (e) SE image of olivine shocked at 41 GPa, displaying pronounced shrinkage features. (f) SE image of olivine shocked at 47 GPa, showing intense shrinkage and melting, with conspicuous voids formed due to contraction. |
| In the text | |
|
Fig. 2 Box plot of iron content in shocked olivine measured by SEMEDS. The blue and red boxes represent the interquartile ranges (25–75%) of the primary iron content in unshocked and shocked samples, respectively, under different shock pressures. The whiskers extending from the boxes represent the maximum and minimum iron content values. Diamond-shaped markers above the boxes denote individual iron content data points for olivine samples at different shock pressures, whereas the black horizontal lines indicate the mean iron content. No box is shown for the 41 GPa condition due to insufficient SEM data collected during measurements. |
| In the text | |
|
Fig. 3 Crystal defects in shocked minerals observed via TEM. (a) Bright-field (BF) TEM image of olivine shocked at 18 GPa, showing dislocations and dislocation lines within the crystal. The crystallographic direction of the operative vector (g) for parallel dislocations is (011). (b) High-resolution TEM (HRTEM) image and fast Fourier transform (FFT) pattern of the region outlined by the dashed box in image (a), identifying the mineral as fayalite after calibration. (c) BF TEM image of olivine shocked at 18 GPa, revealing dislocation loops within the olivine. (d) HRTEM image and selected area electron diffraction (SAED) pattern of a sample shocked at 31 GPa, identifying the mineral as augite, with stacking faults distributed perpendicular to the a-axis. (e) BF TEM image and SAED pattern of olivine shocked at 41 GPa, showing intersecting dislocations at nodes. (f) BF TEM image of olivine shocked at 47 GPa, where intersections of two or three different dislocations at nodes are observed. |
| In the text | |
|
Fig. 4 Iron migration in minerals observed via TEM. (a and b) Dark-field (DF) TEM image and corresponding iron elemental mapping of olivine shocked at 31 GPa. A ring of vesicles is observed along the grain edges (a). The interior of the olivine is Fe-rich, with an average Fa# of 50, whereas the edges are relatively Fe-poor, with an average Fa# of 34 (b). (c and d) DF TEM image and iron elemental mapping of olivine shocked at 41 GPa. Nanoscale Fe-rich particles are concentrated at grain corners. The Fe distribution within the olivine exhibits a three-layer zoning pattern. The core maintains its original Fe composition with an average Fa# of 50. The intermediate layer shows a substantial decrease in Fe content, with an average Fa# of 35. In contrast, the outermost rim has the highest Fe enrichment, reaching an average Fa# of 74. (e and f) DF TEM image and Fe elemental mapping of olivine shocked at 47 GPa. Nanoscale metallic iron particles are dispersed at grain corners, edges, and within the interior. The iron distribution follows a similar zonal pattern as those observed in (d). The core maintains its initial Fa# of 54, with the middle layer relatively Fe-poor (average Fa# of 37) and the outermost rim Fe-enriched (average Fa# values 75). These variations in Fe contents indicate substantial Fe migration within the olivine due to the shock events. |
| In the text | |
|
Fig. 5 TEM images of iron particles. (a) DF image of olivine shocked at 47 GPa, showing nanoscale particles concentrated at the corners of olivine grains. The dashed arrow marks the location of the elemental line scan, while the dashed box marks the area corresponding to image (d). (b and c) Fe and O elemental mapping of olivine shocked at 47 GPa, revealing that the nanoscale particles are iron-rich and oxygen-free. (d) HRTEM image of an iron particle, with a diameter reaching up to 100 nm. The particle exhibits distinct contrast variations, divided into upper, middle, and lower regions, which are identified as α-Fe through FFT calibration. (e) Elemental line scan across the iron particle, demonstrating a sharp increase in Fe abundance, while the O, Mg, and Si abundances drop to zero within the particle. (f–h) FFT patterns of the upper, middle, and lower regions of the iron particle. The upper region has a crystal orientation of |
| In the text | |
|
Fig. 6 TEM images of iron particles. (a) HRTEM image of an iron-rich particle region in the sample shocked at 41 GPa. The iron-rich particle is identified as magnetite, with a crystal axis orientation of |
| In the text | |
|
Fig. 7 Statistical analysis of Fa# in Fa50 olivine under different shock pressures via TEM-EDS. The red, blue, and yellow boxes represent the distribution ranges (25–75%) of iron content in the core, middle layer, and rim of olivine under different shock pressures, respectively. Whiskers extending from the boxes indicate the maximum and minimum Fe content values. The diamond-shaped markers above the boxes correspond to individual Fe content data points for olivine samples at various shock pressures, whereas the black horizontal lines denote the mean Fe content. “47 GPa-γ Fe0” and “47 GPa-α Fe0” represent olivine regions where γ-phase and α-phase metallic Fe formed, respectively. |
| In the text | |
|
Fig. 8 Vesicles observed via TEM in shocked samples. (a) BF TEM image of olivine shocked at 18 GPa, showing a small number of vesicles distributed along fractures within the olivine. (b) DF TEM image of olivine shocked at 41 GPa, where low-contrast vesicles are visible along fractures of the olivine grains. The dashed box marks the location of the HRTEM image in (c). (c) HRTEM image of a fracture in olivine, revealing that crystal planes on both sides of the fracture remain continuous and fully connected. (d) BF TEM image of olivine shocked at 47 GPa, displaying numerous dislocation structures within the olivine, accompanied by nanoscale vesicles. |
| In the text | |
|
Fig. 9 Statistical analysis of Raman spectra. The black and red solid circles correspond to DB1 and DB2, respectively, while the dashed lines indicate overall trends. (a) Scatter plot showing variations toward lower wavenumbers in Raman peak positions across different shock pressures. (b) Scatter plot illustrating changes in Raman full width at half maximum (FWHM) under different shock pressures, showing that the FWHM of DB1 gradually increases, while the FWHM of DB2 first decreases and then increases. (c) Scatter plot depicting the difference in Raman peak positions, along with the cumulative frequency distribution of FWHM across different shock pressures. The peak separation (ω) of the shocked olivine samples showed an overall increasing trend, while the cumulative ΣFWHM exhibited a trend of first decreasing and then increasing. (d) Scatter plot displaying a trend of first decreasing and then increasing variations in Raman peak areas as a function of shock pressures. |
| In the text | |
|
Fig. 10 Mid-infrared spectra and statistical analysis of unshocked and shocked Fa50 olivine. (a) Average mid-infrared spectra of olivine in the range of 1250–650 cm−1 under different shock pressures. The MIR reflectance intensity of the shocked olivine samples exhibited a general decrease compared to that of the initial unshocked samples. (b) Point-line plot illustrating the variations in the CF (Christiansen feature) and RB (Reststrahlen band) peaks positions in the mid-infrared spectra of olivine samples as a function of shock pressure. At 47 GPa, RB1 developed a shoulder peak, causing it to be excluded from the statistical graph. Note that, at 31 GPa, two distinct regions, greenish white (powdered) and black (melted), were observed with the naked eye (Fig. A.1d). This results in CF and RB exhibiting two different values for the 31 GPa condition, representing the powdered and melted results, respectively. The RB2 and RB3 peaks remain relatively stable overall, CF, RB1, and RB4 peaks exhibited evident shifts under shock pressures. |
| In the text | |
|
Fig. 11 VNIR spectra and statistical analysis of Fa50 olivine under different shock pressures. (a) Average VNIR spectra of olivine under different shock pressures. (b) Normalized VNIR spectra at 700 nm with continuum removal across different shock pressures. Note that, at 31 GPa, two distinct regions, greenish white (powdered) and black (melted), were observed with the naked eye (Fig. A.1d). The spectra shown in blue represent the average of these two regions, while the insets in (a) and (b) display the VNIR spectra of these two regions separately, along with their averaged spectrum. (c) Point-line plot illustrating variations in absolute reflectance values, absorption depths, and spectral slopes of average olivine spectra under different shock pressures. Absolute reflectance and absorption depth correspond to the left y-axis, while spectral slope corresponds to the right y-axis. The band depth is defined as the minimum reflectance value at the absorption center near 1055 nm, determined from the continuum-removed reflectance curves. The slope is defined as the ratio of absolute reflectance at 1650 nm to that at 700 nm, calculated from reflectance spectra normalized at 700 nm. The dashed lines represent trend lines fitted using quadratic or cubic functions. The VNIR reflectance values and band depth of the shocked samples generally increased at lower shock pressure (18 GPa) but decreased at higher shock pressures. Additionally, the shocked olivine samples exhibited a blue shift at lower shock pressure (18 GPa), but a red shift at higher shock pressures. |
| In the text | |
|
Fig. A.1 Photographs of processed and shocked samples. (a) Photograph of the cut samples, showing a semicircular Fa50 olivine slab with a thickness of 1 mm and a diameter of 12 mm. (b) Photograph of the sample mounted on a copper holder, prepared for shock experiments. (c) Photograph of the shocked sample embedded in the recovery target. The flyer plate exhibits inward deformation due to the shock impact at 18, 31, 41, and 47 GPa. (d) Photographs of the shocked samples after recovery using a lathe, with the samples remain enclosed within the residual copper sample holders. After impact, samples subjected to 18 GPa and 31 GPa exhibited substantial fragmentation, with the resulting powdered samples appearing greenish white. Meanwhile, the 31 GPa sample was partially melted and appeared black. At higher shock pressures (41 GPa and 47 GPa), melting occurred in the impacted olivine, resulting in a predominantly black appearance. |
| In the text | |
|
Fig. A.2 Additional features of the shocked samples observed via TEM. (a) HRTEM image of olivine shocked at 18 GPa. The upper part of the olivine exhibits a crystal structure similar to that of olivine shocked at 14 GPa, whereas the lower part resembles the characteristics of olivine shocked at 11.7 GPa (Kudoh & Takeda 1986). The dashed boxes indicate the locations for FFT analysis in the upper and lower parts. The dashed box on the upper right marks the area corresponding to image (b). (b) HRTEM image of olivine, showing numerous well-defined olivine fragments distributed within a matrix of olivine with less distinct lattice structures. The FFT pattern reveals polycrystalline rings, indicating structural disorder. (c) BF TEM image of olivine shocked at 18 GPa, where residual SiO2 from the synthesis is visible. The dashed box marks the location of image (d). (d) FFT patterns of olivine and SiO2. The white dashed lines serve as symmetry guides for the olivine crystal structure, whereas the yellow dashed lines highlight the amorphous ring of SiO2. |
| In the text | |
|
Fig. A.3 Raman spectra of Fa50 olivine under different shock pressures. The gray-shaded regions on the left and right indicate the minimum and maximum wavenumbers for the DB1 and DB2 doublets of Fa50 olivine across different shock pressures. The left gray region spans from 817.5 cm−1 to 821.3 cm−1, and the right gray region extends from 847.0 cm−1 to 849.5 cm−1. |
| In the text | |
Current usage metrics show cumulative count of Article Views (full-text article views including HTML views, PDF and ePub downloads, according to the available data) and Abstracts Views on Vision4Press platform.
Data correspond to usage on the plateform after 2015. The current usage metrics is available 48-96 hours after online publication and is updated daily on week days.
Initial download of the metrics may take a while.