| Issue |
A&A
Volume 694, February 2025
|
|
|---|---|---|
| Article Number | A304 | |
| Number of page(s) | 22 | |
| Section | Planets, planetary systems, and small bodies | |
| DOI | https://doi.org/10.1051/0004-6361/202453080 | |
| Published online | 21 February 2025 | |
Insights into the origins of Phobos and Deimos based on a spectral comparison with small bodies and Martian materials
1
LIRA, Observatoire de Paris, Université PSL, Sorbonne Université, Université Paris-Cité, CY Cergy Paris Université, CNRS,
5 place Jules Janssen,
92195
Meudon,
France
2
LATMOS, CNRS, Université Versailles St-Quentin, Université Paris-Saclay, Sorbonne Université,
11 Bvd d’Alembert,
78280
Guyancourt,
France
3
INAF-Astrophysical Observatory of Arcetri,
largo E. Fermi n.5,
50125
Firenze,
Italy
4
Institute of Space and Astronautical Science, Japan Aerospace Exploration Agency,
Sagamihara, Kanagawa
2525210,
Japan
5
Institut d’Astrophysique Spatiale, Université Paris-Saclay, CNRS,
91405
Orsay,
France
★ Corresponding author; This email address is being protected from spambots. You need JavaScript enabled to view it.
Received:
20
November
2024
Accepted:
26
January
2025
Abstract
Context. The origins of Phobos and Deimos are highly debated, and several distinct hypotheses have been put forth. The two most widely accepted theories are that (1) the two moons were created by a giant impact in analogy to the Earth-Moon system, whereby a debris disk was formed that then formed the two moons by accretion; and that (2) the moons were captured by the gravitational attraction of Mars.
Aims. To address questions about the origins of the Martian moons, we conducted a systematic search for analogs of Phobos and Deimos among asteroids, Martian terrains, and laboratory data using spectroscopy in the visible, near-infrared, and mid-infrared wavelength ranges.
Methods. We analyzed our dataset using multivariate statistical analysis techniques, namely principal component analysis and t-distributed stochastic neighbor embedding, on the spectral slope derived in various wavelength ranges, and on the albedo. Additionally, a visual comparison of the mid-infrared spectra, focusing on key features such as the Christiansen feature and the Reststrahlen bands, was performed.
Results. The comparison of the spectra of Phobos and Deimos with those of primitive asteroids reveals that the Martian moons exhibit spectroscopic similarities to D- and Z-type asteroids, as well as to Jupiter Trojans, centaurs, and potentially extinct comets. The blue unit on Phobos, generally considered as fresher areas that are mostly seen around the Stickney crater, appears to be spectrally best matched by P-type asteroids. No Martian terrain shows similarities with Phobos and Deimos. It is also notable that the Martian moons exhibit a spectroscopic resemblance to some of the Martian Trojans.
Conclusions. The analysis of available spectral data for asteroids, Mars trojans, and Martian terrains provided a unique opportunity to explore the origins of Phobos and Deimos prior to the arrival of the JAXA/Martian Moon eXploration (MMX) in the Martian system, which is scheduled for 2027. In light of the similarities between the Martian moons and Z-type asteroids, we put forward the hypothesis that Phobos and Deimos may have originated from one or two captured asteroids from the inner main belt, rather than from the outer main belt or the Jupiter trojans, as is often postulated. The formation of Phobos and Deimos may also have occurred simultaneously with that of the Mars trojans. This is a plausible scenario if the formation of the trojans was caused by the impact that created the Borealis basin, although additional processes such as space weathering may be necessary to explain the spectroscopic differences.
Key words: methods: data analysis / techniques: spectroscopic / minor planets, asteroids: general / planets and satellites: composition / planets and satellites: individual: Phobos / planets and satellites: individual: Mars
© The Authors 2025
 Open Access article, published by EDP Sciences, under the terms of the Creative Commons Attribution License (https://creativecommons.org/licenses/by/4.0), which permits unrestricted use, distribution, and reproduction in any medium, provided the original work is properly cited.
This article is published in open access under the Subscribe to Open model. This email address is being protected from spambots. You need JavaScript enabled to view it. to support open access publication.
1 Introduction
The Martian system is composed of two small and irregularly shaped moons, Phobos and Deimos, that orbit Mars. The system is uniquely suited for constraining the origins and dynamical evolution of the Solar System. Although multiple hypotheses for the formation of these moons have been proposed, their origins remain an open question. One main hypothesis suggests that Phobos and Deimos are asteroids that were captured from the main belt (e.g., Hunten 1979; Hartmann 1990; Higuchi & Ida 2017). The highly cratered surface, the low albedo, and the red and featureless spectra that resemble those of primitive asteroids support this capture theory (Murchie et al. 1991; Murchie & Erard 1996; Rivkin et al. 2002; Pajola et al. 2012; Fraeman et al. 2012, 2014; Pajola et al. 2018; Takir et al. 2022; Fornasier et al. 2024). However, the mechanism for explaining these gravitational captures and the current orbital configuration (i.e., circular and equatorial orbit) is difficult to determine without invoking highly specific conditions. Two main ways have been proposed to explain the possibility of this asteroid capture: (1) As the asteroid approaches Mars, it is likely to experience a significant gas drag force due to its high velocity. This causes the body to arrive within the Martian influence sphere. The gas drag would be sufficient to circularize the orbit (Hunten 1979; Pollack et al. 1979). (2) Alternatively, an asteroid arriving with low velocity in the Martian gravitational sphere could be relatively easily trapped into the L1 (or L2) Lagrangian point (Higuchi & Ida 2017). The advantage of this explanation is that it requires only minimum gas drag. A capture at L1would be temporary because L1 is not a stable point, and the asteroid could collide with Mars in less than 30 000 years (Sasaki 1990). However, several numerical simulations have tried to reconstruct the current orbits of the Martian moons for both explanations, but none was able to fully modify the estimated initial orbits to the current orbits (e.g., Burns 1992; Craddock 1994, 2011; Rosenblatt 2011).
The other main compelling hypothesis posits that Phobos and Deimos may have formed from a giant collision between a planetesimal and early Mars (e.g., Craddock 2011; Rosenblatt et al. 2016; Canup & Salmon 2018). A debris disk resulting from the impact and the ejected materials may have accreted to the current two moons. The Borealis basin in the northern hemisphere ars may be the remnant of such an impact because a massive collision would be needed to account for the mass of the putative debris disk (Craddock 2011). Although the thermophysical properties of the debris disk depend on the size and velocity of the impactor, all models suggest that disk materials would likely reach peak temperatures exceeding 1000 K after the impact (Hyodo et al. 2017). This would lead to the depletion of volatiles in the precursor materials of Phobos and Deimos. The results of this theory do not match the current size and orbit for the two moons and fail to accurately explain the photometric and spectroscopic properties of Phobos and Deimos. In this case, the moons would be composed of materials that were created at high temperatures, such as basalt, and they might be composed of a mixture of impactor and Martian materials. The spectra of these materials differ significantly from those of Phobos and Deimos, and it remains uncertain whether space weathering alone can account for this discrepancy.
Other theories have been proposed with in situ formation. We list them below.
Recycling: After a giant impact, the resultant debris disk leads to the formation of a moon that is larger than the actual Phobos. Because the moon is formed by the accretion of materials, it is a rubble-pile body. The tidal forces pull the moon toward Mars and it therefore crosses the Roche limit. This passage destructs the rubble-pile body and spreads the materials into a debris ring. Some of the debris that spread beyond the Roche limit eventually accretes to form a moon that is smaller than the current Phobos. This process repeats over time, and the size of the moon will become comparable to Phobos after six repetitions (Hesselbrock & Minton 2017; Cuk et al. 2020). This process can explain the current Deimos inclination (Cuk et al. 2020). However, the cyclic destruction of the Phobos progenitor should have produced a ring around Mars that would have persisted within the estimated timescale, but no such ring is observed today. Hence, Phobos is unlikely to have been formed only as a result of a recycling process (Madeira et al. 2023).
Coaccretion: The in situ formation of Phobos and Deimos may not be caused by a giant impact alone. The theory of coaccretion was put forth by Woolfson (1978) to explain the formation of the Martian moons at the birth of the Solar System: The dust, pebbles, and planetesimals orbiting the Sun would be collected and accreted by the proto-Mars and proto-moons. In this hypothesis, the moons should exhibit the same composition as the Martian bulk.
Formation from a single ancient body: Bagheri et al. (2021) proposed that Phobos and Deimos might be the results of the tidal destruction of a single progenitor that split the original body into the two moons. However, numerical simulations by Hyodo et al. (2022) showed that the formation of Phobos and Deimos from such a single progenitor would create a debris ring, and the moons would likely be disrupted by collisions. This is inconsistent with the actual Martian system.
Disruptive partial capture of an asteroid (Kegerreis et al. 2025): this recent theory offers an alternative hypothesis that lies between the two main categories of the Martian moon formation by asteroid capture and in situ formation. This hypothesis shares similarities with the hypothesis of a formation from a single ancient body. In this case, however, the disruption of the initial asteroid does not result in the direct formation of the two moons. The disruption instead leads to the formation of a debris disk, in which satellites may form after collisional processes.
We finally refer to Kuramoto (2024) for more details about the different hypotheses for the origin of Phobos and Deimos.
We explore the spectroscopic properties of asteroids and Martian terrains by analyzing both ground-based and remotesensing data. This provides new insights and generates alternative hypotheses for the origins of Phobos and Deimos.
2 Methods
We begin the study by identifying several primitive asteroids that match the spectra of Phobos and Deimos best in the visible and near-infrared (NIR) ranges. We base this on a survey of 139 spectra and on a multivariate statistical analysis. We then extend the investigation of their spectral similarity by comparing spectral features in the NIR and mid-infrared (MIR) wavelength ranges. Additionally, we compare the spectra of Phobos and Deimos with materials that we selected for their close association with the Martian system, that is, the Mars terrains, trojans, and meteorites.
2.1 Dataset
We considered the Phobos and Deimos spectra obtained by the Mars Reconnaissance Orbiter (MRO)/Compact Reconnaissance Imaging Spectrometer for Mars (CRISM) instrument (Fraeman et al. 2014) for comparison in the visible near-infrared (VNIR) wavelength range (see Appendix C). We used the singlescattering albedo spectra that were derived by inversion of the Hapke model in Fraeman et al. (2014). These are therefore by definition independent of the illumination and observing condition. In the MIR wavelength range, two spectra are available in the literature. We used the spectrum obtained by Glotch et al. (2018) with the Mars Global Surveyor (MGS)/Thermal Emission Spectrometer (TES) instrument as our main reference for comparison. However, it should be noted that MIR spectra of the Martian moons were also obtained by Giuranna et al. (2011), but they vary strongly depending on the orbit. They therefore appear to be less reliable (Fig. D.1). Nevertheless, we took all data into account since the MIR spectra of Phobos and Deimos remain poorly understood.
The VNIR reflectance spectra of asteroids we used were obtained from various surveys conducted via ground-based observations, in addition to data from Gaia DR3 (Gaia Collaboration 2016, 2023b,a). We refer to Appendix A for the complete list of observations. To access the different spectra repositories, we used the classy1 Python tool developed by Mahlke et al. (2022). The asteroid datasets were chosen based on their spectroscopic properties. The dataset was constructed by predominantly including asteroid spectra in the wavelength range of 0.5–2.45 µm. This approach resulted in the recovery of spectra primarily from the MIT-Hawaii Near-Earth Object Spectroscopic (MITHNEOS) survey. Because the spectra of Phobos and Deimos exhibit no clear absorption features, the search was limited to asteroids that were classified into featureless spectral types according to Mahlke’s taxonomy (Mahlke et al. 2022), including M-, P-, B-, C-, D-, and Z-type asteroids. We used the Mahlke taxonomy for the object classification because it is better adapted to distinguishing between extremely red objects (Z types) and very red objects (D types). The DeMeo taxonomy is listed in Table A.1, where all the objects we discuss are presented according to both classifications. Additionally, some spectra were selected based on their dynamical properties and potential significance for understanding the origins of Phobos and Deimos. These spectra were digitized from other papers when they were not available in a repository such as the Mars trojans spectra (Rivkin et al. 2003, 2007; Polishook et al. 2017; Christou et al. 2021; de la Fuente Marcos et al. 2024) and the Jupiter trojan Lucy mission targets (Wong et al. 2024). The NIR and MIR asteroid spectra were obtained from the Japanese space agency (JAXA)’s infrared space telescope AKARI observations through the AKARI catalog2 while NASA Spitzer space telescope observations were digitized from several publications (Marchis et al. 2012; Lowry et al. 2022; Humes et al. 2024a). For each AKARI spectrum, we filtered the data in order to consider only the flag-zero data points. To retrieve the physical parameters of the asteroids, the SsODNet was used Berthier et al. (2023) through the Python tool rocks3 (Table B.1).
CRISM VNIR spectra of the Martian surface end-members were downloaded from the MRO CRISM Type Spectra Library4 archived at NASA’s PDS Geosciences Node at Washington University in St. Louis (Viviano-Beck 2014). TES spectra of several regions of Mars were digitized from the respective publications (Christensen et al. 2000; Bandfield et al. 2000; Salvatore et al. 2018).
Some meteorite spectra were used for a visual comparison with Phobos and Deimos. The spectra were obtained through the RELAB5 and SSHADE6 databases of laboratory spectroscopy.
2.2 Spectroscopic analysis
VNIR spectra. The spectral slope was computed following the definition given in Fornasier et al. (2015),
 (1)
(1)
where S is the spectral slope, R1 (R2) is the reflectance at wavelength λ1 (λ2).
We computed the slope in two distinct wavelength domains: in the visible (0.7–0.9 µm), and in NIR (1.5–2.2 µm) regions. This approach enabled a comprehensive comparison with the red and featureless spectra of Phobos and Deimos, in particular, for deciphering variations between the blue and red units of Phobos.
To determine the best spectral match with Phobos and Deimos of all featureless asteroids, including B-, C-, M-, P-, D-, and Z-type asteroids, we used a χ2 algorithm. To apply this method, the spectra were first normalized at 0.55 µm and smoothed using a Savitzky-Golay filter to avoid the influence of noise in the χ2. The smoothing procedure was performed using a window length of 50 points (i.e., ~200 nm) and polynomial degree of 3 on each MITHNEOS spectra. For the few spectra that were obtained by individual observers used in this work, we verified and adjusted these two smoothing parameters. When multiple spectra were available for the same object, we computed the average to take into account the spectroscopic variations due to observation conditions, such as the photometric angles and atmospheric conditions.
3 µm region. Only a few observations of small bodies are available today for the 3 µm region in which the most important band lies that is related to hydration and water ice. The most recent spectral database in this range is based on observations from AKARI (Usui et al. 2019). Although the CRISM spectra of Phobos and Deimos have a gap in the data between 2.65 – 2.85 µm due to instrumental limitation, we visually compared the Martian moon observation with available AKARI asteroids spectra. The visual observation was therefore limited to the edges of the hydration band, and the selection of the asteroid from the AKARI database to which it was compared was led by the best match in the remaining wavelength range.
Multivariate statistical analysis. We applied the principal component analysis (PCA) and t-distributed stochastic neighbor embedding (t-SNE) to reduce the dimensionality of the dataset. The data were preprocessed in two different methods: (i) We resampled each spectrum between 0.5 and 2.45 µm into 100 channels, yielding spectral increments of 19.5 nm, normalized at 0.55 µm, and conducted multivariate analyses on these preprocessed spectra. (ii) For each spectrum, we computed three spectral properties, that is, the VIS slope (0.7–0.9 µm), the NIR slope (1.5–2.2 µm), and the albedo. We confirmed that the second method achieves more accurate separation of asteroid types by accounting for albedo variation and using a minimum number of variables to represent the spectral variability among featureless asteroids. Therefore, the results obtained with the second method are presented in this paper.
Prior to performing PCA and t-SNE, the data were standardized using a Z-score normalization procedure, which entailed rescaling the data to a normal distribution:  , where x is the raw data, µ is the mean, and σ is the standard deviation from the mean. Both PCA and t-SNE were then performed using the scikit-learn Python package (Pedregosa et al. 2011). We decided to use the first two components for both techniques because they account for over 95% of the total variance. The PC1 appears to mostly contain slope information, whereas the albedo is contained in PC2.
3 Spectral comparison with asteroids
3.1 VNIR slope and albedo
The current spectral taxonomy of Phobos indicates that the properties are very similar to those of a primitive D-type asteroid (Murchie & Erard 1996; Rivkin et al. 2002; Fraeman et al. 2012; Pajola et al. 2013; Fraeman et al. 2014; Pajola et al. 2018; Takir et al. 2022). By computing the spectral slopes in the visible (0.7 – 0.9 µm) and in the NIR (1.5 – 2.2 µm) from Phobos CRISM spectra (Fraeman et al. 2014), we show that Deimos is slightly redder (+22%) in the VIS slope than the Phobos red unit (RU), but both are significantly redder than the Phobos blue unit (BU) (+150%). The NIR slope is almost identical for Phobos RU and Deimos, and it is still higher than the Phobos BU spectral slope (+51%). Geometric albedos of Phobos RU and BU have been determined to be 0.0683 ± 0.0005 and 0.0837 ± 0.0005, respectively (Fornasier et al. 2024). The albedo of Deimos is similar to that of the Phobos RU (0.068 ± 0.007, Thomas et al. 1996). Although the spectra of Phobos and Deimos are mostly featureless, the potential presence of an O-H feature at 2.7–2.8 µm has been pointed out. This feature is linked to iron- bearing phyllosilicates and/or implantation by H+ ions from the solar wind (Fraeman et al. 2014). Ground-based observations from Rivkin et al. (2002) and Takir et al. (2022) suggested that the upper limit of this O-H absorption band depth is approximately 5%.
Our ground-based observations analysis of featureless asteroids, including B-, C-, M-, P-, D-, and Z-type objects (following Mahlke et al. 2022 taxonomy), in the 0.5 – 2.5 µm wavelength range shows that Phobos and Deimos are spectrally distinct from B- and C-type objects in their spectral slopes (Fig. 1). The spectral slopes of D- and Z-type objects are very similar to those of Phobos RU and Deimos, in particular, to some of the reddest asteroids. The Phobos BU, characterized by a lighter red spectral slope in the visible and NIR wavelength range than in the RU, is spectrally similar to P- and M-type asteroids (Figs. 1 and 2), even though the association with a metal-rich body is unlikely.
While some asteroids exhibit a relatively high albedo such as S and V types (0.2–0.3), the asteroids in the C group have a dark surface with an albedo lower than 0.1. The Phobos BU is significantly brighter than that of the D types. The albedo of the Phobos BU exceeds that of D types by about 20% of the standard deviation of the D types. The Phobos BU albedo agrees with the B and Z type albedo and also with some of the darkest M-type asteroids and some of the brightest P types. Although the VIS and NIR spectral slopes of Phobos RU and Deimos were shown to be highly consistent with both D- and Z-type asteroids, their albedo is rather inconsistent with D types; the albedos of Phobos RU and Deimos are comparable to or even brighter than those of the brightest D types. In contrast, the Phobos RU and Deimos albedo agrees well with that of Z-type asteroids (Fig. 2).
We also applied the PCA and t-SNE methods to gain a more global view of the best match within the various spectral types of the asteroids (Fig. 3). When we applied these methods to the asteroids dataset combined with the Phobos and Deimos data, we confirmed that the spectral properties of Phobos RU and Deimos agree with those of the D- and Z-type asteroid properties. Moreover, Phobos BU is extremely similar to M-type asteroids and only to some of the P types.
Following the population match analysis, an individual comparison of asteroid spectra and Martian moon spectra using χ2 showed that the best matches of all available asteroid spectra are the Z-type (1542) Schalen for Phobos RU, the M-type (69) Hesperia for Phobus BU, and the D-type (1143) Odysseus for Deimos (Table 1 and Fig. D.4). It is important to note that these best matches may be influenced by the potential spectral variability of a single body caused by phase angle, atmospheric conditions, asteroid rotation, and other factors. In this study, the asteroids and Martian moon spectra were acquired at different phase angles. To limit the effect of the phase angle, we used the SSA spectra of Phobos and Deimos (Fraeman et al. 2014). The spectral slopes of asteroids are influenced by the phase angle of the observations. This phenomenon is known as the phase reddening effect, which primarily depends on the albedo of the object (Shevchenko et al. 2016; Wilawer et al. 2024) and to a lesser extent on the spectral slope itself (Alvarez-Candal et al. 2019, 2022). However, the magnitude of this effect is generally lower than 0.01 µm−1 deg−1 for most asteroids (Alvarez-Candal et al. 2022). For example, observations of Ryugu and Bennu revealed slope changes of only 0.002 µm−1 deg−1 (Tatsumi et al. 2021) and 0.0004 µm−1 deg−1 (Fornasier et al. 2020), indicating a very weak phase angle effect. Because most asteroid spectra in this study were observed at phase angles between 5° and 30º, the phase reddening effect is limited to approximately 0.01 µm−1. This variation is smaller than the differences in the spectral slopes of the asteroid types (Fig. 2) and does not affect our discussion of the origins of Phobos and Deimos.
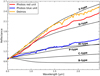 |
Fig. 1 Templates of featureless spectral types of asteroids of the Mahlke taxonomy (Mahlke et al. 2022), and comparison with Martian moon spectra (Fraeman et al. 2014). |
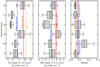 |
Fig. 2 VIS slope, NIR slope, and albedo of featureless asteroid types (i.e., B-, C-, M-, P-, D-, and Z-type objects) in comparison with Phobos blue unit, Phobos red unit, and the spectral parameters of Deimos. The spectral slopes for the Martian moons were computed on the spectra obtained by Fraeman et al. (2014), and the albedos were taken from Fornasier et al. (2024) for Phobos and from Thomas et al. (1996) for Deimos. |
Best asteroid matches (ordered by the lowest χ2, performed on 139 normalized spectra) in terms of spectral slope for the Phobos blue unit, the Phobos red unit, and Deimos (Fraeman et al. 2014).
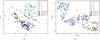 |
Fig. 3 PCA for the first two components PC 1 and PC 2, and t-SNE results for the first two components t-SNE 1 and t-SNE 2. |
3.2 Near- and mid-infrared features
The NIR and MIR spectra of the best-match list (based on VNIR spectra; Table 1) are also useful for a comparison with the spectral features of Phobos. Unfortunately, spectroscopic data beyond 2.5 µm are very sparse because it is difficult to observe from ground-based telescopes. In the 2.6 – 3 µm specific range observed by the JAXA/AKARI infrared space telescope, we analyzed the shape of the 2.7 – 2.8 µm feature and compared it with Phobos (Figs. 4 and D.3). The Phobos spectra acquired by the CRISM instrument indeed lack data in the 2.65–2.85 µm range, which hinders a direct comparison. Nevertheless, from the comparison between the AKARI database (filtered for best-match spectrum; Table 1) and the Martian moon spectra, the edge of the 2.7 µm band potentially matches that of the M-type (22) Kalliope and the P-type (153) Hilda spectra. Several possible shapes might match the gap since both hydrated mineral and water ice have a band minimum in this region. Absorptions near 2.72 µm and 2.75 µm are characteristic of magnesium-rich (Mg- OH) and aluminium-rich (Al-OH) phyllosilicates, respectively (de Sanctis et al. 2016). The OH stretch vibration of iron-rich (Fe- OH) phyllosilicates occurs near 2.8 µm (Manceau et al. 2000). The asymmetric OH stretch of water (H2O) in minerals occurs near 2.9 µm (Clark et al. 1990).
Moreover, D-type objects seem to be anhydrous and typically do not exhibit a hydration feature at ∼3.0 µm (Emery & Brown 2003; Takir & Emery 2012), as was possibly observed on Phobos and Deimos (Fraeman et al. 2014). For example, asteroids (908) Buda and (1542) Schalen, classified in the past as D type but now reclassified as Z type, match Phobos RU and Deimos in our analysis, although a possible faint absorption feature at ∼0.9 µm was found that was attributed to low-iron, low-calcium orthopyroxene (DeMeo et al. 2009).
Additional data for the 2.7 µm band were retrieved from recent Jupiter trojan observations (Wong et al. 2024), as shown in the appendix (Fig. D.2). Some similarities were observed in the slope between 1.6 µm and 2.5 µm, in particular, between (21900) Orus and Phobos RU/Deimos, or between (617) Patroclus and Phobos BU. However, all the Jupiter trojan spectra obtained by the JWST show wider and deeper features (when present) in the 2.6–3.0 µm region.
The 2.7 µm region is of particular importance because O-H features provide crucial insights into the formation of small bodies. The gap in the CRISM data does not allow us to reach a definitive conclusion regarding the presence of the aforementioned band, and if present, of its shape. We demonstrate that the 2.7 µm gap might be aligned with the broad and relatively shallow features observed in some M- or P-type asteroids. However, a deep and narrow feature similar to the one observed on Ryugu (Kitazato et al. 2019) and Bennu (Hamilton et al. 2019) is also possible. In the case of Phobos and Deimos, this wavelength gap will be addressed through future observations by the MMX Infrared Spectrometer (MIRS; Barucci et al. 2021).
The MIR spectra of asteroids (Fig. 5) that were studied with Spitzer data (Lim et al. 2011; Marchis et al. 2012; Lowry et al. 2022; Humes et al. 2024a) show no clear relation with the Phobos spectra (Glotch et al. 2018). Despite the presence of a plateau similar to those of asteroids, the Phobos plateau is shifted. The Phobos transparency features (TF), located at ~12 µm, match the trough observed in the spectrum of P-type (87) Sylvia relatively well. In the Phobos MIR spectra from PFS observations (Giuranna et al. 2011), no match is visible (Fig. D.1).
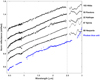 |
Fig. 4 Phobos BU spectrum compared with MITHNEOS-AKARI spectra of some of the best asteroid matches. The MITHNEOS and AKARI spectra cover from 0.5 to 2.5 µm and from 2.5 to 3 µm, respectively. The spectra are normalized at 2.5 µm and shifted by 0.1. |
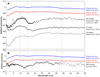 |
Fig. 5 MIR spectra of best-match asteroids (panel A) and of the Mars trojan Eureka (panel B) compared to Phobos blue unit and Phobos red unit spectra (Glotch et al. 2018). Starting from Phobos red unit, each spectrum is shifted by 0.08 to the bottom. Between 13 and 15 microns, the Spitzer data may be affected by instrumental artifacts. |
4 Spectral comparison with Martian terrains, Martian trojans, and Martian meteorites
4.1 VNIR spectra and albedo
In recent years, the detection and observation of Martian trojan asteroids has increased significantly. To date, 16 Mars trojans have been confirmed, with the majority (14) situated at the Martian L5 Lagrange point and only two at the L4 point. The spectroscopic data obtained on six of these asteroids, called (5261) Eureka, (101409) 1998 VF31, (121514) 1999 UJ7, (311999) 2007 NS2, (385250) 2001 DH47, and 2023 FW14, show that none of them are a perfect match to the Martian moons (Rivkin et al. 2003, 2007; Polishook et al. 2017; Borisov et al. 2018; Christou et al. 2021; de la Fuente Marcos et al. 2024). In particular, (5261) Eureka is the largest asteroid of the eponym family, which includes seven of the eight asteroids that are located at the L5, including (311999) 2007 NS2 and (385250) 2001 DH47. Asteroids from this family are generally classified as A-type asteroids (Borisov et al. 2017), with a broad and deep absorption at 1 µm and a red slope in the NIR (Mahlke et al. 2022). No such deep feature is visible in the spectra of Phobos and Deimos (Fig. 6). Furthermore, the visible geometric albedo of Eureka is at least three times higher than that of Phobos and Deimos. It is also noteworthy that the spectra of Mars trojans outside the Eureka family are not aligned with the spectroscopic properties observed for Phobos RU and Deimos, which exhibit a steeper red slope. However, the Phobos BU is consistent with the spectroscopic properties (particularly with the spectral slope) that were observed for the (101409) 1998 VF31, (121514) 1999 UJ7, and 2023 FW14 Mars trojans. The (101409) 1998 VF31 trojan exhibits a 1 µm absorption band (although it is smaller than the Eureka family asteroids) and an additional absorption band at 2 µm, indicating the presence of pyroxene. This means that it is a poor spectroscopic analog for Phobos and Deimos. The geometric albedo of (121514) 1999 UJ7 is also consistent within the uncertainties with that of Phobos and Deimos. The albedo for the other trojan asteroids unfortunately remains unknown.
Finally, we compared the Phobos and Deimos spectra with the currently identified mineral spectral signatures on Mars by the CRISM instrument on MRO (Fig. 7). Several classes of minerals were observed on Mars and are shown grouped in each panel of Fig. 7. No clear match is visible between the satellite spectra and the main mineral classes observed on Mars in terms of the slope, which is redder in Martian moon spectra in general. Some similarities are visible between the slope of two phyllosilicates, Al-smectite and kaolinite, and Phobos BU between 0.5 and 2 µm, while the reflectance at higher wavelengths is a mismatch because of the Mg-related features. Additionally, the first overtone of the OH stretching mode at 1.4 µm in the spectra of Al-smectite and kaolinite is absent from the Phobos BU spectrum. In general, Martian spectra are bluer and have deeper features than the Phobos and Deimos spectra. In addition, the albedo of Mars is higher than that of Phobos by a factor of 1.4 to 8.4. The darkening process acting on Phobos (which is linked with its composition, e.g., the presence of opaque materials, or external processes such as space weathering) might also cause the lack of features in the Phobos spectra (Poggiali et al. 2022; Wargnier et al. 2023a,b). If space weathering is indeed the process that causes the darkening, it is also likely to cause the reddening (e.g., Moroz et al. 2004; Hiroi et al. 2013; Brunetto et al. 2014; Keller et al. 2015), and therefore, it would help us to explain the extremely red spectrum of Phobos.
The aforementioned Martian comparison mainly involves minerals associated with a composition of the Martian moon of crustal materials that were altered by various processes at the surface. In the context of Phobos and Deimos, it is probable that the giant impact ejected material not from the crust, but from the mantle. The most suitable and only representative examples of the Martian mantle are the chassignites Martian meteorites. They were found to contain significant shock features because a major impact ejected this material into space. Chassignites are extremely rare, and there are only three identified specimens on Earth. They are olivine cumulate rocks (∼90 wt% of olivine), comparable to terrestrial dunites. Olivine in chassignites presents different Mg# ranging from 69 for Chassigny to 78% for NWA 2737 (e.g., Beck et al. 2006). This suggests that the band shape exhibited by chassignites differs from that of terrestrial olivine, such as the San Carlos olivine (Fo90). The evidence that NWA 2737 displays a relatively shallow 1 µm absorption when compared to San Carlos and Chassigny is more intriguing, even though the Mg# falls between the other two samples. It also exhibits a strong spectral slope in the VNIR. In the visible light, the olivine of the NWA 2737 appears brown and dark, which is likely due to the presence of iron nanoparticles npFe0, as previously observed by Pieters et al. (2008). While it may be challenging to justify the spectra of Phobos and Deimos using Chassigny as a reference for Martian mantle material, even considering the influence of space weathering, the spectral properties of NWA 2737 are particularly interesting (Fig. 8). The low reflectance, the red slope, and the weak 1 µm feature in the VNIR range might provide a plausible explanation for the featureless observed spectra of the Martian moons. However, the absence of the weak 1 µm feature in the spectra of Phobos and Deimos, along with discrepancies in slope (which are partially influenced by this feature) necessitate the presence of an external process (e.g., space weathering) or the effects of textural properties (e.g., porosity and roughness) in order to fully account for their spectral characteristics. For instance, coarse grains (>125 µm) of NWA 2737 affected by space-weathering processes may lead to an attenuation of the 1 µm feature and to the reddening effect on the chassignite, given its high olivine content and the results from previous laboratory studies on olivine samples (e.g., Loeffler et al. 2009; Fu et al. 2012; Chrbolková et al. 2021). On the other hand, an extremely high porosity could result in a blueing effect on the spectral slope (e.g., Schröder et al. 2021). Thus, while the presence of small grains of NWA 2737 with a highly porous surface could provide a potential explanation, further investigation is necessary to fully understand these spectral variations.
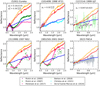 |
Fig. 6 Comparison between Martian moon spectra and Martian trojans. The geometric albedo pv of the various asteroids was obtained by Trilling et al. (2007) and Nugent et al. (2015) for (5261) Eureka ( |


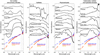 |
Fig. 7 Phobos and Deimos spectra from Fraeman et al. (2014) compared with the MRO CRISM Type Spectra Library (Viviano-Beck 2014) divided according to the major classes. The grey area between 2.65 and 2.84 µm corresponds to the lack of data in the CRISM spectra. |
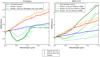 |
Fig. 8 Comparison between VNIR spectra of the chassignite meteorites NWA 2737 (DD-AHT-067, DD-AHT-068, and DD-AHT-069 obtained from RELAB database (Pieters et al. 2008) and from Mandon et al. 2021) and Chassigny (DD-MDD-023 and MR-MJG-104 obtained from RELAB database), and Phobos and Deimos spectra from Fraeman et al. (2014). The spectra are normalized at 0.55 µm. The reflectance at 0.55 µm (r550) is indicated in the figure for each laboratory spectra. |
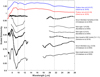 |
Fig. 9 Phobos and Deimos spectra from the TES instrument (Glotch et al. 2018) compared to major terrain of Mars acquired by TES (spectra from by Salvatore et al. (2018); Christensen et al. (2000); Bandfield et al. (2000)). The vertical dashed lines highlight main features in Phobos spectra at 9.8, 11.97, and 21.5 µm. Each spectrum is scaled by a factor reported in the figure legend. |
4.2 Mid-infrared features
Mars MIR observations were performed in the past 20 years by the TES instrument. We report in Fig. 9 some main types of Martian spectra compared to TES observations of Phobos and Deimos (Glotch et al. 2018). The main feature in almost every Martian spectrum is a large band around 9.1 µm (spanning from 8.3 to 12.5 µm), which is absent in the satellite spectra. This feature is attributed to the presence of basaltic rocks (Christensen et al. 2000; Bandfield et al. 2000). To facilitate the comparison, three vertical dashed lines at 9.8, 11.97, and 21.5 µm are plotted in Fig. 9 to highlight the main features in the Phobos spectra. Interestingly, the features at 21.5 µm in Phobos seem to be comparable with the hematite band in the Sinum Meridiani region. Moreover, the band at 9.8 µm is close to the basalt band at 9.1 µm, and a possible basalt composition for Phobos was indeed inferred using TES observations (Glotch et al. 2018). The differences in the band positions between the spectra can be attributed to a variety of factors, such as grain size (Shirley & Glotch 2019), composition, and different environmental conditions (Donaldson Hanna et al. 2012a,b).
Although no data are available in the 2.5 µm – 6 µm wavelength range for Mars trojans, the (5261) Eureka Martian trojan asteroid has been observed by Spitzer Space Telescope (Fig. 5).
The observation highlights the olivine-rich composition of the asteroid, which is dominated by a huge trough at approximately 11 µm. This feature matches in particular with Rumuruti chondrites, brachinites, and chassignites (Lim et al. 2011). This also agrees with VNIR observations of Eureka, showing a deep and large Fe2+ olivine absorption band at 1 µm. The only interesting match between the MIR spectra of Eureka and Phobos is the position of the Christiansen feature (CF) at ∼9 µm, which is relatively similar to the Phobos CFs. Despite the low signal-to- noise ratio of Eureka Spitzer spectra, a 25 µm emissivity feature is visible and linked to the forsterite (Fo) content. These silicate features are not visible at all in Phobos spectra or in the MIR and VNIR range, implying that (1) Phobos is poor in olivine and (2) that opaque materials and small grain sizes severely reduce this emissivity minimum (Poggiali et al. 2024).
5 Discussion
The results of the multivariate statistical analysis and the chi- squared match indicate that the spectral properties of Phobos and Deimos are similar to those of some taxonomic asteroid populations, particularly D and Z types, as well as to some Martian trojans. Additionally, the analysis revealed that the Phobos BU shows similarities to the P and M types. This section addresses the implications of these similarities in the context of the Martian moons, and it explores the possibility of potential new hypotheses for the origins of the Martian moons.
5.1 A Z-type progenitor or a cometary origin?
The observed spectroscopic similarities between the D and Z types with Phobos and Deimos in terms of albedo, spectral slopes, and absence of absorption features suggest that in the context of a captured origin, the Martian moons may have originated from one or two asteroids belonging to these taxonomies. As D-type objects were previously identified as suitable analogs for the Martian moons, our results from the multivariate statistical analysis (Fig. 3), chi-square match (Table 1) and the direct slope-albedo comparison (Fig. 2) clearly favored similarities with Z-type compared to D-type objects. Therefore, we investigated the implications of an origin linked to Z-type asteroids.
By definition, Z types are extremely red-slope objects with a low albedo. These spectroscopic properties are similar to those of Phobos RU and Deimos. Although Z types can also be found among the Jupiter trojan populations, their orbital distributions is different from that of D types (Mahlke et al. 2022). Jupiter trojans are primitive asteroids that formed and evolved beyond the snow line. They are among the most primitive objects in the Solar System, predominantly corresponding to D- or Z-type asteroids (e.g., Bendjoya et al. 2004; Fornasier et al. 2004, 2007; Roig et al. 2008; Mahlke et al. 2022). The spectra of these objects indicate the presence of organics (Wong et al. 2024) and exhibit properties similar to those observed in comets (e.g., Levison et al. 1997; Bendjoya et al. 2004; Fornasier et al. 2007). While red bodies, including D and Z types, are more common beyond the outer main belt, the inner and middle main-belt populations, although rare, tend to be extremely red, that is, Z types (Fig. E.1). The Z-type asteroids, characterized by their very red spectra, are observed predominantly in the inner main belt to middle main belt (Gartrelle et al. 2021; Mahlke et al. 2022; Humes et al. 2024b), and they may represent a distinct population of asteroids.
The spectral similarities with Z types implies that the Martian moons may originate not necessarily from the Jupiter trojans or the Hilda group, but from the inner main belt (<2.5 AU), with an initial low eccentricity and low inclination (<30°). The ejection of an object from the main belt can be attributed to its entry into a 4:1 or 3:1 resonance with Jupiter. The capture of an object exhibiting these initial dynamical properties would be a more easily explainable scenario than an origin linked to Jupiter trojans.
The Phobos RU and Deimos also display spectral characteristics comparable to those observed in some centaurs and extinct comets, including (944) Hidalgo (Hahn & Rickman 1985; Luu 1993; Lazzarin et al. 1996). Furthermore, the photometric properties of Phobos and Deimos have been found to be consistent with those of cometary nuclei and trans-Neptunian objects (Fornasier et al. 2024). However, a systematic comparison between centaurs and extinct comets and the red featureless spectrum of Phobos and Deimos is hard. This is because these objects are primarily classified according to their dynamical characteristics and not to their spectroscopic properties. Consequently, centaurs or extinct comets can exhibit a range of different spectroscopic characteristics, including absorption bands, a broad range of albedos, and a lighter red or even blue spectral slope, as observed in (3200) Phaeton. However, among extinct centaurs and comets, specific taxonomies are predominantly represented, such as D- and Z-type asteroids. These therefore act as a link between comets and asteroids.
Considering this close relation between D- and Z-type objects with centaurs and comets, we also considered the hypothesis of cometary origins for the Martian moons (Hartmann et al. 1987; Fornasier et al. 2024). This theory suggests an interior made of water ice, as proposed by Hartmann (1980, 1990), and Fanale & Salvail (1989, 1990). Despite the proximity to the Sun and the small size of Phobos, Fanale & Salvail (1989) found that a reservoir of water ice can subsist in the interior of Phobos, at least from medium to high latitudes, and it might be not entirely sublimated. The low density of water ice (< 1 g.cm−3) may explain the low density of the two moons.
Although no clear 3 µm spectral feature indicative of water ice has been detected on the surfaces of Phobos and Deimos because the data are limited (Rivkin et al. 2002; Takir et al. 2022; Fraeman et al. 2012, 2014), these data do not argue against the hypothesis of a cometary origin. For instance, faint 3 µm features with depths of 5–10% for Phobos (Rivkin et al. 2002) and 4–5% for Deimos (Takir et al. 2022) may still be present. The 3 µm feature may be significantly suppressed if exposed water ice only occurs on small scales (meter or submeter), similar to those detected on the cometary nucleus of 67P (Fornasier et al. 2016b, 2023). In addition, the possibility of a cometary origin cannot be excluded even if the 3 µm feature is completely absent. Ice would not be expected on the surface without active sublimation, as suggested from observations of potentially dormant or extinct comets (Licandro et al. 2018). Future observations with MMX instruments will be critical in testing this hypothesis. Observations with a high spatial resolution using MIRS will help us to detect possible local exposure of surface water ice, not only through the prominent 3 µm feature, but also via diagnostic bands at 1.05, 1.25, 1.5, and 2.0 µm (Raponi et al. 2016). Additionally, the MEGANE instrument will investigate potential subsurface ice to depths of up to 30 cm using gammaray and neutron measurements (Lawrence et al. 2019). These observations will provide strong insights into the captured-comet hypothesis.
However, if it is unlikely to capture an asteroid or a comet showing the orbital properties of the current Phobos and Deimos, it is highly improbable to gravitationally capture small bodies like this with highly eccentric and inclined orbits twice. The newly proposed hypothesis (Fornasier et al. 2024) of a binary comet that was broken up by tidal forces may be more probable, but it needs to be investigated dynamically.
5.2 A formation with Mars trojans?
The Martian trojans are of particular interest with regard to their dynamical properties and to their link to the history of the Martian system. Upon comparison of their spectroscopic properties with those of Phobos and Deimos, we identified several similarities that might suggest a similar history or at least a similar evolutionary path. Mars trojans are a distinctive population of small bodies within the Solar System that constitute the majority of trojan asteroids among terrestrial planets. The nature of Mars trojans is particularly intriguing because we lack definitive knowledge regarding their origin. As illustrated in Fig. 6, several spectral taxonomies coexist within the Martian trojans (e.g., de La Fuente Marcos & de La Fuente Marcos 2013; Christou 2013). Some of the asteroids exhibit A-type spectra and are attached to the Eureka family, while others are more similar to S- type or even to more primitive asteroids, such as (121514) 1999 UJ7 and 2023 FW14 (Borisov et al. 2017; de la Fuente Marcos et al. 2024). The diversity among the various Mars trojans gives rise to questions regarding the formation and evolution of these bodies. Notably, these questions agree with those pertaining to the origins of Phobos and Deimos.
The main group of Mars trojan asteroids located at L5 and part of the Eureka family are spectroscopically consistent with A-type asteroids. Based on the dynamical arguments and the discussed spectroscopic properties, Rivkin et al. (2003) argued that these trojan asteroids may have formed from a larger parent body in the early Solar System that was disrupted after the differentiation and experienced melting processes. Based on this, the Eureka family would initially stem from a single parent body. This might explain the significant similarities between the Eureka, 2007 NS2, and 2001 DH47 Mars trojans, for example. Cuk et al. (2015) explained a possible formation from rotationfission with the Yarkovsky–O’Keefe–Radzievskii–Paddack (YORP) effect. In considering the scarcity of olivine-rich bodies among asteroids (less than 1% according to DeMeo et al. 2019, but probably slightly more according to Galinier et al. 2024), Polishook et al. (2017) posited that the achondritic and chassignites-similar spectra may offer evidence of a formation mechanism for the Eureka family that can be attributed to a giant impact in which Martian mantle materials were excavated and ejected into the Martian system. A large impact would be necessary to form such an asteroid cluster at the L5, such as the one that formed the Borealis basin. We refer to Polishook et al. (2017) for the dynamical mechanism that can explain the transfer of materials from Mars to the L5 Lagrangian point.
The case of (101409) 1998 VF31 is different because the spectroscopic analysis showed that this body might be consistent with S-type asteroids (Rivkin et al. 2007; Christou et al. 2021), lunar highlands (Christou et al. 2021), or M-type asteroids (Christou et al. 2021). Based on laboratory data, the best match is provided either by a mixture of primitive achondrite and mesosiderite (Rivkin et al. 2007) or by a mixture of orthopyroxene and meteoritic iron (Christou et al. 2021). Christou et al. (2021) also argued that (101409) 1998 VF31 might have a Martian origin, as hypothesized by Polishook et al. (2017), even though the inclination of this trojan is much higher than that of the Eureka family. In this hypothesis, the pyroxene and iron- rich composition is more likely consistent with the Martian crust than the Martian mantle, as for the Eureka family. The iron content might therefore be a mixture of iron oxide that is highly present at the Mars surface and iron nanoparticles that formed through the space-weathering exposure of the surface. Nevertheless, the hypothesis that the Martian trojans L5 are created from the Eureka family with achondritic basaltic material, the (101409) 1998 VF31 asteroid from a single giant impact on the Martian northern hemisphere, appears to be a significant and complex combination of circumstances.
The spectra of Phobos and Deimos are significantly different from those of the L5 Eureka family trojans. If they were formed by a giant impact from the Borealis basin (Citron et al. 2015) at the same time as the Eureka family, they should have evolved in the same way in terms of space weathering, and are therefore assumed to exhibit the same surface composition and spectroscopic properties. This is not the case. In principle, the ejecta after the impact will be a mixture of Martian crust, Martian mantle, and impactor. As we described above, the two Martian moons will likely consist of a mixture of these different materials. To explain the different composition of the Eureka family, the Eureka parent bodies might represent only a particular endmember, and in this case, more probably the Martian mantle, considering the close relation with chassignites (Polishook et al. 2017). An additional process that might influence the alteration processes between the Martian moons and the Eureka family is the recycling process, which would not be expected to occur with the trojans because they are not concerned with the Roche limit.
The two currently known L4 Mars trojan asteroids exhibit a different behavior compared to the Eureka family, but it is also different from that of the other L5 trojans. The spectrum of (121514) 1999 UJ7 only has a limited spectral coverage in the visible region (0.55 – 0.85 µm) and a low signal-to-noise ratio (Rivkin et al. 2003; Borisov et al. 2018). However, from these available data, it appears that the trojans are part of the C- complex, and that a feature at 0.65 µm is visible. The data from Rivkin et al. (2003) and Borisov et al. (2018) are not consistent in terms of the spectral slope. While Rivkin et al. (2003) measured a positive slope in the visible wavelength range, the results from Borisov et al. (2018) supported a blue-slope asteroid in the same wavelength range. The difference is attributed to the rotational variability of the surface (Borisov et al. 2018). The observed spectroscopic differences between L5 and L4 trojans would indicate that some objects among Mars trojans might originate from the outer Solar System, beyond the snow line, that were captured in the L4 Lagrangian point in the early history of the Solar System. This capture would be possible according to dynamical simulations and the estimated dynamical lifetime by Scholl et al. (2005) and Schwarz & Dvorak (2012). The recently discovered second Mars L4 trojan asteroid 2023 FW14 has spectroscopic properties that are similar to those of (121514) 1999 UJ7, which as measured by Rivkin et al. (2003) belong to the C-complex, and more precisely, probably to the P-type group. This type of spectrum can be consistent with the Phobos BU. The two L4 asteroids are spectroscopically and dynamically more likely primitive captured asteroids (and may have a similar origin or parent body) from the Mars-crossing asteroid populations than formed in situ (de la Fuente Marcos et al. 2024).
Finally, Phobos, Deimos, and some Mars trojans (at least of the Eureka family) might have been created at the same time in the giant impact that caused the formation of the Borealis basin in the northern hemisphere of Mars. A match of the Phobos and Deimos spectra with those of altered Martian materials and Eureka family members would face the same difficulty (Sect. 5.3). If Phobos, Deimos, and the Mars trojans were created at the same time, they should have experienced the same alteration process during the same time. However, some other processes such as recycling (as discussed previously) and the mixing of materials from different quantities and sources, including the impactor, the Martian crust, and the Martian mantle, might occur as well. Furthermore, the Martian environment may contribute to the alteration of the Phobos and Deimos surfaces. Space weathering, caused by oxygen ions escaping from the upper Martian atmosphere (Nénon et al. 2019, 2021), and the potential for Martian dust to be redeposited at the surface of Phobos, may result in modifications to the spectroscopic properties.
5.3 An altered fragment of Mars?
The investigation of the spectral properties of the Martian surface endmembers did not match the spectra of the Martian moons satisfactorily. Fig. 7 shows no clear match between the Phobos and Deimos spectra and the CRISM major mineralogical classes observed on Mars (Viviano-Beck 2014). Most of the Mars spectra are bluer than Phobos and Deimos and have deeper features, especially for the 1 µm band, which is linked with olivine and pyroxene, and which is totally absent in the Phobos spectra. Some spectra exhibit smaller features, and therefore, they cannot be ruled out from the Phobos surface. The significant shock features observed in chassignites, in addition to the formation of npFe0 resulting from the giant impact, appear to exhibit notable spectroscopic similarities. These similarities may be a contributing factor to the dark, red, and featureless spectra observed in Phobos and Deimos.
The MIR range (Fig. 9) also shows substantial differences when we compare the Phobos and Deimos spectra with observations made by the same instrument of several regions of Mars (Bandfield et al. 2000; Salvatore et al. 2018). In particular, the main difference lies in the position of the CF, which is shifted to a smaller wavelength for Phobos, and the main feature at around 9.1 µm, which is linked to basaltic composition (Christensen et al. 2000; Bandfield et al. 2000). Nevertheless, the Phobos spectrum acquired from TES shows small features at 9.8 µm. Interestingly, a good match is visible for the band at 21.5 µm, which was identified on Mars as produced by hematite (Christensen et al. 2000). Previous analysis of TES observation of Phobos indeed linked the spectrum with a possible basaltic component (Glotch et al. 2018).
For the hypothesis of the giant impact, the formation of the Martian moons would be a direct product of the reaccumulation of debris disk material made by the red planet and the impactor material, if it survived (Craddock 2011). As the NIR and MIR spectra of Mars, as well as chassignites, are not fully comparable with observations of Phobos and Deimos, the hypothesis of a composition directly derived from Mars needs to advocate several subsequent processes to obtain the current surface appearance. Some of these processes are thermal alteration, space weathering, and even desegregation and reaccumulation, dehydration, and hydrogen implantation. If some of them are likely to occur during the collision and the reaccumulation as the thermal alteration, others can alter the surface of Phobos during the subsequent evolution, and they still alter it today (i.e., space weathering and hydrogen implantation). The quantification of the effect produced by these processes on Martian-like material is still not investigated and will be the topic of future work.
When we compare Mars and its moons, we observe a discrepancy in the low density of the Martian moons with the densities of the Martian mantle or crust. This may be explained by the hypothesis that if the moons formed by accretion, highly porous rubble-pile bodies might have formed. These rubble piles are expected to consist of a mixture of basaltic Martian material and impactor material (at least 35% of Martian material in which 50% comes from the mantle; Hyodo et al. 2017). When we consider a purely mantle material for Phobos (ρ = 3.4 ± 0.1 g cm−3, Consolmagno et al. 2008), this would results in a macro-porosity induced by voids in the interior that can be estimated to be 𝒫 = 45 ± 4% for Phobos and 𝒫 = 56 ± 4% for Deimos.
5.4 An M-type asteroid at the origin of Phobos and Deimos?
The results of the various analyses performed on asteroid data show that the Phobos BU, which is assumed to represent the unweathered fresh materials on Phobos, is relatively close to M- type spectral properties. Therefore, we explored the possibility that Phobos and Deimos originated from an M-type object via two potential mechanisms as described below.
An M-type asteroid impact on Mars: An M-type asteroid or an early protoplanet (M-type asteroids are currently described as remnant bodies of planetesimal or protoplanet formation) could have impacted Mars, thereby creating a debris disk around Mars that was mainly composed of M- type material with a fraction of Martian material. According to numerical simulations made by Rosenblatt (2011), Citron et al. (2015), Hyodo et al. (2017), and Canup & Salmon (2018), the necessary mass of the impactor (ρ ~ 3.1 g cm−3) would typically be between 1% and 5% of the Mars mass, that is, between 6.4 × 10²¹ kg and 3.2 × 10²² kg. Considering that the most massive currently known M-type asteroid is (16) Psyche, with a mass of (2.29 ± 0.14) × 1019 kg, the size of the necessary M-type bodies for this hypothesis implies a particularly huge body that would be closer to a large planetesimal than an asteroid, with a radius between 735 km and 1257 km to explain the formation of enough material for the creation of the Martian moons. The disk will be heated up to 1000 K such as in the giant impact classic scenario, depleting volatiles, and dehydrating phyllosilicates, as seen in CRISM observations (Fraeman et al. 2014). The accretion of the mixture of M-type-like asteroids and Martian material in the disk could create Phobos and Deimos. According to this, Phobos would be an iron-rich body such as an M-type asteroid with Martian material as well. M-type asteroids are generally considered as parent bodies of iron meteorites (mesosiderite) and enstatite chondrites (e.g., Lupishko & Belskaya 1989; Ockert-Bell et al. 2010). It has been shown that enstatite chondrite spectra after ion irradiation or a pulse-laser experiment to simulate space-weathering can be slightly darkened (Vernazza et al. 2009) and also strongly reddened (Vernazza et al. 2009; Zhang et al. 2022). This evolution after spaceweather alteration is particularly interesting as a hypothesis to explain the difference between the BU and the RU on Phobos. The top layer surface of the RU is highly altered due to the proximity of the Sun and Mars, and it therefore shows a dark, featureless, and red spectrum. The subsurface is not altered similarly, showing a higher albedo and a flatter spectrum. The impacts that form craters, and in particular Stickney, are therefore relatively recent, and they excavate the bright iron-rich unaltered material. Additionally, fresher areas were observed on asteroid (21) Lutetia, which was originally classified as M type, as seen by the Rosetta spacecraft. These areas were located in the vicinity of craters, and in particular, in the Baetica region (Magrin et al. 2012). These fresher areas on Lutetia are indicative of landslides and exhibit a bluer spectrum than the surrounding areas, a trend that is also observed on Phobos crater rims and landslides. Deimos exhibits a more homogeneous surface and is more consistent with the Phobos RU according to VNIR spectroscopic observations. The craters appear to have no specific significant spectrophotometric behavior in comparison with craters on Phobos (Thomas et al. 2011). The craters on Deimos are therefore older, and excavated material from an old impact is already altered by space-weather processes and is at least partially buried by regolith (Thomas et al. 1996; Thomas et al. 2011). The density is also an important parameter for constraining the origin of Phobos and Deimos. They exhibit a low density of 1.86 ± 0.1 g cm−3 (Willner et al. 2014) and 1.49 ± 0.2 g cm−3 (Thomas 1993; Jacobson 2010). The mean density of M-type asteroids was found to be 3.85 ± 1.27 g cm−3 (Carry 2012). This discrepancy in the theory of an M-type asteroid at the origin of the Martian moons could be explained by the fact that after the impact, M-type material was likely mixed with crustal and mantle Martian materials (ρ ~ 3.0 g cm−3 and ρ ~ 3.4 g cm−3; Consolmagno et al. 2008) that were stripped from the planet. However, this mechanism alone cannot explain the observed density. The formation of the moons by accretion may create rubble-pile bodies with an extremely high porosity. This rubble pile will consist of a mix of basaltic Martian material with M-type material (at least 35% of Martian material, 50% of which comes from the mantle; Hyodo et al. 2017). When we considered an equal quantity mix of both types of materials, the macroporosity induced by voids in the interior needed in this hypothesis is estimated to be 𝒫 = 49 ± 26% for Phobos and 𝒫 = 59 ± 34% for Deimos. These macroporosity values are consistent with observed rubble-pile asteroids such as (101955) Bennu (𝒫 = 50–60%, Barnouin et al. 2019), (162173) Ryugu (𝒫 = 50–60%, Okada et al. 2020), and (25143) Itokawa (𝒫 = 42 ± 11%, Fujiwara et al. 2006). The high internal porosity may also explain the many geological features (e.g., grooves; Basilevsky et al. 2014) that indicate strong tidal effects caused by the proximity of Phobos to the Roche limit.
M-type asteroid capture: In line with the observed similarities between Phobos BU and M-type asteroids and with the previously proposed hypothesis of a D-type captured asteroid (e.g., Pajola et al. 2013), it is also possible to consider an M-type captured asteroid, particularly in the case of Phobos. The difference between the Phobos BU and RU could be explained in the same way as previously. However, M types are probably not rubble-pile asteroids (Carry 2012), and this may be more difficult to reconcile with the current low density of Phobos and Deimos.
In both cases, the relatively low thermal inertia of Phobos and Deimos (between 20 and 85 J m−2 K−1 s−1/2, Michel et al. 2022) is consistent with the value for the Moon (Hayne et al. 2017) or M-type asteroids. For example, asteroid (21) Lutetia was determined to have a thermal inertia that falls within the range of values observed for the Martian moons (50 J m−2 K−1 s−1/2; Mueller et al. 2006; Gundlach & Blum 2013). Furthermore, the thermal inertia of this iron-rich material may be reduced in the case of very fine grain material. However, this hypothesis faces the problem that the M-type object altered surface materials are consistent with the Phobos BU, which are generally considered as fresher areas. Therefore, either the blue unit does not correspond to fresher areas, or an alternative space-weather mechanism is necessary to explain this discrepancy. Finally, the M-type hypothesis is challenging to reconcile with several properties of Phobos and Deimos, in particular with regard to compositional and space-weather alteration trends. Consequently, we conclude that this hypothesis is relatively unlikely to explain the origins of Phobos and Deimos. Although the Phobos BU matches the M-type asteroids spectrally, it appears to be more probable that it is associated with the P-type asteroid class. This class is spectroscopically close to the M-type objects, but it is rarer. This might result in a possible discrepancy for a statistical comparison.
6 Conclusions
We put forward new hypotheses to explain the origins of Phobos and Deimos. In the case of captured bodies, it is already well established that the Martian moons exhibited spectral similarities with the primitive D-type asteroids. Based on the spectroscopic properties, we also explored the hypothesis of a captured origin based on an M- or Z-type asteroid, or even an extinct comet. In the case of a giant impact, we expanded the discussion of the classic giant impact hypothesis to encompass the origins and the link between Mars trojans and the Martian moons. If some hypotheses are more exotic, such as the M-type or comet origins (which are particularly suitable for explaining the spectroscopic and photometric properties, but face the problem of explaining the current orbital parameters of the two Martian moons), some others seems particularly interesting because they can reconcile the spectroscopic, photometric, and dynamical properties of Phobos and Deimos. In the case of the captured bodies, a Z-type asteroid from the inner main belt might explain the origins of Phobos and Deimos. In the giant impact hypothesis, the formation of the Martian moons is linked to the origins of the Mars trojans from the Eureka family.
This study demonstrated that although significant progress was made recently in our understanding of the effects of space weathering on spectroscopic and photometric properties, a significant knowledge gap remains. Visible to MIR spectroscopy and photometry are widely used techniques for remote-sensing observations, and also for ground-based observations. The understanding of the alteration of small bodies is of particular importance for the interpretation of data from space missions, but also above all to provide a comprehensive interpretation of the early Solar System. Laboratory experiments made to simulate space weathering should continue on various extraterrestrial materials because the composition has a significant impact on the observed variations, and sample-return missions as currently obtained by Hayabusa, Hayabusa2, and OSIRIS-REx give invaluable information on these processes.
The specific environment of Phobos, with its proximity to Mars and its atmosphere, might also play an additional role in the spatial alteration and sputtering that occurs on its surface (Nénon et al. 2019, 2021).
The Martian system is particularly complex in the terrestrial planet family, with its small intriguing moons and trojans. The observations of these two targets will help to guide us into an understanding of these planetary systems, of our Solar System, and even of the dynamics and evolution of exoplanetary systems. For the Mars trojans, the capability of the James Webb Space Telescope (JWST), in particular, the sensitivity, spectral resolution, and spectral coverage (0.6 µm to 28 µm when the NIRSpec and MIRI instruments are combined) might be the missing link. A mission to the L5 and/or L4 Martian Lagrangian point will be of particular importance to complete the understanding of the Martian system (Wickhusen et al. 2019, 2023). For the Martian moons, the JAXA MMX mission will give us pivotal insights to finally understand the origins, with the Phobos sample return scheduled for 2031 (Kuramoto et al. 2022).
Data availability
Most of the data are available on the different asteroids survey repository, accessible through the Python tool classy. CRISM spectra are available at https://crismtypespectra.rsl.wustl.edu. Medium infrared spectra are retrieved by the cited publication and/or received directly from the author of the publication. AKARI database is accessible at https://data.darts.isas.jaxa.jp/pub/akari/AKARI-IRC_Spectrum_Pointed_AcuA_1.0/AcuA_1.0/
Acknowledgements
The authors acknowledge the continuous support of the Centre National d’Etudes Spatiales (CNES). We sincerely thank the anonymous referee for constructive comments and insightful suggestions, which have significantly improved this paper. Part of the data utilized in this publication was obtained and made available by the MITHNEOS MIT-Hawaii Near-Earth Object Spectroscopic Survey. The IRTF is operated by the University of Hawaii under contract 80HQTR19D0030 with the National Aeronautics and Space Administration. The MIT component of this work is supported by NASA grant 80NSSC18K0849. Any opinions, findings, and conclusions or recommendations expressed in this material are those of the authors and do not necessarily reflect the views of NASA or the National Science Foundation. This work has also made use of data from the European Space Agency (ESA) mission Gaia (https://www.cosmos.esa.int/gaia), processed by the Gaia Data Processing and Analysis Consortium (DPAC, https://www.cosmos.esa.int/web/gaia/dpac/consortium). Funding for the DPAC has been provided by national institutions, in particular, the institutions participating in the Gaia Multilateral Agreement. This work is based in part on observations made with the Spitzer Space Telescope, which was operated by the Jet Propulsion Laboratory, California Institute of Technology under a contract with NASA. This research is based on observations with AKARI, a JAXA project with the participation of ESA. We would like also to warmly thank all the observers who contributed to collecting the data used in this work. This research utilizes spectra of martian meteorites acquired with the NASA RELAB facility at Brown University.
Appendix A List of asteroid observations
Observations used in this work come from several surveys and/or papers. The table in this appendix gives the observed object, the wavelength range, the associated reference, and the spectral types following the Mahlke et al. (2022) and DeMeo et al. (2009) taxonomies.
VNIR ground-based spectra used in this study.
Appendix B List of asteroids properties
We present here the physical and dynamical properties/classes of each asteroids used in this work.
Physical, photometric, and spectroscopic properties of asteroids used in this work.
Appendix C Comparison between single-scattering albedo spectrum, radiance factor, and reflectance spectra of Deimos
In this work, the single-scattering albedo spectra (SSA) of Phobos and Deimos were chosen for the analysis (Fraeman et al. 2014). This choice was made to avoid any contribution of the observation geometry. In order to assess the reliability of the comparison between SSA and radiance factor, the spectral variations between these spectra were investigated using the raw radiance factor spectrum of Deimos taken at a phase angle of 22° (Fraeman et al. 2012), and the Deimos spectrum corrected for the geometry to a phase angle of 30° using the Hapke model (Fraeman et al. 2012). The differences in spectral slope between the various spectra were found to be minor (Fig. C.1 (top) and Table C.1), and less important than the uncertainties on reflectance spectra of asteroids themselves (Fig. D.5). In order to provide a thorough characterisation of the discrepancy between the SSA and reflectance spectra of Phobos and Deimos, we further investigated the variations between these two types of spectra obtained by various observers (Murchie 1999; Rivkin et al. 2002; Takir et al. 2022). The result presented in Fig. C.1 (bottom) indicates that all spectra are comparable and consistent with each other within the associated uncertainties.
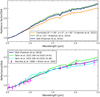 |
Fig. C.1 (Top) Comparison between the single-scattering albedo (SSA) spectrum of Deimos (Fraeman et al. 2014) and the radiance factor spectra (corrected and uncorrected) of Deimos (Fraeman et al. 2012). The corrected radiance factor spectrum was corrected using the Hapke model (Fraeman et al. 2012). (Bottom) Comparison between the SSA spectrum of Deimos (Fraeman et al. 2014) and the obtained by Murchie (1999); Rivkin et al. (2002); Takir et al. (2022). As the spectra of Takir et al. (2022) do not cover the 0.5 - 0.65 µm, we have chosen to normalize at 0.7 µm for this figure. |
Spectral slope in the VIS (0.7–0.9 µm) and NIR (1.5–2.2 µm) wavelength range for radiance factor and SSA spectra of Deimos (Fraeman et al. 2012, 2014).
Appendix D Additional figures for spectroscopic comparison
We compared also the MEX/PFS spectra of Phobos and Deimos with best matches in the VNIR among the different asteroid taxonomies (Fig. D.1). This comparison is also important because MIR region of Phobos and Deimos are significantly different between PFS and TES observations (Giuranna et al. 2011; Glotch et al. 2018).
The recent JWST observations of Jupiter Trojans by Wong et al. (2024) provide also a unique opportunity to compare the spectra with those of Phobos and Deimos (Fig. D.2). In particular, the observations cover the 3 µm region. The Jupiter Trojans exhibit a spectral slope similar to the Martian moons for (11351) Leucus, (21900) Orus, (617) Patroclus, and (3548) Eurybates. Eurybates, Patroclus, and Polymele display a broad 3 µm absorption band that is not visible in the spectra of Phobos and Deimos. The spectra of Leucus and Orus bear closer resemblance to those of the Martian moons than those of the other Trojan bodies. However, the latter are observed to be redder in this wavelength range which may be the result of an insufficient thermal correction of the CRISM spectra (Fraeman et al. 2014).
Additionally, observations in the 3 µm region were obtained from the AKARI database. Fig. D.3 show a magnification of the 2.55 - 3 µm wavelength range of the Fig. 4.
We also present the result of the best match χ2 analysis and the comparison with the four best asteroids matching the Phobos RU (Fig. D.4), as well as a comparison between the Phobos BU and (21) Lutetia (Fig. D.5).
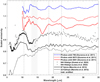 |
Fig. D.1 Mid-infrared spectra of best-matched asteroids compared to Phobos blue unit and Phobos red unit spectra observed by PFS (Giuranna et al. 2011). |
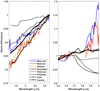 |
Fig. D.2 Near-infrared spectra of Jupiter Trojan asteroid (Wong et al. 2024) in range 1.65–3 µm compared to Phobos red and blue unit and Deimos spectra (Fraeman et al. 2014). |
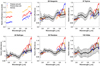 |
Fig. D.3 2.6–3 µm region of Phobos and Deimos compared with AKARI spectra of some of the best asteroid matches. Spectra are normalized at 2.6 µm. In the first panel spectra of Red Unit and Deimos are shifted by +0.1 and +0.2 respectively. |
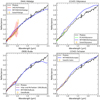 |
Fig. D.4 Spectra of the four best matches of the Phobos red unit among D- and Z- type asteroids. |
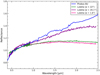 |
Fig. D.5 Comparison between the spectrum of the Phobos BU and that of the asteroid (21) Lutetia at different phase angles. The difference in the spectral slope is likely due to the rotational variability of the asteroid. |
Appendix E Asteroids taxonomy distribution
Based on the spectroscopic comparison with the Martian moons and several asteroids taxonomies, we also examined the potential link with dynamical classes (Fig. E.1). Looking at panel (a), we see the general picture that the analog asteroids of Phobos and Deimos have higher populations in the outer regions. However, when we compare the abundance among the candidates as shown in (b), we see that Z-types and M-types have higher populations than D-types in the inner regions, whereas D-types are predominant in the outer regions.
Thus, the Z-type or M-type progenitor hypotheses newly proposed in this paper suggests that inner and middle main belts are also plausible source regions of Phobos and Deimos. The presence of asteroids with spectral properties similar to Phobos and Deimos, orbiting closer to the Martian system than previously thought, may support the dynamical capture hypothesis.
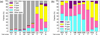 |
Fig. E.1 Distribution of asteroids across different spectral types. Panel (a) shows the fractions for all spectral types, while panel (b) focuses on those analogous to Phobos and Deimos (i.e., D, M, P, and Z types). Data are from Table 1 in Mahlke et al. (2022). Orbital class acronyms: NEA – near-Earth asteroids; MC – Mars-crosser; H – Hungaria; IMB – inner main belt; MMB – middle main belt; OMB – outer main belt; Cyb – Cybele; JT – Jovian trojans. |
References
- Alí-Lagoa, V., & Delbo’, M. 2017, A&A, 603, A55 [NASA ADS] [CrossRef] [EDP Sciences] [Google Scholar]
- Alí-Lagoa, V., Müller, T. G., Usui, F., & Hasegawa, S. 2018, A&A, 612, A85 [NASA ADS] [CrossRef] [EDP Sciences] [Google Scholar]
- Alvarez-Candal, A., Ayala-Loera, C., Gil-Hutton, R., et al. 2019, MNRAS, 488, 3035 [NASA ADS] [CrossRef] [Google Scholar]
- Alvarez-Candal, A., Jimenez Corral, S., & Colazo, M. 2022, A&A, 667, A81 [NASA ADS] [CrossRef] [EDP Sciences] [Google Scholar]
- Bagheri, A., Khan, A., Efroimsky, M., Kruglyakov, M., & Giardini, D. 2021, Nat. Astron., 5, 539 [NASA ADS] [CrossRef] [Google Scholar]
- Bandfield, J. L., Hamilton, V. E., & Christensen, P. R. 2000, Science, 287, 1626 [CrossRef] [Google Scholar]
- Barnouin, O. S., Daly, M. G., Palmer, E. E., et al. 2019, Nat. Geosci., 12, 247 [Google Scholar]
- Bartczak, P., & Dudzinski, G. 2018, MNRAS, 473, 5050 [NASA ADS] [CrossRef] [Google Scholar]
- Barucci, M. A., Reess, J.-M., Bernardi, P., et al. 2021, Earth Planets Space, 73, 211 [NASA ADS] [CrossRef] [Google Scholar]
- Basilevsky, A. T., Lorenz, C. A., Shingareva, T. V., et al. 2014, Planet. Space Sci., 102, 95 [CrossRef] [Google Scholar]
- Beck, P., Barrat, J. A., Gillet, P., et al. 2006, Geochim. Cosmochim. Acta, 70, 2127 [NASA ADS] [CrossRef] [Google Scholar]
- Bendjoya, P., Cellino, A., Di Martino, M., & Saba, L. 2004, Icarus, 168, 374 [CrossRef] [Google Scholar]
- Berthier, J., Vachier, F., Marchis, F., Durech, J., & Carry, B. 2014, Icarus, 239, 118 [CrossRef] [Google Scholar]
- Berthier, J., Carry, B., Mahlke, M., & Normand, J. 2023, A&A, 671, A151 [NASA ADS] [CrossRef] [EDP Sciences] [Google Scholar]
- Binzel, R. P., Birlan, M., Bus, S. J., et al. 2004, Planet. Space Sci., 52, 291 [NASA ADS] [CrossRef] [Google Scholar]
- Binzel, R. P., DeMeo, F. E., Turtelboom, E. V., et al. 2019, Icarus, 324, 41 [Google Scholar]
- Borisov, G., Christou, A., Bagnulo, S., et al. 2017, MNRAS, 466, 489 [NASA ADS] [CrossRef] [Google Scholar]
- Borisov, G., Christou, A. A., Colas, F., et al. 2018, A&A, 618, A178 [NASA ADS] [CrossRef] [EDP Sciences] [Google Scholar]
- Bourdelle de Micas, J., Fornasier, S., Avdellidou, C., et al. 2022, A&A, 665, A83 [NASA ADS] [CrossRef] [EDP Sciences] [Google Scholar]
- Brunetto, R., Lantz, C., Ledu, D., et al. 2014, Icarus, 237, 278 [NASA ADS] [CrossRef] [Google Scholar]
- Burns, J. A. 1992, in Mars, ed. M. George, 1283 [Google Scholar]
- Canup, R., & Salmon, J. 2018, Sci. Adv., 4, eaar6887 [NASA ADS] [CrossRef] [Google Scholar]
- Carry, B. 2012, Planet. Space Sci., 73, 98 [CrossRef] [Google Scholar]
- Chrbolková, K., Brunetto, R., Durech, J., et al. 2021, A&A, 654, A143 [NASA ADS] [CrossRef] [EDP Sciences] [Google Scholar]
- Christensen, P. R., Bandfield, J. L., Clark, R. N., et al. 2000, J. Geophys. Res., 105, 9623 [NASA ADS] [CrossRef] [Google Scholar]
- Christou, A. A. 2013, Icarus, 224, 144 [NASA ADS] [CrossRef] [Google Scholar]
- Christou, A. A., Borisov, G., Dell’Oro, A., Cellino, A., & Devogèle, M. 2021, Icarus, 354, 113994 [NASA ADS] [CrossRef] [Google Scholar]
- Citron, R. I., Genda, H., & Ida, S. 2015, Icarus, 252, 334 [NASA ADS] [CrossRef] [Google Scholar]
- Clark, R. N., King, T. V. V., Klejwa, M., Swayze, G. A., & Vergo, N. 1990, J. Geophys. Res., 95, 12653 [NASA ADS] [CrossRef] [Google Scholar]
- Consolmagno, G., Britt, D., & Macke, R. 2008, Chem. Erde/ Geochemistry, 68, 1 [CrossRef] [Google Scholar]
- Craddock, R. A. 1994, in Lunar and Planetary Science Conference, 293 [Google Scholar]
- Craddock, R. A. 2011, Icarus, 211, 1150 [NASA ADS] [CrossRef] [Google Scholar]
- Cuk, M., Christou, A. A., & Hamilton, D. P. 2015, Icarus, 252, 339 [CrossRef] [Google Scholar]
- Cuk, M., Minton, D. A., Pouplin, J. L. L., & Wishard, C. 2020, ApJ, 896, L28 [CrossRef] [Google Scholar]
- de La Fuente Marcos, C., & de La Fuente Marcos, R. 2013, MNRAS, 432, L31 [NASA ADS] [CrossRef] [Google Scholar]
- de la Fuente Marcos, R., de León, J., de la Fuente Marcos, C., et al. 2024, A&A, 683, L14 [NASA ADS] [CrossRef] [EDP Sciences] [Google Scholar]
- Delbó, M., Harris, A. W., Binzel, R. P., Pravec, P., & Davies, J. K. 2003, Icarus, 166, 116 [CrossRef] [Google Scholar]
- de León, J., Mothé-Diniz, T., Licandro, J., Pinilla-Alonso, N., & Campins, H. 2011, A&A, 530, L12 [NASA ADS] [CrossRef] [EDP Sciences] [Google Scholar]
- DeMeo, F. E., Binzel, R. P., Slivan, S. M., & Bus, S. J. 2009, Icarus, 202, 160 [Google Scholar]
- DeMeo, F. E., Polishook, D., Carry, B., et al. 2019, Icarus, 322, 13 [CrossRef] [Google Scholar]
- de Sanctis, M. C., Raponi, A., Ammannito, E., et al. 2016, Nature, 536, 54 [NASA ADS] [CrossRef] [Google Scholar]
- Donaldson Hanna, K. L., Thomas, I. R., Bowles, N. E., et al. 2012a, J. Geophys. Res. (Planets), 117, E11004 [Google Scholar]
- Donaldson Hanna, K. L., Wyatt, M. B., Thomas, I. R., et al. 2012b, J. Geophys. Res. (Planets), 117, E00H05 [Google Scholar]
- Durech, J., Kaasalainen, M., Herald, D., et al. 2011, Icarus, 214, 652 [NASA ADS] [CrossRef] [Google Scholar]
- Emery, J. P., & Brown, R. H. 2003, Icarus, 164, 104 [NASA ADS] [CrossRef] [Google Scholar]
- Fanale, F. P., & Salvail, J. R. 1989, Geophys. Res. Lett., 16, 287 [CrossRef] [Google Scholar]
- Fanale, F. P., & Salvail, J. R. 1990, Icarus, 88, 380 [CrossRef] [Google Scholar]
- Fornasier, S., Dotto, E., Marzari, F., et al. 2004, Icarus, 172, 221 [NASA ADS] [CrossRef] [Google Scholar]
- Fornasier, S., Dotto, E., Hainaut, O., et al. 2007, Icarus, 190, 622 [NASA ADS] [CrossRef] [Google Scholar]
- Fornasier, S., Migliorini, A., Dotto, E., & Barucci, M. A. 2008, Icarus, 196, 119 [NASA ADS] [CrossRef] [Google Scholar]
- Fornasier, S., Clark, B. E., Dotto, E., et al. 2010, Icarus, 210, 655 [NASA ADS] [CrossRef] [Google Scholar]
- Fornasier, S., Hasselmann, P. H., Barucci, M. A., et al. 2015, A&A, 583, A30 [NASA ADS] [CrossRef] [EDP Sciences] [Google Scholar]
- Fornasier, S., Lantz, C., Perna, D., et al. 2016a, Icarus, 269, 1 [CrossRef] [Google Scholar]
- Fornasier, S., Mottola, S., Keller, H. U., et al. 2016b, Science, 354, 1566 [NASA ADS] [CrossRef] [Google Scholar]
- Fornasier, S., Hasselmann, P. H., Deshapriya, J. D. P., et al. 2020, A&A, 644, A142 [NASA ADS] [CrossRef] [EDP Sciences] [Google Scholar]
- Fornasier, S., Hoang, H. V., Fulle, M., Quirico, E., & Ciarniello, M. 2023, A&A, 672, A136 [NASA ADS] [CrossRef] [EDP Sciences] [Google Scholar]
- Fornasier, S., Wargnier, A., Hasselmann, P. H., et al. 2024, A&A, 686, A203 [NASA ADS] [CrossRef] [EDP Sciences] [Google Scholar]
- Fraeman, A. A., Arvidson, R. E., Murchie, S. L., et al. 2012, J. Geophys. Res. (Planets), 117, E00J15 [CrossRef] [Google Scholar]
- Fraeman, A. A., Murchie, S. L., Arvidson, R. E., et al. 2014, Icarus, 229, 196 [NASA ADS] [CrossRef] [Google Scholar]
- Fu, X., Zou, Y., Zheng, Y., & Ouyang, Z. 2012, Icarus, 219, 630 [NASA ADS] [CrossRef] [Google Scholar]
- Fujiwara, A., Kawaguchi, J., Yeomans, D. K., et al. 2006, Science, 312, 1330 [NASA ADS] [CrossRef] [Google Scholar]
- Gaia Collaboration (Prusti, T., et al.) 2016, A&A, 595, A1 [NASA ADS] [CrossRef] [EDP Sciences] [Google Scholar]
- Gaia Collaboration (Galluccio, L., et al.) 2023a, A&A, 674, A35 [NASA ADS] [CrossRef] [EDP Sciences] [Google Scholar]
- Gaia Collaboration (Vallenari, A., et al.) 2023b, A&A, 674, A1 [NASA ADS] [CrossRef] [EDP Sciences] [Google Scholar]
- Galinier, M., Delbo, M., Avdellidou, C., & Galluccio, L. 2024, A&A, 683, L3 [NASA ADS] [CrossRef] [EDP Sciences] [Google Scholar]
- Gartrelle, G. M., Hardersen, P. S., Izawa, M. R. M., & Nowinski, M. C. 2021, Icarus, 363, 114295 [NASA ADS] [CrossRef] [Google Scholar]
- Giuranna, M., Roush, T. L., Duxbury, T., et al. 2011, Planet. Space Sci., 59, 1308 [NASA ADS] [CrossRef] [Google Scholar]
- Glotch, T. D., Edwards, C. S., Yesiltas, M., et al. 2018, J. Geophys. Res. (Planets), 123, 2467 [NASA ADS] [CrossRef] [Google Scholar]
- Grav, T., Mainzer, A. K., Bauer, J. M., Masiero, J. R., & Nugent, C. R. 2012, ApJ, 759, 49 [NASA ADS] [CrossRef] [Google Scholar]
- Gundlach, B., & Blum, J. 2013, Icarus, 223, 479 [Google Scholar]
- Hahn, G., & Rickman, H. 1985, Icarus, 61, 417 [NASA ADS] [CrossRef] [Google Scholar]
- Hamilton, V. E., Simon, A. A., Christensen, P. R., et al. 2019, Nat. Astron., 3, 332 [Google Scholar]
- Hanuš, J., Marchis, F., & Durech, J. 2013, Icarus, 226, 1045 [CrossRef] [Google Scholar]
- Hanuš, J., Viikinkoski, M., Marchis, F., et al. 2017, A&A, 601, A114 [Google Scholar]
- Hanuš, J., Delbo’, M., Durech, J., & Alí-Lagoa, V. 2018, Icarus, 309, 297 [CrossRef] [Google Scholar]
- Hartmann, W. K. 1980, Icarus, 44, 441 [NASA ADS] [CrossRef] [Google Scholar]
- Hartmann, W. K. 1990, Icarus, 87, 236 [NASA ADS] [CrossRef] [Google Scholar]
- Hartmann, W. K., Tholen, D. J., & Cruikshank, D. P. 1987, Icarus, 69, 33 [NASA ADS] [CrossRef] [Google Scholar]
- Hayne, P. O., Bandfield, J. L., Siegler, M. A., et al. 2017, J. Geophys. Res. (Planets), 122, 2371 [NASA ADS] [CrossRef] [Google Scholar]
- Herald, D., Frappa, E., Gault, D., et al. 2019, Small Bodies Occultations Bundle V3.0, NASA Planetary Data System, urn:nasa:pds:smallbodiesoccultations::3.0 [Google Scholar]
- Hesselbrock, A. J., & Minton, D. A. 2017, Nat. Geosci., 10, 266 [Google Scholar]
- Higuchi, A., & Ida, S. 2017, AJ, 153, 155 [NASA ADS] [CrossRef] [Google Scholar]
- Hiroi, T., Sasaki, S., Misu, T., & Nakamura, T. 2013, in 44th Annual Lunar and Planetary Science Conference, 1276 [Google Scholar]
- Humes, O. A., Martin, A. C., Thomas, C. A., & Emery, J. P. 2024a, Planet. Sci. J., 5, 108 [NASA ADS] [CrossRef] [Google Scholar]
- Humes, O. A., Thomas, C. A., & McGraw, L. E. 2024b, Planet. Sci. J., 5, 80 [NASA ADS] [CrossRef] [Google Scholar]
- Hung, D., Hanuš, J., Masiero, J. R., & Tholen, D. J. 2022, Planet. Sci. J., 3, 56 [CrossRef] [Google Scholar]
- Hunten, D. M. 1979, Icarus, 37, 113 [NASA ADS] [CrossRef] [Google Scholar]
- Hyodo, R., Genda, H., Charnoz, S., & Rosenblatt, P. 2017, ApJ, 845, 125 [NASA ADS] [CrossRef] [Google Scholar]
- Hyodo, R., Genda, H., Sekiguchi, R., Madeira, G., & Charnoz, S. 2022, Planet. Sci. J., 3, 204 [NASA ADS] [CrossRef] [Google Scholar]
- Jacobson, R. A. 2010, AJ, 139, 668 [Google Scholar]
- Kegerreis, J. A., Lissauer, J. J., Eke, V. R., Sandnes, T. D., & Elphic, R. C. 2025, Icarus, 425, 116337 [NASA ADS] [CrossRef] [Google Scholar]
- Keller, L. P., Christoffersen, R., Dukes, C. A., Baragiola, R., & Rahman, Z. 2015, in 46th Annual Lunar and Planetary Science Conference, 1913 [Google Scholar]
- Kitazato, K., Milliken, R. E., Iwata, T., et al. 2019, Science, 364, 272 [Google Scholar]
- Kuramoto, K. 2024, Annu. Rev. Earth Planet. Sci., 52, 495 [CrossRef] [Google Scholar]
- Kuramoto, K., Kawakatsu, Y., Fujimoto, M., et al. 2022, Earth Planets Space, 74, 12 [NASA ADS] [CrossRef] [Google Scholar]
- Lawrence, D. J., Peplowski, P. N., Beck, A. W., et al. 2019, Earth Space Sci., 6, e2019EA000811 [Google Scholar]
- Lazzarin, M., Barucci, M. A., & Doressoundiram, A. 1996, Icarus, 122, 122 [NASA ADS] [CrossRef] [Google Scholar]
- Levison, H. F., Shoemaker, E. M., & Shoemaker, C. S. 1997, Nature, 385, 42 [NASA ADS] [CrossRef] [Google Scholar]
- Li, J.-Y., Reddy, V., Nathues, A., et al. 2016, ApJ, 817, L22 [Google Scholar]
- Licandro, J., Popescu, M., de León, J., et al. 2018, A&A, 618, A170 [NASA ADS] [CrossRef] [EDP Sciences] [Google Scholar]
- Lim, L. F., Emery, J. P., Mueller, M., et al. 2011, in EPSC-DPS Joint Meeting 2011, 1199 [Google Scholar]
- Loeffler, M. J., Dukes, C. A., & Baragiola, R. A. 2009, J. Geophys. Res. (Planets), 114, E03003 [CrossRef] [Google Scholar]
- Lowry, V. C., Donaldson Hanna, K. L., Ito, G., et al. 2022, Planet. Sci. J., 3, 181 [NASA ADS] [CrossRef] [Google Scholar]
- Lupishko, D. F., & Belskaya, I. N. 1989, Icarus, 78, 395 [NASA ADS] [CrossRef] [Google Scholar]
- Luu, J. X. 1993, Icarus, 104, 138 [NASA ADS] [CrossRef] [Google Scholar]
- Madeira, G., Charnoz, S., Zhang, Y., et al. 2023, AJ, 165, 161 [NASA ADS] [CrossRef] [Google Scholar]
- Magrin, S., La Forgia, F., Pajola, M., et al. 2012, Planet. Space Sci., 66, 43 [NASA ADS] [CrossRef] [Google Scholar]
- Mahlke, M., Carry, B., & Mattei, P. A. 2022, A&A, 665, A26 [NASA ADS] [CrossRef] [EDP Sciences] [Google Scholar]
- Mainzer, A., Grav, T., Bauer, J., et al. 2011, ApJ, 743, 156 [NASA ADS] [CrossRef] [Google Scholar]
- Mainzer, A., Grav, T., Masiero, J., et al. 2012, ApJ, 760, L12 [NASA ADS] [CrossRef] [Google Scholar]
- Manceau, A., Drits, V. A., Lanson, B., et al. 2000, Am. Mineralogist, 85, 153 [NASA ADS] [CrossRef] [Google Scholar]
- Mandon, L., Beck, P., Quantin-Nataf, C., et al. 2021, Icarus, 366, 114517 [NASA ADS] [CrossRef] [Google Scholar]
- Marchis, F., Kaasalainen, M., Hom, E. F. Y., et al. 2006, Icarus, 185, 39 [NASA ADS] [CrossRef] [Google Scholar]
- Marchis, F., Enriquez, J. E., Emery, J. P., et al. 2012, Icarus, 221, 1130 [NASA ADS] [CrossRef] [Google Scholar]
- Marciniak, A., Durech, J., Choukroun, A., et al. 2023, A&A, 679, A60 [NASA ADS] [CrossRef] [EDP Sciences] [Google Scholar]
- Marsset, M., DeMeo, F. E., Burt, B., et al. 2022, AJ, 163, 165 [NASA ADS] [CrossRef] [Google Scholar]
- Marsset, M., Brož, M., Vermersch, J., et al. 2023, A&A, 670, A52 [NASA ADS] [CrossRef] [EDP Sciences] [Google Scholar]
- Masiero, J. R., Mainzer, A. K., Grav, T., et al. 2012, ApJ, 759, L8 [NASA ADS] [CrossRef] [Google Scholar]
- Masiero, J. R., Grav, T., Mainzer, A. K., et al. 2014, ApJ, 791, 121 [Google Scholar]
- Masiero, J. R., Wright, E. L., & Mainzer, A. K. 2019, AJ, 158, 97 [NASA ADS] [CrossRef] [Google Scholar]
- Masiero, J. R., Mainzer, A. K., Bauer, J. M., et al. 2020, Planet. Sci. J., 1, 5 [NASA ADS] [CrossRef] [Google Scholar]
- Masiero, J. R., Mainzer, A. K., Bauer, J. M., et al. 2021, Planet. Sci. J., 2, 162 [CrossRef] [Google Scholar]
- Michel, P., Ulamec, S., Böttger, U., et al. 2022, Earth Planets Space, 74, 2 [NASA ADS] [CrossRef] [Google Scholar]
- Moroz, L. V., Hiroi, T., Shingareva, T. V., et al. 2004, in Lunar and Planetary Science Conference, eds. S. Mackwell, & E. Stansbery, 1279 [Google Scholar]
- Mueller, M., Harris, A. W., Bus, S. J., et al. 2006, A&A, 447, 1153 [NASA ADS] [CrossRef] [EDP Sciences] [Google Scholar]
- Murchie, S. 1999, J. Geophys. Res., 104, 9069 [NASA ADS] [CrossRef] [Google Scholar]
- Murchie, S., & Erard, S. 1996, Icarus, 123, 63 [CrossRef] [Google Scholar]
- Murchie, S. L., Britt, D. T., Head, J. W., et al. 1991, J. Geophys. Res., 96, 5925 [NASA ADS] [CrossRef] [Google Scholar]
- Nénon, Q., Poppe, A. R., Rahmati, A., et al. 2019, J. Geophys. Res. (Planets), 124, 3385 [CrossRef] [Google Scholar]
- Nénon, Q., Poppe, A. R., Rahmati, A., & McFadden, J. P. 2021, Nat. Geosci., 14, 61 [CrossRef] [Google Scholar]
- Nugent, C. R., Mainzer, A., Masiero, J., et al. 2015, ApJ, 814, 117 [NASA ADS] [CrossRef] [Google Scholar]
- Nugent, C. R., Mainzer, A., Bauer, J., et al. 2016, AJ, 152, 63 [Google Scholar]
- Ockert-Bell, M. E., Clark, B. E., Shepard, M. K., et al. 2010, Icarus, 210, 674 [CrossRef] [Google Scholar]
- Okada, T., Fukuhara, T., Tanaka, S., et al. 2020, Nature, 579, 518 [NASA ADS] [CrossRef] [Google Scholar]
- Pajola, M., Lazzarin, M., Bertini, I., et al. 2012, MNRAS, 427, 3230 [NASA ADS] [CrossRef] [Google Scholar]
- Pajola, M., Lazzarin, M., Dalle Ore, C. M., et al. 2013, ApJ, 777, 127 [NASA ADS] [CrossRef] [Google Scholar]
- Pajola, M., Roush, T., Dalle Ore, C., Marzo, G. A., & Simioni, E. 2018, Planet. Space Sci., 154, 63 [NASA ADS] [CrossRef] [Google Scholar]
- Pedregosa, F., Varoquaux, G., Gramfort, A., et al. 2011, J. Mach. Learn. Res., 12, 2825 [Google Scholar]
- Pieters, C. M., Klima, R. L., Hiroi, T., et al. 2008, J. Geophys. Res. (Planets), 113, E06004 [CrossRef] [Google Scholar]
- Poggiali, G., Matsuoka, M., Barucci, M. A., et al. 2022, MNRAS, 516, 465 [NASA ADS] [CrossRef] [Google Scholar]
- Poggiali, G., Fossi, L., Wargnier, A., et al. 2024, A&A, 685, A14 [NASA ADS] [CrossRef] [EDP Sciences] [Google Scholar]
- Polishook, D., Jacobson, S. A., Morbidelli, A., & Aharonson, O. 2017, Nat. Astron., 1, 0179 [NASA ADS] [CrossRef] [Google Scholar]
- Pollack, J. B., Burns, J. A., & Tauber, M. E. 1979, Icarus, 37, 587 [NASA ADS] [CrossRef] [Google Scholar]
- Raponi, A., Ciarniello, M., Capaccioni, F., et al. 2016, MNRAS, 462, S476 [Google Scholar]
- Rivkin, A. S., Brown, R. H., Trilling, D. E., Bell, J. F., & Plassmann, J. H. 2002, Icarus, 156, 64 [NASA ADS] [CrossRef] [Google Scholar]
- Rivkin, A. S., Binzel, R. P., Howell, E. S., Bus, S. J., & Grier, J. A. 2003, Icarus, 165, 349 [NASA ADS] [CrossRef] [Google Scholar]
- Rivkin, A. S., Trilling, D. E., Thomas, C. A., et al. 2007, Icarus, 192, 434 [NASA ADS] [CrossRef] [Google Scholar]
- Roig, F., Ribeiro, A. O., & Gil-Hutton, R. 2008, A&A, 483, 911 [NASA ADS] [CrossRef] [EDP Sciences] [Google Scholar]
- Rosenblatt, P. 2011, A&A Rev., 19, 44 [NASA ADS] [CrossRef] [Google Scholar]
- Rosenblatt, P., Charnoz, S., Dunseath, K. M., et al. 2016, Nat. Geosci., 9, 581 [NASA ADS] [CrossRef] [Google Scholar]
- Rozek, A., Lowry, S. C., Nolan, M. C., et al. 2019, A&A, 631, A149 [NASA ADS] [CrossRef] [EDP Sciences] [Google Scholar]
- Russell, C. T., Raymond, C. A., Ammannito, E., et al. 2016, Science, 353, 1008 [NASA ADS] [CrossRef] [Google Scholar]
- Ryan, E. L., & Woodward, C. E. 2010, AJ, 140, 933 [NASA ADS] [CrossRef] [Google Scholar]
- Salvatore, M. R., Goudge, T. A., Bramble, M. S., et al. 2018, Icarus, 301, 76 [NASA ADS] [CrossRef] [Google Scholar]
- Sasaki, S. 1990, in Lunar and Planetary Science Conference, 21, 1069 [NASA ADS] [Google Scholar]
- Scholl, H., Marzari, F., & Tricarico, P. 2005, Icarus, 175, 397 [NASA ADS] [CrossRef] [Google Scholar]
- Schröder, S. E., Poch, O., Ferrari, M., et al. 2021, Nat. Commun., 12, 274 [CrossRef] [Google Scholar]
- Schwarz, R., & Dvorak, R. 2012, Celest. Mech. Dyn. Astron., 113, 23 [NASA ADS] [CrossRef] [Google Scholar]
- Shepard, M. K., Harris, A. W., Taylor, P. A., et al. 2011, Icarus, 215, 547 [NASA ADS] [CrossRef] [Google Scholar]
- Shepard, M. K., de Kleer, K., Cambioni, S., et al. 2021, Planet. Sci. J., 2, 125 [NASA ADS] [CrossRef] [Google Scholar]
- Shevchenko, V. G., Belskaya, I. N., Muinonen, K., et al. 2016, Planet. Space Sci., 123, 101 [Google Scholar]
- Shirley, K. A., & Glotch, T. D. 2019, J. Geophys. Res. (Planets), 124, 970 [NASA ADS] [CrossRef] [Google Scholar]
- Sierks, H., Lamy, P., Barbieri, C., et al. 2011, Science, 334, 487 [NASA ADS] [CrossRef] [Google Scholar]
- Takir, D., & Emery, J. P. 2012, Icarus, 219, 641 [NASA ADS] [CrossRef] [Google Scholar]
- Takir, D., Matsuoka, M., Waiters, A., Kaluna, H., & Usui, T. 2022, Icarus, 371, 114691 [NASA ADS] [CrossRef] [Google Scholar]
- Tatsumi, E., Sakatani, N., Riu, L., et al. 2021, Nat. Commun., 12, 5837 [NASA ADS] [CrossRef] [Google Scholar]
- Thomas, P. C. 1993, Icarus, 105, 326 [NASA ADS] [CrossRef] [Google Scholar]
- Thomas, P. C., Adinolfi, D., Helfenstein, P., Simonelli, D., & Veverka, J. 1996, Icarus, 123, 536 [CrossRef] [Google Scholar]
- Thomas, N., Stelter, R., Ivanov, A., et al. 2011, Planet. Space Sci., 59, 1281 [NASA ADS] [CrossRef] [Google Scholar]
- Trilling, D. E., Rivkin, A. S., Stansberry, J. A., et al. 2007, Icarus, 192, 442 [NASA ADS] [CrossRef] [Google Scholar]
- Usui, F., Kuroda, D., Müller, T. G., et al. 2011, PASJ, 63, 1117 [Google Scholar]
- Usui, F., Hasegawa, S., Ootsubo, T., & Onaka, T. 2019, VizieR Online Data Catalog: AKARI Near Infrared Asteroid Spectral Catalog V1 (Usui+, 2019), VizieR On-line Data Catalog: J/PASJ/71/1. [Google Scholar]
- Vernazza, P., Brunetto, R., Binzel, R. P., et al. 2009, Icarus, 202, 477 [NASA ADS] [CrossRef] [Google Scholar]
- Vernazza, P., Ferrais, M., Jorda, L., et al. 2021, A&A, 654, A56 [NASA ADS] [CrossRef] [EDP Sciences] [Google Scholar]
- Viikinkoski, M., Hanuš, J., Kaasalainen, M., Marchis, F., & Durech, J. 2017, A&A, 607, A117 [NASA ADS] [CrossRef] [EDP Sciences] [Google Scholar]
- Viviano-Beck, C. E. 2014, Mro Mars Crism 4 Type Spectra Library V1.0, NASA Planetary Data System, MRO-M-CRISM-4-TYPESPEC-V1.0 [Google Scholar]
- Wargnier, A., Gautier, T., Poch, O., et al. 2023a, A&A, 669, A146 [NASA ADS] [CrossRef] [EDP Sciences] [Google Scholar]
- Wargnier, A., Poggiali, G., Doressoundiram, A., et al. 2023b, MNRAS, 524, 3809 [NASA ADS] [CrossRef] [Google Scholar]
- Watanabe, S., Hirabayashi, M., Hirata, N., et al. 2019, Science, 364, 268 [NASA ADS] [Google Scholar]
- Wickhusen, K., Oberst, J., & Willner, K. 2019, in EGU General Assembly Conference Abstracts, 13883 [Google Scholar]
- Wickhusen, K., Oberst, J., Christou, A., & Damme, F. 2023, Planet. Space Sci., 228, 105649 [NASA ADS] [CrossRef] [Google Scholar]
- Wilawer, E., Muinonen, K., Oszkiewicz, D., Kryszczynska, A., & Colazo, M. 2024, MNRAS, 531, 2802 [NASA ADS] [CrossRef] [Google Scholar]
- Willner, K., Shi, X., & Oberst, J. 2014, Planet. Space Sci., 102, 51 [Google Scholar]
- Wolters, S. D., Rozitis, B., Duddy, S. R., et al. 2011, MNRAS, 418, 1246 [NASA ADS] [CrossRef] [Google Scholar]
- Wong, I., Brown, M. E., Emery, J. P., et al. 2024, Planet. Sci. J., 5, 87 [CrossRef] [Google Scholar]
- Woolfson, M. 1978, in The Martian Satellites—100 Years On, 19, 101 [Google Scholar]
- Yumoto, K., Tatsumi, E., Kouyama, T., et al. 2024, Icarus, 417, 116122 [NASA ADS] [CrossRef] [Google Scholar]
- Zhang, P., Tai, K., Li, Y., et al. 2022, A&A, 659, A78 [NASA ADS] [CrossRef] [EDP Sciences] [Google Scholar]
All Tables
Best asteroid matches (ordered by the lowest χ2, performed on 139 normalized spectra) in terms of spectral slope for the Phobos blue unit, the Phobos red unit, and Deimos (Fraeman et al. 2014).
Physical, photometric, and spectroscopic properties of asteroids used in this work.
Spectral slope in the VIS (0.7–0.9 µm) and NIR (1.5–2.2 µm) wavelength range for radiance factor and SSA spectra of Deimos (Fraeman et al. 2012, 2014).
All Figures
|
Fig. 1 Templates of featureless spectral types of asteroids of the Mahlke taxonomy (Mahlke et al. 2022), and comparison with Martian moon spectra (Fraeman et al. 2014). |
| In the text | |
|
Fig. 2 VIS slope, NIR slope, and albedo of featureless asteroid types (i.e., B-, C-, M-, P-, D-, and Z-type objects) in comparison with Phobos blue unit, Phobos red unit, and the spectral parameters of Deimos. The spectral slopes for the Martian moons were computed on the spectra obtained by Fraeman et al. (2014), and the albedos were taken from Fornasier et al. (2024) for Phobos and from Thomas et al. (1996) for Deimos. |
| In the text | |
|
Fig. 3 PCA for the first two components PC 1 and PC 2, and t-SNE results for the first two components t-SNE 1 and t-SNE 2. |
| In the text | |
|
Fig. 4 Phobos BU spectrum compared with MITHNEOS-AKARI spectra of some of the best asteroid matches. The MITHNEOS and AKARI spectra cover from 0.5 to 2.5 µm and from 2.5 to 3 µm, respectively. The spectra are normalized at 2.5 µm and shifted by 0.1. |
| In the text | |
|
Fig. 5 MIR spectra of best-match asteroids (panel A) and of the Mars trojan Eureka (panel B) compared to Phobos blue unit and Phobos red unit spectra (Glotch et al. 2018). Starting from Phobos red unit, each spectrum is shifted by 0.08 to the bottom. Between 13 and 15 microns, the Spitzer data may be affected by instrumental artifacts. |
| In the text | |
|
Fig. 6 Comparison between Martian moon spectra and Martian trojans. The geometric albedo pv of the various asteroids was obtained by Trilling et al. (2007) and Nugent et al. (2015) for (5261) Eureka ( |
| In the text | |
|
Fig. 7 Phobos and Deimos spectra from Fraeman et al. (2014) compared with the MRO CRISM Type Spectra Library (Viviano-Beck 2014) divided according to the major classes. The grey area between 2.65 and 2.84 µm corresponds to the lack of data in the CRISM spectra. |
| In the text | |
|
Fig. 8 Comparison between VNIR spectra of the chassignite meteorites NWA 2737 (DD-AHT-067, DD-AHT-068, and DD-AHT-069 obtained from RELAB database (Pieters et al. 2008) and from Mandon et al. 2021) and Chassigny (DD-MDD-023 and MR-MJG-104 obtained from RELAB database), and Phobos and Deimos spectra from Fraeman et al. (2014). The spectra are normalized at 0.55 µm. The reflectance at 0.55 µm (r550) is indicated in the figure for each laboratory spectra. |
| In the text | |
|
Fig. 9 Phobos and Deimos spectra from the TES instrument (Glotch et al. 2018) compared to major terrain of Mars acquired by TES (spectra from by Salvatore et al. (2018); Christensen et al. (2000); Bandfield et al. (2000)). The vertical dashed lines highlight main features in Phobos spectra at 9.8, 11.97, and 21.5 µm. Each spectrum is scaled by a factor reported in the figure legend. |
| In the text | |
|
Fig. C.1 (Top) Comparison between the single-scattering albedo (SSA) spectrum of Deimos (Fraeman et al. 2014) and the radiance factor spectra (corrected and uncorrected) of Deimos (Fraeman et al. 2012). The corrected radiance factor spectrum was corrected using the Hapke model (Fraeman et al. 2012). (Bottom) Comparison between the SSA spectrum of Deimos (Fraeman et al. 2014) and the obtained by Murchie (1999); Rivkin et al. (2002); Takir et al. (2022). As the spectra of Takir et al. (2022) do not cover the 0.5 - 0.65 µm, we have chosen to normalize at 0.7 µm for this figure. |
| In the text | |
|
Fig. D.1 Mid-infrared spectra of best-matched asteroids compared to Phobos blue unit and Phobos red unit spectra observed by PFS (Giuranna et al. 2011). |
| In the text | |
|
Fig. D.2 Near-infrared spectra of Jupiter Trojan asteroid (Wong et al. 2024) in range 1.65–3 µm compared to Phobos red and blue unit and Deimos spectra (Fraeman et al. 2014). |
| In the text | |
|
Fig. D.3 2.6–3 µm region of Phobos and Deimos compared with AKARI spectra of some of the best asteroid matches. Spectra are normalized at 2.6 µm. In the first panel spectra of Red Unit and Deimos are shifted by +0.1 and +0.2 respectively. |
| In the text | |
|
Fig. D.4 Spectra of the four best matches of the Phobos red unit among D- and Z- type asteroids. |
| In the text | |
|
Fig. D.5 Comparison between the spectrum of the Phobos BU and that of the asteroid (21) Lutetia at different phase angles. The difference in the spectral slope is likely due to the rotational variability of the asteroid. |
| In the text | |
|
Fig. E.1 Distribution of asteroids across different spectral types. Panel (a) shows the fractions for all spectral types, while panel (b) focuses on those analogous to Phobos and Deimos (i.e., D, M, P, and Z types). Data are from Table 1 in Mahlke et al. (2022). Orbital class acronyms: NEA – near-Earth asteroids; MC – Mars-crosser; H – Hungaria; IMB – inner main belt; MMB – middle main belt; OMB – outer main belt; Cyb – Cybele; JT – Jovian trojans. |
| In the text | |
Current usage metrics show cumulative count of Article Views (full-text article views including HTML views, PDF and ePub downloads, according to the available data) and Abstracts Views on Vision4Press platform.
Data correspond to usage on the plateform after 2015. The current usage metrics is available 48-96 hours after online publication and is updated daily on week days.
Initial download of the metrics may take a while.