Fig. 9
Download original image
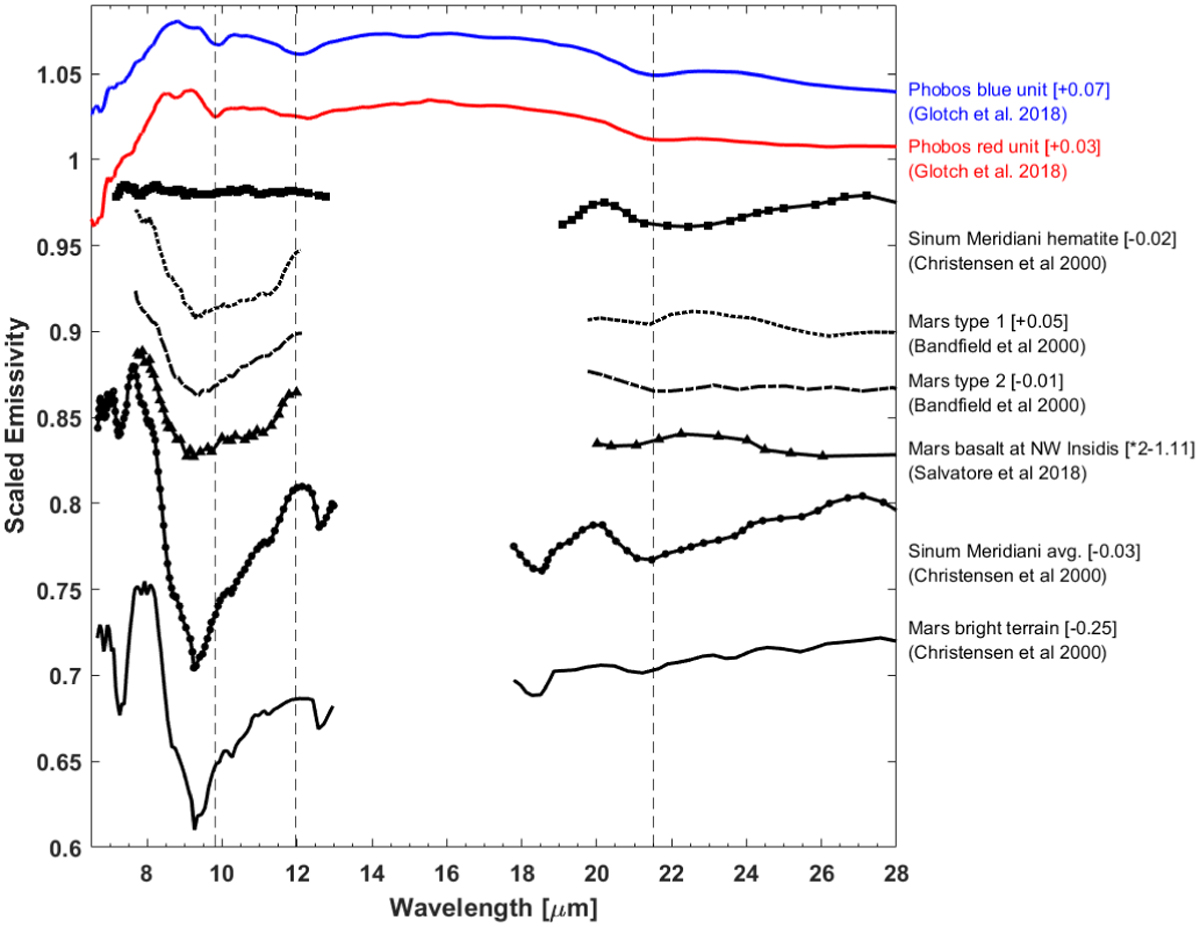
Phobos and Deimos spectra from the TES instrument (Glotch et al. 2018) compared to major terrain of Mars acquired by TES (spectra from by Salvatore et al. (2018); Christensen et al. (2000); Bandfield et al. (2000)). The vertical dashed lines highlight main features in Phobos spectra at 9.8, 11.97, and 21.5 µm. Each spectrum is scaled by a factor reported in the figure legend.
Current usage metrics show cumulative count of Article Views (full-text article views including HTML views, PDF and ePub downloads, according to the available data) and Abstracts Views on Vision4Press platform.
Data correspond to usage on the plateform after 2015. The current usage metrics is available 48-96 hours after online publication and is updated daily on week days.
Initial download of the metrics may take a while.