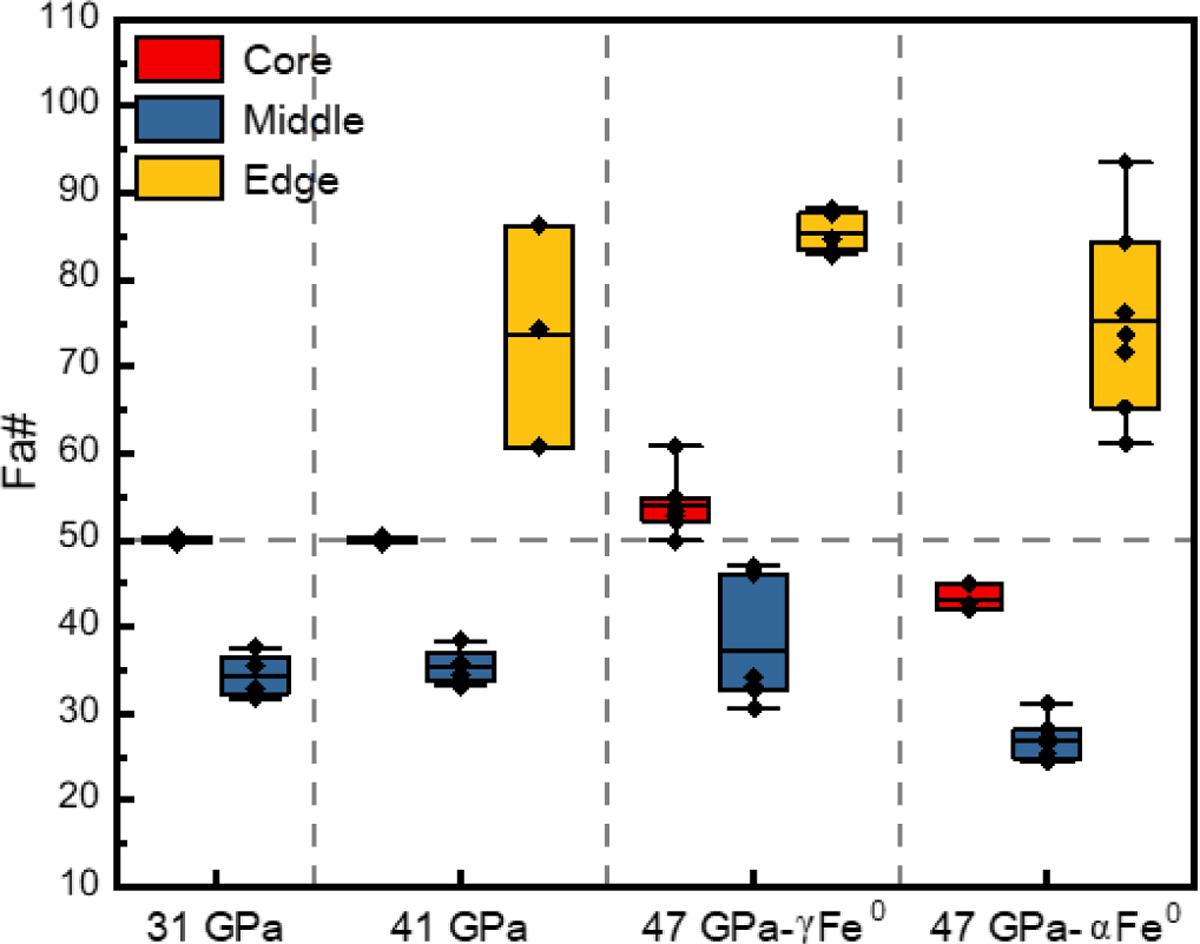
Fig. 7
Download original image
Statistical analysis of Fa# in Fa50 olivine under different shock pressures via TEM-EDS. The red, blue, and yellow boxes represent the distribution ranges (25–75%) of iron content in the core, middle layer, and rim of olivine under different shock pressures, respectively. Whiskers extending from the boxes indicate the maximum and minimum Fe content values. The diamond-shaped markers above the boxes correspond to individual Fe content data points for olivine samples at various shock pressures, whereas the black horizontal lines denote the mean Fe content. “47 GPa-γ Fe0” and “47 GPa-α Fe0” represent olivine regions where γ-phase and α-phase metallic Fe formed, respectively.
Current usage metrics show cumulative count of Article Views (full-text article views including HTML views, PDF and ePub downloads, according to the available data) and Abstracts Views on Vision4Press platform.
Data correspond to usage on the plateform after 2015. The current usage metrics is available 48-96 hours after online publication and is updated daily on week days.
Initial download of the metrics may take a while.