Fig. 2
Download original image
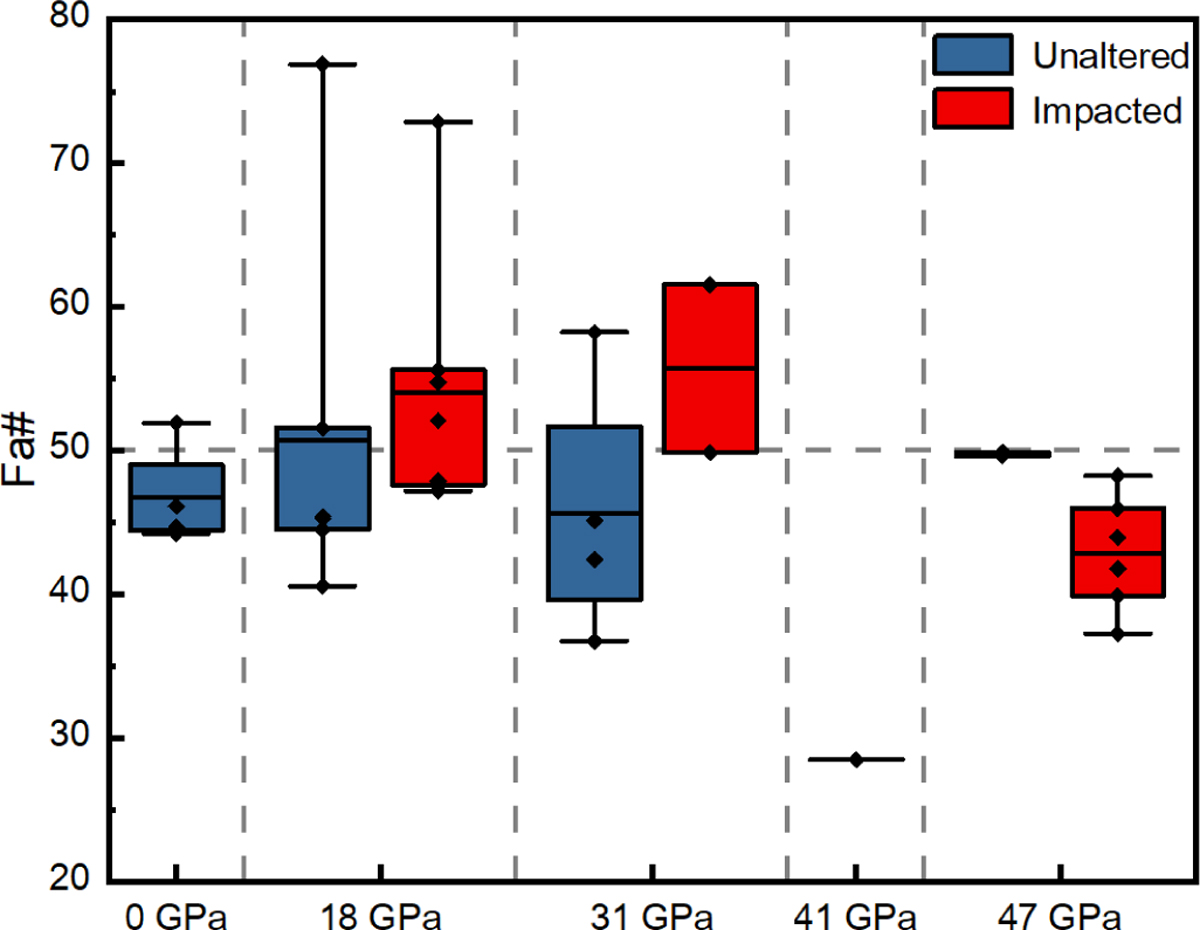
Box plot of iron content in shocked olivine measured by SEMEDS. The blue and red boxes represent the interquartile ranges (25–75%) of the primary iron content in unshocked and shocked samples, respectively, under different shock pressures. The whiskers extending from the boxes represent the maximum and minimum iron content values. Diamond-shaped markers above the boxes denote individual iron content data points for olivine samples at different shock pressures, whereas the black horizontal lines indicate the mean iron content. No box is shown for the 41 GPa condition due to insufficient SEM data collected during measurements.
Current usage metrics show cumulative count of Article Views (full-text article views including HTML views, PDF and ePub downloads, according to the available data) and Abstracts Views on Vision4Press platform.
Data correspond to usage on the plateform after 2015. The current usage metrics is available 48-96 hours after online publication and is updated daily on week days.
Initial download of the metrics may take a while.