Fig. 10
Download original image
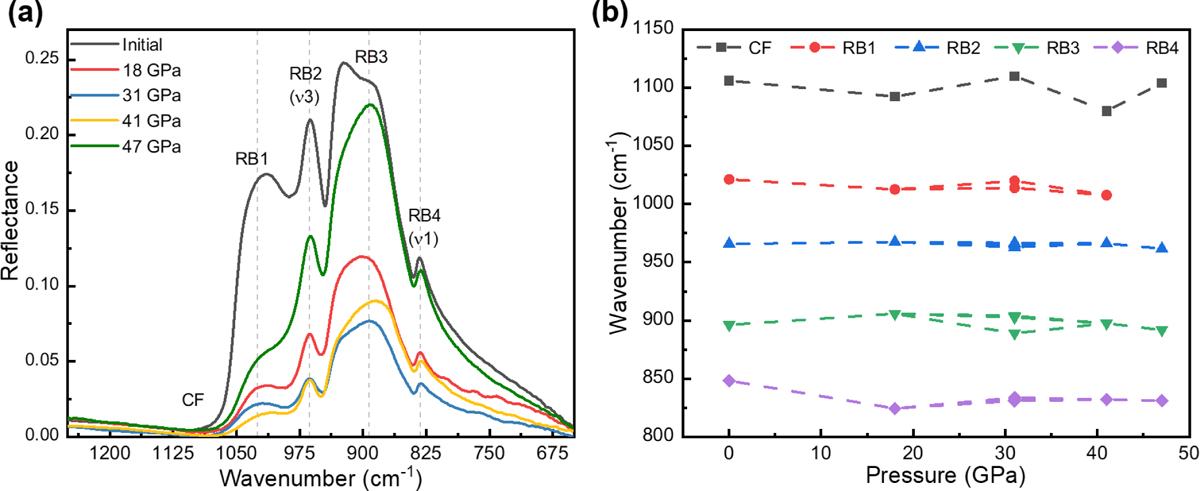
Mid-infrared spectra and statistical analysis of unshocked and shocked Fa50 olivine. (a) Average mid-infrared spectra of olivine in the range of 1250–650 cm−1 under different shock pressures. The MIR reflectance intensity of the shocked olivine samples exhibited a general decrease compared to that of the initial unshocked samples. (b) Point-line plot illustrating the variations in the CF (Christiansen feature) and RB (Reststrahlen band) peaks positions in the mid-infrared spectra of olivine samples as a function of shock pressure. At 47 GPa, RB1 developed a shoulder peak, causing it to be excluded from the statistical graph. Note that, at 31 GPa, two distinct regions, greenish white (powdered) and black (melted), were observed with the naked eye (Fig. A.1d). This results in CF and RB exhibiting two different values for the 31 GPa condition, representing the powdered and melted results, respectively. The RB2 and RB3 peaks remain relatively stable overall, CF, RB1, and RB4 peaks exhibited evident shifts under shock pressures.
Current usage metrics show cumulative count of Article Views (full-text article views including HTML views, PDF and ePub downloads, according to the available data) and Abstracts Views on Vision4Press platform.
Data correspond to usage on the plateform after 2015. The current usage metrics is available 48-96 hours after online publication and is updated daily on week days.
Initial download of the metrics may take a while.