| Issue |
A&A
Volume 696, April 2025
|
|
|---|---|---|
| Article Number | A88 | |
| Number of page(s) | 26 | |
| Section | Extragalactic astronomy | |
| DOI | https://doi.org/10.1051/0004-6361/202553668 | |
| Published online | 08 April 2025 | |
JWST + ALMA ubiquitously discover companion systems within ≲18 kpc around four z ≈ 3.5 luminous radio-loud AGN
1
Zentrum für Astronomie der Universität Heidelberg, Astronomisches Rechen-Institut, Mönchhofstr. 12-14, D-69120 Heidelberg, Germany
2
IPAC, M/C 314-6, California Institute of Technology, 1200 East California Boulevard, Pasadena, CA 91125, USA
3
European Southern Observatory, Karl-Schwarzchild-Str. 2, D-85748 Garching, Germany
4
Univ. Lyon, Univ. Lyon1, ENS de Lyon, CNRS, Centre de Recherche Astrophysique de Lyon UMR5574, 69230 Saint-Genis-Laval, France
5
Jet Propulsion Laboratory, California Institute of Technology, 4800 Oak Grove Drive, Pasadena CA91109, USA
6
Department of Physics, Rhodes College, 2000 N. Parkway, Memphis, TN 38104, USA
7
Université de la Côte d’Azur, Observatoire de la Côte d’Azur, CNRS, Laboratoire Lagrange, Bd de l’Observatoire, CS 34229, F-06304 Nice cedex 4, France
8
Department of Physics and Astronomy, Bloomberg Center, Johns Hopkins University, 3400 N. Charles Street, Baltimore, MD 21218, USA
9
School of Astronomy and Space Science, Nanjing University, Nanjing 210000, China
10
Key Laboratory of Modern Astronomy and Astrophysics, Nanjing University, Ministry of Education, Nanjing 210093, China
⋆ Corresponding author; This email address is being protected from spambots. You need JavaScript enabled to view it.
, This email address is being protected from spambots. You need JavaScript enabled to view it.
Received:
3
January
2025
Accepted:
26
February
2025
Abstract
Mergers play important roles in galaxy evolution at and beyond cosmic noon (z ∼ 3). They have been found to be a trigger of active galactic nuclei (AGN) activity and a process for growing stellar mass and black hole mass. High-z radio galaxies (HzRGs = type-2 radio-loud AGN) are among the most massive galaxies known, and they reside in dense environments on scales of tens of kiloparsecs to Megaparsecs. We present the first search for kiloparsec-scale companions using matched 0.2″ resolution ALMA and JWST/NIRSpec integral field unit data in a sample of four z ∼ 3.5 HzRGs with many supporting datasets. We discovered a total of ∼12 companion systems within ≲18 kpc across all four HzRG fields using two independent detection methods: peculiar [O III]4959, 5007 kinematics offset from the main (systemic) ionized gas component and [C II]158 μm emitters. We examined the velocity fields of these companions and find evidence of disk rotation along with more complex motions. We estimate the dynamical masses of these nearby systems to be Mdyn ∼ 109 − 11 M⊙, which may indicate a minor merger scenario. Our results indicate that these companions may be the trigger of the powerful radio-loud AGN. We discuss the roles of the discovered companion systems in galaxy evolution for these powerful jetted AGN and indicate that they may impede jet launch and deflect the jet.
Key words: galaxies: evolution / galaxies: high-redshift / galaxies: ISM / galaxies: jets / quasars: emission lines
© The Authors 2025
 Open Access article, published by EDP Sciences, under the terms of the Creative Commons Attribution License (https://creativecommons.org/licenses/by/4.0), which permits unrestricted use, distribution, and reproduction in any medium, provided the original work is properly cited.
This article is published in open access under the Subscribe to Open model. This email address is being protected from spambots. You need JavaScript enabled to view it. to support open access publication.
1. Introduction
The hierarchical model for galaxy evolution suggests that galaxy-galaxy mergers are one of the important mechanisms in stellar mass buildup (e.g., Moster et al. 2018; Behroozi et al. 2019). The fraction of mergers, fMM, has been to be higher in the early Universe (e.g., fMM ∼ 0.44 at z ∼ 4.5 through large Atacama Large Millimeter/submillimeter Array, ALMA, survey targeting star forming galaxies, Romano et al. 2021). The merger fraction evolution mirrors the trend of star formation rate (SFR) density through cosmic history with a peak around z ∼ 3 (i.e., cosmic noon, Madau & Dickinson 2014; Huško et al. 2022). Given that the growth rate of supermassive black holes (SMBHs) related to active galactic nuclei (AGN) activity also follows the cosmic SFR density evolution (Heckman & Best 2014), it is reasonable to conclude that the galaxy-galaxy interactions play an important role in feeding black holes and building stellar mass by either direct collapse or stimulating star formation. Indeed, simulations show that the merger processes enhance starbursts (Hopkins et al. 2008a,b). Quasar activity has also been shown to be related to mergers, suggesting that quasars play an important role in both the feeding and feedback processes (e.g., Pierce et al. 2023).
Early works studying mergers were hampered by limited resolution and sensitivity. The detection of mergers is difficult without kinematic information. The successful operation of JWST provided the opportunity for a clearer look. Using the Near Infrared Camera (NIRCam), Gupta et al. (2023) reported that the extreme emission lines observed at z ∼ 3 could be driven by major mergers. Dalmasso et al. (2024) quantified the morphologies of z > 4 galaxies and reported the fraction rate of mergers even beyond the epoch of reionization. In addition to imaging, the Near Infrared Spectrograph (NIRSpec) is a more powerful tool for merger studies, especially with its integral field unit (IFU) mode. For example, Jones et al. (2024) studied the ionized gas kinematics of a dense cluster system at z ∼ 6.34 with the NIRSpec IFU. Resolution-matched observations by ALMA are equally important for high-redshift companion studies. For example, the far-infrared (FIR) line [C II]158 μm (hereinafter [C II]), redshifted into the spectral window of ALMA, is a more reliable tracer of cold gas dynamics than the warm ionized optical lines, which are affected by strong AGN (e.g., Lagache et al. 2018; Dessauges-Zavadsky et al. 2020). Simultaneously, the continuum underneath offers information on the dust content of the galaxies whose detections and morphologies are very useful in the context of merger studies (e.g., Faisst et al. 2020; Romano et al. 2021).
It is of significant interest to look at the so-called transition period from cosmic dawn to noon (i.e., 3 ≲ z ≲ 6) and study how the growth of SMBHs and star formation are reaching their peak. This period of time is important to look for the quenching of some of the most massive galaxies and energetic AGN (e.g., Suzuki et al. 2022). Among the quasar species, high-redshift radio galaxies (HzRGs, Miley & De Breuck 2008) are uniquely useful for investigating close companions and mergers. High-redshift radio galaxies are type-2 quasars, thereby offering a clean view of the vicinity around the host galaxy, with the “natural coronograph” blocking the bright quasar (e.g., Vernet et al. 2001). It has been proposed that mergers are a possible trigger of the powerful jet (radio-loud AGN), but the link is elusive (Chiaberge et al. 2015). With joint JWST and ALMA observations, we can search for companions and merger candidates on tens of kiloparsec scales and move a step toward understanding the ignition of HzRGs and their impact on galaxy evolution.
High-redshift radio galaxies are known to be beacons tracing dense proto-cluster environments (e.g., Venemans et al. 2007). In particular, imaging and spectroscopic observations exploiting Spitzer, Herschel, and the Hubble Space Telescope (HST) have shown the robust detection of companion galaxies (e.g., on cluster scales, Galametz et al. 2012; Ivison et al. 2012; Wylezalek et al. 2013, 2014; Noirot et al. 2016, 2018). Using VLT/Multi Unit Spectroscopic Explorer (MUSE), Vernet et al. (2017) and Wang et al. (2023) found evidence that the ∼100 kpc-scale emission halos around HzRGs are “contaminated" by companions, which also supports this scenario. These works have provided information about early clustering and AGN feedback on the scale of the circumgalactic medium (CGM) and beyond. Due to technical constraints, studies of the environments around HzRGs so far are limited to the CGM. Several works have looked into well-known HzRGs with starbursts using primarily observations from ALMA. The Dragonfly Galaxy (MRC 0152-209 at z = 1.92) was found to be going through a major merger process with a gas rich companion (Emonts et al. 2015; Zhong et al. 2024; Lebowitz et al. 2023). 4C+41.17, at z = 3.8, also shows evidence of a merger with a molecular stream feeding star formation (Rocca-Volmerange et al. 2013; Emonts et al. 2023a). Pérez-Martínez et al. (2024) and Shimakawa et al. (2024) studied the famous HzRG proto-cluster the Spiderweb at z = 2.16 with NIRCam. So far, there are only two HzRGs with published JWST IFU observations. On ∼20 kpc scales, Wang et al. (2024) reported a tentative detection of a companion to 4C+19.71 at z = 3.59. There is also evidence of a companion to TN J1338-1942 at z = 4.1 that is known to reside in a dense environment (Duncan et al. 2023; Roy et al. 2024; Saxena et al. 2024). It is of great interest to inspect the new JWST data together with resolution-matched ALMA data and study nearby companions on galactic scales for a sample of HzRGs. This is crucial to understand the triggering of the most powerful cosmic jets and the evolution of their massive host galaxies (M⋆ ∼ 1011 M⊙, Seymour et al. 2007; De Breuck et al. 2010).
In this paper, we present the first joint analysis of JWST/NIRSpec IFU and ALMA Band 8 observations of a sample of four HzRGs at z ≈ 3.5 and focus on the detection of nearby companions. Throughout this paper, we use the term “companion” for an emission-line component that either has a spatial or velocity offset from the central source. In Sect. 2, we summarize the sample properties and data processing. We present the detection methods and discuss individual companions in Sects. 3 and 4, respectively. Finally, we provide an estimate of companion masses and discuss our results in Sect. 5. Throughout this paper, we assume a flat Λ cosmology with H0 = 70h70 km s−1 Mpc−1 and Ωm = 0.3. Following this cosmology, 1 arcsec = 7.25 − 7.32 kpc at the redshifts in this study.
2. Sample, observations, and data processing
2.1. High-redshift radio galaxy sample
In this work, we search for signatures of companions and/or mergers around four HzRGs at z ≈ 3.5 through joint observations by JWST/NIRSpec and ALMA. These HzRGs come from a group of eight at z ≈ 3 − 5, which have multi-wavelength supporting datasets (e.g., Spitzer, Herschel, and VLT/SINFONI Seymour et al. 2007; De Breuck et al. 2010; Nesvadba et al. 2007, 2017a). In particular, they have observations from MUSE and ALMA Band 3 focusing on the ionized CGM gas (in rest frame UV) and molecular gas (Wang et al. 2023; Kolwa et al. 2023). Our new NIRSpec IFU and new ALMA Band 8 observations cover rest frame optical and FIR in 3D data cubes at matched sub-kpc resolution.
Besides the prerequisite selection for multi-wavelength coverage in three dimensions, these four HzRGs also have a wide range of host properties and radio morphologies. Their host galaxies are very massive with M⋆ ∼ 1011 M⊙. Their SFR span a wide range from upper limit of 84 M⊙ yr−1 (TN J0205+2242) to ∼ 626 M⊙ yr−1 (TN J0121+1320, Table 1). TN J0121+1320 is found to be on the M⋆-SFR main sequence, while the others show signatures of quenching (i.e., below star-forming main sequence and having low gas content, Falkendal et al. 2019; Kolwa et al. 2023). TN J0121+1320 is also the only source with an unresolved radio morphology. The others all have double-lobed morphologies. 4C+19.71 has the most extended jet, with two hot spots separated by ∼60 kpc (e.g., Pentericci et al. 1999). 4C+03.24 shows evidence of a jet being deflected (e.g., van Ojik et al. 1996). This variety in radio morphology implies differences in terms of jet age and the range over which jet-cloud interactions can take place.
Observations and properties of the HzRGs analyzed in this paper.
The systemic redshifts of the sample used in this work are presented in Table 1. Except for 4C+03.24, the systemic redshifts are derived from He II1640 or [C I](1-0) ([C I] hereafter) emission at the radio core (Kolwa et al. 2023). The [C I] emission of 4C+03.24 was known to have Δv[C I] = 123 ± 282 km s−1 redshifted from the warm ionized gas prior to JWST observations (e.g., Wang et al. 2023). This is confirmed by our new NIRSpec IFU data. Throughout this work, we adopt the redshift determined from [O III]5007 based on VLT/SINFONI data (Nesvadba et al. 2017a). These redshifts are from observations with lower spatial resolution and sensitivity than the data presented here. They are assumed to trace diffused gas ionized by the AGN and are found typically within ∼300 km s−1 of the core [O III]5007 velocity measured by NIRSpec IFU.
We note that there was no prerequisite for any of the HzRGs to be in cluster environments on large scales. The only common features of these four HzRGs are their similar redshifts, multi-wavelength supporting data, and bright Lyα emission nebulae.
2.2. JWST/NIRSpec IFU
The NIRSpec IFU data presented here were taken from the JWST Cycle 1 General Observer (GO) program JWST-GO-1970 (PI: Wuji Wang) between UT 2022 October 30 and 2023 August 29. Our observations targeted the four HzRGs (Sect. 2.1) at z ≈ 3.5 using G235H/F170LP. This offers the wavelength coverage of 1.70 − 3.15 μm in the observed frame or ∼ 3700 − 7620 Å in the rest frame with a spectral resolution of 85 − 150 km s−1. In this setup, we capture all major optical emission lines seen in type-2 AGN (i.e., [O II]3726, 3729 to Hα, including [S II]6716, 6731) at once (e.g., Zakamska et al. 2003). We adopted a 9-point dither pattern and the improved reference sampling and subtraction (IRS2) read-out pattern. The total on-source exposure time ranged from 3.7 to 4.0 h per target. For 4C+03.24 and 4C+19.71, we included the leakage exposure, ∼0.4 h each, to identify contamination light due to failed open shutters on the micro-shutter array (MSA) at the first dither position. For TN J0205+2242 and TN J0121+1320, we designed pointing verification imaging exposures, ∼233 s each, after the science observation with MSA shutters all-open to improve the astrometry (e.g., Wang et al. 2024).
We downloaded all raw data from the Mikulski Archive for Space Telescopes (MAST). We used v1.13.4 of the JWST Science Calibration pipeline1 with the Calibration Reference Data System (CRDS) context file jwst_1202.pmap. Our procedure is similar to Vayner et al. (2023) and Wang et al. (2024). Specifically, we executed the standard first and second stages of the pipeline. We subtracted the 1/f noise from the rate files resulted from stage 1. The stage 3 of the standard pipeline does not perform well the outlier rejection. Therefore, we used sigma clipping to combine the dithered exposures into the final data cube. The primary source of outliers for our observations is likely cosmic rays due to the adopted readout mode. We did not include flux calibration step as in Wang et al. (2024) since the standard pipeline already has a good performance (i.e., relative flux difference < 5% for 4C+19.71). The flux density unit of the final cube was converted into erg s−1 cm−2 Å−1. The data described here may be obtained from https://doi.org/10.17909/jr3z-xc48.
Through out the field of view (FoV), there is an uniform background continuum emission with a flux density of several 10−21 erg s−1 cm−2 Å−1, and it is brighter at shorter wavelength. To subtract this background, we first extracted the median background spectrum by spatially masking the continuum emission sources and continuum-like patterns (presumably leakage emission from the MSA). Then, we fitted a fifth or sixth order polynomial to the median background spectrum. Finally, we subtracted this fitted contribution from the whole data cube. The final cubes have a rms noise at 2.6 μm of ∼4 to 6 × 10⁻²² erg s−1 cm−2 Å−1 per wavelength channel.
The point spread function (PSF) of the NIRSpec IFU depends on wavelength and spatial position. The HzRGs analyzed in the paper are all type-2 AGN, meaning the presumed bright point-like quasar is obscured. Hence, it is not necessary for us to subtract the PSF of the quasar. The full width at half maximum (FWHM) of the JWST PSF used in this work is given as the one constructed in Vayner et al. (2024a), which has a typical size of ∼0.11″.
2.3. ALMA Band 8
Our ALMA Band 8 observations were taken under the program ID 2021.1.00576S (PI: Wuji Wang). The observations of TN J0121+1320 and 4C+19.71 were fully carried out. For the remaining two, only half of the proposed integration times were executed. Despite the shallow exposure time, [C II] lines are detected in the field of TN J0205+2242 and 4C+03.24. However, the FIR continuum of these two are undetected. These observations were carried out in C43-5 configuration between UT 2022 June 17 and 2022 August 10. We set up one spectral window in Band 8 to be centered at the redshifted frequency of [C II] (νrest = 1900.537 GHz). Then, the other three spectral windows were used to observe dust emission. We note that the unexpected broad [C II] line width relative to the width of spectral window (1.875 GHz ∼ 1350 km s−1) and the redshift uncertainty end up of the line detection in two consecutive spectral windows, especially TN J0121+1320 and 4C+19.71 (see processing below). The default ALMA bandpass and phase calibrations were adopted.
We processed the data using the Common Astronomy Software Applications for Radio Astronomy v6.6.0 (CASA, CASA Team et al. 2022). The task tclean was used to clean the cube down to a 2σ level. For TN J0121+1320 and 4C+19.71, we use the cubes with Briggs weighting of robust = +0.5 in the analysis. For TN J0205+2242 and 4C+03.24, we use the cubes with Briggs weighting of robust = +2.0. This provides higher signal to noise ratio (S/N) with a trade off in spatial resolution. We cleaned the two consecutive spectral windows with [C II] together without continuum subtraction in the uv-plane. The shapes of the spectra at the transition frequencies of the two windows were compared to the cubes cleaned individually. We did not find any jump in flux. Throughout the paper, we used the cubes and continuum maps (for the two with detections) after the primary beam correction. The final cubes were smoothed to 14 km s−1 per channel. The choice of resolution element is a balance among S/N, continuum coverage and a sufficient number of channels for dynamical study (especially for TN J0121+1320 and 4C+19.71). The rms noise of the [C II] cubes at the systemic redshift are 3.0 mJy beam−1, 1.3 mJy beam−1, 1.1 mJy beam−1, and 1.0 mJy beam−1 per channel for TN J0205+2242, TN J0121+1320, 4C+03.24, and 4C+19.71, respectively. The rms noise for the continuum maps constructed from the individual spectral windows are 76 μJy beam−1 and 92 μJy beam−1 for TN J0121+1320 and 4C+19.71, respectively. The continuum images for these two targets from the spectra windows are centered at the lowest frequency; that is, they are separated the most from the windows with line emission. For the remaining two without FIR continuum detections, we report 3σ upper limits of 0.28 mJy beam−1 and 0.25 mJy beam−1 for TN J0205+2242 and 4C+03.24, respectively. These upper limits were calculated from the continuum images constructed using all four spectral windows.
2.4. Astrometric alignment of NIRSpec IFU cubes
The absolute astrometric calibration of NIRSpec IFU observations is known to have a ∼0.2 − 0.3″ uncertainty (Perna et al. 2023; Wang et al. 2024, and private communication with NIRSpec instrument scientists at STScI). Hence, we manually align the World Coordinate System (WCS) of our targets to other datasets with known WCS. Our manual shifts are summarized in Table 1. The assumption behind this alignment is that the continuum detected by the NIRSpec IFU is at the position of the radio AGN (i.e., core position of the radio jet). The NIRSpec IFU continuum may be affected by leakage light through micro-shutter array and other artifacts. We checked the continuum and found that the continuum centroids are often close, < 0.1″, to the position of the brightness peak of the emission lines (e.g., [O III]5007), which supports our assumption. Specifically, to determine the alignment, we fitted a 2D Gaussian profile to the continuum of the radio galaxy at observed wavelength 2.6 μm (i.e., line-free region at rest frame ∼ 5770 Å at z = 3.5). Similarly, we fit a 2D Gaussian profile to the radio core observed at 8.4 GHz (van Ojik et al. 1996; Nesvadba et al. 2007, 2017a). We then shifted the WCS of the NIRSpec IFU to match the radio data.
The case of TN J0121+1320 is complex. Its compact radio emission has an offset of ∼1″ from the ALMA Band 8 dust position. Assuming that the WCS of the two interferometers are accurate, this may already suggest an offset likely due the existence of companions. In addition, we find a foreground galaxy at z = 1.4577 in the NIRSpec IFU cube as well as the MUSE cube whose continuum may contaminate TN J0121+1320 (see Appendix D.1 and MUSE data in Wang et al. 2023). It is located to the north of the radio emission with a projected offset of ∼0.5″. There is another continuum source detected by the NIRSpec IFU located west of the radio emission with an offset of ∼0.7″ (discussed in Sect. 4.1). This continuum position is not at the same position as the brightness peak of the optical line (e.g., [O III]5007). The projected separations quoted here are prior to the astrometric correction. Assuming the WCS assigned by the JWST pipeline is accurate to ∼0.2″ to 0.3″, this western continuum may not be the emission associated with the radio galaxy. Hence, our correction procedure for TN J0121+1320 is based on the foreground object in the north. As its continuum is faint and presumably blended with TN J0121+1320 by MUSE, we used the fitted 2D Gaussian positions of the foreground [O II]3726, 3729 line in the MUSE data cube and its [S III]9533 line in NIRSpec IFU data cube to determine the WCS correction. The narrow band [O II]3726, 3729 line emission map is spatially unresolved, which leads to less uncertainty in the position determination. The resulting shift is −0.21″ and 0.003″ in RA and Dec, respectively, consistent with the expected systemic uncertainty. After the correction, we found that the western optical continuum is aligned with the ALMA dust position.
In Wang et al. (2024), we used one of the foreground galaxies to determine the astrometric correction (G1 in their naming format and using imaging data from HST). In this work, we updated the reduction of the 8.4 GHz radio observation where the previously unseen radio core is now detected at 5σ (program AN129, Nesvadba et al. 2017a). The aligned WCS of 4C+19.71 in this work has an offset of ∼0.16″ from the one in Wang et al. (2024). In addition, the position of the dust continuum observed by ALMA Band 8 is aligned with the radio core (Sect. 2.3).
2.5. Radio maps
In this work, we only used the radio observations to trace the position of the jets. We adopted the VLA X-Band (8.4 GHz) radio maps of TN J0205+2242 published in Nesvadba et al. (2007).
We used the new radio data of 4C+03.24 in this work (see e.g., van Ojik et al. 1996; Wang et al. 2023, for previous radio data). The observation of 4C+03.24 was carried on UT 2024 December 20, UT 2025 January 02, and UT 2025 January 03 with the VLA in A configuration in the Ku-band covering a frequency range of 12–18 GHz (Project 24B-147, PI: Carlos De Breuck). The target was observed for 5 h (8.7 h in total) over a contiguous Local Sidereal Time (LST) range for good sampling of the uv-plane. The 6 GHz bandwidth was split into 48 spectral windows of 128 channels of 2 MHz width each, and a sample integration time of 2 s. 3C286 and J1224+0330 were used as the flux and phase calibrators, respectively. Pointing calibration was also performed using both sources. The data were then cross-calibrated, imaged and self-calibrated in CASA. The final image was made using Briggs weighting with a robust = 0.0. We obtained a resolution of 0.15″ × 0.13″ (PA = 56.5°) and rms noise of ∼4.5 μJy beam−1.
We reprocessed archival VLA C-band observations of 4C+19.71 (MG2144+1929) using CASA and detected the previously unseen radio core (Nesvadba et al. 2017a). The observation was carried on UT 2012 December 22 with the VLA in A configuration (Project code: 12B-243). The target was observed for ∼15 min with an integration time of 1 s and 16 spectral windows of 128 MHz bandwidth each, between 4.15 and 7.85 GHz. For our analysis, we only used the 8 spectral windows from 6.95 to 7.85 GHz. Each spectral window consisted of 32 channels of 4 MHz width. 3C 48 and J2139+1423 were used as the flux and phase calibrators, respectively. The data were manually flagged and cross-calibrated in CASA, set to the same flux scale as above. Imaging and self-calibration were then performed using the tasks tclean and gaincal respectively. The final image was made using Briggs weighting with robust = +0.5. We obtained a resolution of 0.25″ × 0.24″ and an rms noise of ∼17 μJy beam−1.
We reprocessed archival VLA X-band observations of TN J0121+1320, carried out on UT 1998 May 07 with the VLA in A configuration (Project code: AY92). The target was observed for ∼9 min with an integration time of 10 s and two spectral windows of 50 MHz bandwidth centered at 8.435 and 8.485 GHz each. 3C 286 and J0121+118 were used as the flux and phase calibrators, respectively. The data were manually flagged and cross-calibrated using Astronomical Image Processing System (AIPS, Greisen 2003). The flux scale was set according to Perley & Butler (2017). The data were then imaged using CASA. The final image was made using task tclean and Briggs weighting with robust = –0.5. We obtained a resolution of 0.24″ × 0.24″ and rms noise of ∼90 μJy beam−1. We were not able to perform reliable self-calibration of the data due to the low S/N of the solutions. However, the source position is still reliable, which is the only information used in this analysis.
3. Analysis
In this section we first describe general methods used to search for companions around our radio AGN. We used two independent approaches to identify companion systems: (i) peculiar kinematics of warm ionized gas observed by JWST/NIRSpec IFU ([O III], Sect. 3.1) and (ii) cold gas observed by ALMA ([C II], Sect. 3.2). We also look for continuum emission from the companions detected by the two methods (Sect. 3.3). We note that a systematic continuum study is beyond the scope of this work, especially optical continuum studies, which would require careful treatment in data processing. Hence, in this paper, we do not leverage detection of continuum as evidence for a companion. We name the companions by their central radio AGN followed by the detection method. For example, the companion in the field of TN J0121+1320 detected through [O III] is named as J0121-[O III]. If more than one companion is detected in the same field using the same method, we name these alphabetically in the order of redshift. For example, the [C II] companion with the lowest redshift in the field of 4C+03.24 is named as 4C03-[C II]-A. There is a companion detected in both methods (i.e., J0121-[O III] and J0121-[C II]-C may be one companion; see Sect. 4.1). We note that our analysis may not be complete in the sense of detecting all possible companion sources in the fields of the radio galaxies, but we focus here specifically on peculiar warm ionized gas kinematics and [C II] detections. Furthermore, we deliberately refer to the detected structures as companions rather than galaxies as we do not necessarily detect stellar continuum at each location. These companions could therefore also represent isolated gas clouds, possibly related to ongoing jet activity as suggested in simulations (e.g., Ondaro-Mallea et al. 2024).
3.1. Warm ionized gas kinematics
We first search for peculiar ionized gas kinematics captured by the NIRSpec IFU as a signature of companions. [O III]5007 is one of the brightest optical emission lines and is a traditional kinematic tracer of warm ionized gas around AGN (e.g., Harrison et al. 2014). Using VLT/SINFONI observations of [O III]5007, Nesvadba et al. (2007); Nesvadba et al. (2017a) analyzed the ionized gas kinematics of a large sample HzRGs, including our targets. At a spatial resolution of ∼0.5″ to 0.8″, the bulk motion of the ionized gas is found to be consistent with jet-driven outflows. JWST/NIRSpec IFU makes it possible to examine the sub-kpc kinematics at and beyond cosmic noon with the same tracer (e.g., Perna et al. 2023; Vayner et al. 2024a; Wang et al. 2024). As pointed by some studies, the nature of some outflows may be confined on smaller scales, only evident at finer resolution and high sensitivity (e.g., Wang et al. 2024; Holden & Tadhunter 2025). When focusing on the vicinity (≲18 kpc) of the brightest quasars, we often have [O III]5007 out to the edge of the FoV. Hence, we classify a [O III]5007 emitter as a companion in this study by leveraging the full 3D information of the data cube.
Specifically, we visually inspect the [O III]5007 emission at different velocity channels (e.g., Figs. 1a, 1b and Appendix A). For each target, we detect line-emitting gas blobs to an extent of ∼3 − 6 kpc that are kinematically distinct from the tens of kiloparsecs scale velocity fields seen in the SINFONI data. That is to say, these blobs are different from both large-scale outflows and gaseous nebulae at the systemic redshift. To further separate the companion emission, we decompose these line-emitting components by fitting r = 0.1″ aperture-extracted spectra using q3dfit (Wylezalek et al. 2022; Rupke et al. 2023). In q3dfit, the wavelength dependent spectral resolution is taken into account. The fitting is done simultaneously for all bright emission lines covered, namely [O II]3726, 3729, Hβ, [O III]4959, 5007, Hα, [N II]6548, 6583, and [S II]6716, 6731, while keeping the Gaussian components for different lines kinematically tied (i.e., the redshift and line widths are fixed for corresponding components; see also Vayner et al. 2023; Wang et al. 2024). The flux ratios of doublets are set according to atomic physics: F[O III]5007/F[O III]4959 = 3 and F[N II]6583/F[N II]6548 = 3. We limit F[S II]6716/F[S II]6731 to the range [0.4375, 1.4484] and fixed the ratio of spectrally unresolved [O II]3726,3729 to F[O II]3726/F[O II]3729 = 1 (e.g., Sanders et al. 2016). The optimized number of components are determined by q3dfit, with a maximum allowed number as input. For comparison, we also fit the spectra at central AGN positions through the same procedure (e.g., Fig. 1c). The fitting results are presented in Table B.1.
 |
Fig. 1. Emission line maps and spectra of TN J0121+1320 showing the [O III] companion search. (a, b): [O III]5007 channel maps. Each map is integrated over three consecutive wavelength channels (i.e., ∼150 km s−1). The central velocity is marked at the top right corner. We mark the position of the radio AGN with a magenta star. The position of [O III] companion and the [C II] companions are marked by a blue triangle and red square, respectively. The position of the foreground galaxy is marked with a blue dot. The ALMA 400 GHz continuum is shown as white contours (levels of [0.35, 0.63, 1.1, 2.0, 3.0] mJy beam−1). The 8 GHz radio emission is shown as green contours. We illustrate the sizes of the NIRSpec IFU PSF (gray) and the synthesized beam of ALMA 400 GHz (θ400 GHz white) at the bottom left of each panel. (c): [O III]4959, 5007 spectra at the positions of the radio AGN (upper) and J0121-[O III] (lower). These continuum-subtracted spectra were extracted using r = 0.1″ apertures. The best fits from q3dfit are in dark magenta. Different Gaussian components are shown in shaded colors. The fitted Gaussian component of J0121-[O III] is highlighted in dark red. The vertical shaded regions mark the velocity ranges where the channel maps in panels (a, b) are integrated. The projected distance between the [O III] companion and radio core is marked at the top right corner of the lower panel. (d): Velocity map of J0121-[O III] constructed from the q3dfit fitting. The markers and contours are the same as in panels (a, b). (e): Example [O III]4959, 5007 spectra from two spaxels showcasing the different kinematics across J0121-[O III]. The Gaussian components are highlighted in blue and red for bluer and redder Δv, respectively. |
We further map the companion emissions spatially to demonstrate their offset from the bulk emission on larger scales. Using q3dfit, we fit spaxel-based spectra around the companion positions. Due to the limitation of S/N and the focus on kinematics, we limit this spatial fit only to [O III]4959, 5007. We detect velocity gradients for three out of the four [O III] emission blobs. The gradient detection of 4C19-[O III] is tentative. We present the velocity shift maps and exemplar spectra at both ends of the gradient to demonstrate the gas kinematics (e.g., Figs. 1d and 1e). We refer to these line-emitting gaseous blobs with peculiar kinematics as “[O III] companions” and examine them individually below.
3.2. [C II] emitters
The brightest FIR emission line, [C II] is a frequently used gas tracer at high-redshift (e.g., Lagache et al. 2018; Dessauges-Zavadsky et al. 2020). Directly associated with photodissociation regions, the detection of [C II] may indicate the presence of cold gas systems. Moreover, it has been used as a kinematic tracer of regular motion (e.g., rotation) and merger activity (Lelli et al. 2021; Romano et al. 2021; Herrera-Camus et al. 2022).
We examine the ALMA Band 8 data cubes and detect at least one [C II] emitters at ≳3σ in the field around each the four radio AGN. We present the [C II] moment 0 maps constructed from velocity channels where emission is detected (e.g., contours in Fig. 2a). We then extract 1D spectra at the position of [C II] emitters (e.g., Fig. 2b). For the field of TN J0121+1320 and 4C+19.71, we use apertures with the size of the major synthesized beam. For TN J0205+2242 and 4C+03.24, we increase the aperture to twice the size of major synthesized beam to increase the S/N. We perform line fitting to the 1D spectra with one Gaussian component (Table B.2). For the brighter [C II] companions (S/N > 10σ; i.e., J0121-[C II]-B and 4C19-[C II]; see Sects. 4.1 and 4.4), we also conduct spatial fitting using 3DBAROLO to study the dynamics of the cold ionized gas (see Appendix C and Di Teodoro & Fraternali 2015).
 |
Fig. 2. Emission line maps and spectra of TN J0121+1320 showing evidence of [C II] companion detection. (a): [C II] moment 0 maps in contours integrated at different channels as indicated in the bottom right corner. The contours are given in [3, 4, 5, …] × σ levels, where σ is the rms noise of the map. We note that only odd σ levels are used for [C II]-B for better visualization. The gray scale background image is the same as Fig. 1b. The red open crosses mark the positions of the [C II] companions, i.e., the same as the red boxes in Fig. 1. (b): [C II] spectra extracted at the [C II] companion positions. The vertical shaded regions mark the velocity ranges where the moment 0 maps in panel (a) are integrated. The single Gaussian fit of [C II] spectra are shown as dark magenta curves. Where available, we show the [O III]5007 spectra in black in arbitrary units extracted at the same position with the same aperture as the [C II] companion. We mark the projected distance between the [C II] and the radio core at the top right corners. |
We refer to these [C II] emitting systems as “[C II] companion” and examine them individually below. To compare the warm and cold ionized gas at the position of [C II] companions, we overlay the [O III] surface brightness map and 1D spectra with the [C II] moment 0 map and spectra (e.g., Fig. 2). Without further information, we cannot rule out the possibility that the “[C II] emissions” without corresponding [O III] emission or dust continuum (Sect. 3.3) are different lines detected at different redshifts. In this paper, we assume the lines detected by ALMA Band 8 are [C II] at similar redshifts to the central HzRGs.
3.3. Continuum check
We examine the continuum at the positions of each of the [O III] and [C II] companions (Table 2). For potential companions, we may expect optical continuum emission, captured by NIRSpec IFU, which would presumably be dominated by evolved stellar populations. The ALMA Band 8 continuum (i.e., rest frame ∼150 μm) is emitted by cold dust, which may trace forming stars. The case becomes more complicated with the presence of an AGN that could dominate the optical continuum (Wang et al. 2024). Excluding the companions near the radio AGN, we only find that J0121-[C II]-B shows optical continuum emission (Fig. 3). As for FIR continuum, we detect emission from J0121-[C II]-A, J0121-[C II]-B, and 4C19-[C II].
Properties of the companions detected in this work.
 |
Fig. 3. NIRSpec IFU spectrum of J0121-[C II]-B extracted from r = 0.2″ aperture to maximize the continuum. The zoom-in focuses on the continuum shape. We mark the positions of bright emission lines. The yellow spectrum is the Bagpipe model with M⋆ = 109.9 M⊙ and AV = 1.5 (Carnall et al. 2018). The vertical gray shaded region indicates the detector gap. |
The most interesting case is from the field of 4C+03.24 (Sect. 4.3). We discovered a tail-like continuum toward the south. It has a similar morphology to the systemic [O III]5007 emission. MUSE observation also captured UV continuum with a similar morphology (Appendix D.2).
4. Results
In this section we report evidence for nearby companions around our radio AGN following the methods in Sect. 3. Since the nature (i.e., interpretation of the gas dynamics) are unique for each target, we examine them individually. The properties of the companions detected in this work are summarized in Table 2.
4.1. Companions of TN J0121+1320
TN J0121+1320 is the only target in our sample without a clearly resolved radio core. In this section we first define the position of the radio AGN and then present evidence of nearby companions around it.
4.1.1. Radio core of TN J0121+1320
The radio emission from TN J0121+1320 has a compact morphology even in the highest resolution 8.4 GHz dirty image (∼0.3″). It only shows an elongation along the east-west direction (e.g., green contours in Figs. 1a and 1b). We adopt the west peak of this elongation as the radio core based on: (i) its position being closer to the peak position of the line emission (e.g., [O III]5007); (ii) the morphology of [O III]5007 at Δv = 0 km s−1 resembling AGN ionization cone (Fig. 1a); (iii) its ALMA 100 GHz continuum being skewed spatially toward the west (Falkendal et al. 2019). Argument (iii) is also based on the spectral energy distribution (SED) study of Falkendal et al. (2019) where the ALMA Band 3 continuum was used to constrain the radio sychrotron emission and the cold dust continuum (see their Fig. A.7). Based on their analysis, the 100 GHz Band 3 continuum may be contributed by both. If it indeed contains synchrotron emission, then the closer west 8.4 GHz radio excess is likely to be the radio core of the radio AGN. Taking our new Band 8 continuum into consideration, the 100 GHz continuum seems likely to trace more diffuse and colder dust. Even in this case, the host galaxy is more likely located toward the west where the dust is.
4.1.2. Results of companion search
De Breuck et al. (2002) reported a 18–19 mag detection of TN J0121+1320 in Ks using Keck/NIRC, which may indicate the presence of nearby companions based on morphology (seeing 0.4″ − 0.5″). We caution that the Ks observation was likely contaminated by bright [O III]4959,5007 emission2. Based on a seeing-limited SINFONI K-band observation (0.65″ × 0.55″), Nesvadba et al. (2007) reported two [O III]4959,5007 spatial components in the field of TN J0121+1320 separated by ∼10 kpc (component A and B under their naming). They also detected K = 19.8 ± 0.4 mag continuum emission at the emission peak of [O III]4959,5007 after excluding the line contamination (their component A). Nesvadba et al. (2007) suggested that component A may be the host galaxy of the radio AGN. We note that the continuum of radio AGN host galaxy may be contaminated by the foreground galaxy ∼0.45″ from the radio core (blue dot in Figs. 1a and 1b; see also Appendix D.1). Though it may also be affected by leakage from MSA, we find that the continuum detected near the radio core in our NIRSpec IFU data is indeed spatially skewed toward the position of the foreground galaxy.
We next focus on the new evidence of nearby companions in our latest datasets with sub-kiloparsec resolution that reveal that there may be three systems across the ∼25 kpc FoV. To the west of the radio core of TN J0121+1320, we detect a ∼6 kpc extended bright [O III] line-emitting nebula, J0121-[O III], (blue triangle in Figs. 1a and 1b). As shown in the spectrum in Fig. 1c, the dominant emission component of J0121-[O III] is 434 km s−1 redshifted from the systemic velocity and has a width σv = 95 ± 3 km s−1 (Table B.1). This is consistent with the results of Nesvadba et al. (2007) (i.e., their component B). J0121-[O III] is at a projected distance of ∼12.6 kpc from the radio AGN, dRG, measured from the peak [O III] emission. Its narrower line width reveals its AGN-undisturbed nature. This suggests it is a distinct system from the gaseous medium surrounding the radio AGN and is likely a nearby companion. We map the kinematics of J0121-[O III] in Fig. 1d across ∼25 kpc2, a clear velocity gradient along the north-south direction with Δv ∼ 400 km s−1. Visually, the Δv map does not resemble disk rotation in that. There is no clearly defined positive-negative velocity transition edge. 3DBAROLO (Di Teodoro & Fraternali 2015) fitting of this [O III] emission nebula also does not indicate a clear rotation structure.
In addition to the [O III] companion, we detect three [C II] companions in this field (Fig. 2). J0121-[C II]-A is at dRG = 17.2 kpc away from the radio core with a Δv = −401 km s−1. Cold dust continuum is also detected at this position. We do not have information about warm ionized gas at this position since J0121-[C II]-A is outside the NIRSpec IFU FoV. J0121-[C II]-C is at dRG = 11.1 kpc and falls within the ionized nebula of J0121-[O III]. J0121-[C II]-C (Fig. 2, Table B.2) has Δv = 366 km s−1 and a similar profile to the [O III]5007 line at the same position. Therefore, J0121-[C II]-C and J0121-[O III] may trace the same companion system. J0121-[C II]-B has the brightest [C II] emission and is at dRG = 6.4 kpc. Compared to the [O III]5007 at the same position, J0121-[C II]-B may have different dynamics.
To further study the cold ionized gas dynamics of J0121-[C II]-B, we performed spatial [C II] fitting using 3DBAROLO (Di Teodoro & Fraternali 2015, and Appendix C for details). The result is shown in Fig. 4 where we find a velocity gradient of ∼400 km s−1 along the north-south direction (i.e., PA = 187° for the kinematic major axis). The residual from 3DBAROLO and the position-velocity diagram (especially moment 2 residual in Figs. C.1 and C.3) indicate gas motions other than disk rotation.
 |
Fig. 4. Moment 1 (line-of-sight velocity) map of 3DBAROLO [C II] fit to J0121-[C II]-B. The data, model, and residual are shown in the left, middle, and right panels, respectively. The black cross marks the kinematic center. The black dashed line indicates the kinematic major axis. The green contours mark zero velocity, which has a Δv = 114 km s−1 offset between the systemic redshift (Table 1). |
Both FIR and optical continuum are detected at J0121-[C II]-B (Figs. 1 and 3). We show the aperture-extracted optical spectrum at J0121-[C II]-B. A stellar continuum fit is beyond the scope of this work. Instead, we overlay a model spectrum generated using Bagpipe (Carnall et al. 2018). We used a single starburst model with solar metallicity. The extinction is set to AV = 1.5 mag based on Balmer decrement and Calzetti et al. (2000) law. We find that this continuum level could be consistent with a galaxy with M⋆ = 109.9 M⊙. This model spectrum should simply be considered as a zeroth order indication of the stellar mass.
4.2. Companion search of TN J0205+2242
We detect a [O III] line-emitting blob, J0205-[O III], dRG ∼ 3.22 kpc south of the radio AGN TN J0205+2242 (Figs. 5a and 5b). This kinematic feature was missed in previous SINFONI observations due to its limited spatial resolution and sensitivity (0.45″ × 0.4″ with adaptive optics correction, Nesvadba et al. 2007). J0205-[O III] has Δv = −1426 km s−1 with respect to the systemic redshift of TN J0205+2242. It has a morphology with ∼3 kpc extent which is barely resolved by the NIRSpec IFU. Compared to the spectrum of the central AGN, J0205-[O III] is a distinct emission component (cyan Gaussian, Fig. 5c). The fitted line width is relatively broad with σv = 390 km s−1 which could be affected by beam smearing. That is to say that the physical scale of J0205-[O III] cloud is small compared to the resolution of NIRSpec IFU, ∼0.1 to 0.2″ (e.g., Vayner et al. 2023, 2024a,b). As a result, the unresolved gas motion (e.g., velocity gradient due to rotation) artificially broadens the observed line width. J0205-[O III] has a tentative spatial velocity gradient along the northeast to southwest direction with ∼300 km s−1 (Figs. 5d and 5e). Another possibility is that this broad line width is due to the impact from the central AGN.
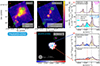 |
Fig. 5. Similar to Fig. 1, emission line maps and spectra of TN J0205+2242 showing the [O III] companion search. The northern [O III]5007 emission blob in panel (b) could be an outflowing component spectrally related to radio core. The Gaussian fit to [O III] for J0205-[O III] is highlighted in cyan in panel (c). We note that spectra in panel (c) have different y-axis limits. |
We detect tentative [C II] emission, J0205-[C II], dRG = 5.0 kpc north of the radio core at 3σ (Fig. 6). The 1D spectrum shows a narrow line with σv = 54 km s−1 (Table B.2). Given low S/N, we take this as a marginal detection though there is a [O III] counterpart which may strengthens confidence in its existence (see the [O III] line profile in Fig. 6b). The nature of this system would be more tentative if only one dataset were available. This showcases the advantage of joint ALMA-JWST observation for discovering companion systems.
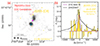 |
Fig. 6. Similar to Fig. 2, [C II] moment 0 map and spectrum of J0205-[C II]. Given the low S/N, the [C II] spectrum has been rebinned by a factor of three to 42 km s−1. |
4.3. Companions of 4C+03.24
In this work, we use the new VLA 15 GHz observation of 4C+03.24 to trace the jet morphology (Sect. 2.5). In this rest-frame 70 GHz data, we resolve the central structures of jet where three spatial peaks are discovered (Fig. 7; see van Ojik et al. 1996, for a comparison to 8 GHz). We note that a detailed radio analysis of 4C+03.24 is beyond the scope of this work and will be presented in Kukreti et al. (in prep.). We determine that the center one of these three peaks is the core, radio AGN, based on spectral slope (magenta star in Fig. 7). The coordinate of the radio core is given in Table 1 which is used for WCS alignment (Sect. 2.4).
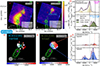 |
Fig. 7. Similar to Fig. 1, emission line maps and spectra of 4C+03.24 showing the [O III] companion search. The dashed contours in panel (a) show the optical continuum from NIRSpec IFU. We note that we mask the continuum from the foreground galaxy (blue dot, Appendix D.2). There are two [O III] Gaussian components that may be [O III] companions (panel c lower). We highlight them in dark green and black for the broad and narrow components, respectively. The fitted velocity maps of these two components of 4C03-[O III] are shown in panel (d) and panel (e) for the narrow and broad components, respectively. Example spectra at two spaxels are shown in panel (f) with the broad component highlighted in red and blue. |
4C+03.24 shows a complex warm ionized gas kinematics in the vicinity of its radio core. We focus on the most peculiar blob just to the north at dRG = 1.6 kpc but with a significant velocity shift, Δv ≃ 1300 km s−1 (precisely, Δv = 1395 ± 47 km s−1 using fitting results from Table B.1). This emission nebula, 4C03-[O III], is barely resolved (Fig. 7b). With q3dfit, we spectrally decompose it to a narrow and a broad component with σv = 55 ± 16 km s−1 and 574 ± 5 km s−1, respectively (Fig. 7c lower panel and Table B.1). Due to low S/N, the spatial velocity fitting of the 4C03-[O III] narrow component is noisy, as shown in Fig. 7d, but may show a tentative velocity gradient. The broad component of 4C03-[O III] shows a gradient along the southeast-northwest direction with Δv ∼ 500 km s−1. Both the kinematics and morphology of the 4C03-[O III] broad component are distinct from the bulk motion of ionized gas detected by SINFONI (Nesvadba et al. 2017a), indicating a different nature from the jet-driven outflow. Taking both the narrow and broad components into account, we may be witnessing a companion AGN in the vicinity of the central radio quasar. Indeed, the 15 GHz radio map shows a emission peak coincide with 4C03-[O III] northward of the radio core. This may further indicate that the presence of two radio AGN. Alternatively, this may suggest a strong jet gas interaction. 4C03-[O III] might be related to the previously published [C I] emission of 4C+03.24 (Δv[c I] = 1123 ± 282 km s−1, Kolwa et al. 2023).
We discovered three [C II] emitters despite the shallow ALMA observation. 4C03-[C II]-A is detected at 4σ and is located close to the radio core, dRG = 1.4 kpc. Since it is at the systemic redshift, 4C03-[C II]-A likely traces gas in the AGN host (Δv = 9 ± 17 km s−1, Figs. 8a and 8b). Base on the current dataset, we cannot exclude the possibility that 4C03-[C II]-A being a companion cloud system at projected distance near the core. 4C03-[C II]-B is at dRG = 15.8 kpc southeast of the radio core with Δv = −99 km s−1. The [O III] profile at the same position has an emission component consistent with the [C II] emission. 4C03-[C II]-B is diffuse, as indicated by the clumpy contours shown in Fig. 8a. 4C03-[C II]-C has an elongated morphology extended by ∼10 kpc located to the southeast of the radio core and with Δv = 342 km s−1. The [O III] profile at the same position does not show a clear similarity. This may be a disturbed gas system in the vicinity of the radio AGN. We note that the rough positions of 4C03-[C II]-B and [C II]-C are given as the centroid positions of the 5σ contour (Table 2).
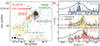 |
Fig. 8. Similar to Fig. 2, [C II] moment 0 maps and spectra of 4C03-[C II]. We note that 4C03-[C II]-A is at the radio core, whereas 4C03-[C II]-C is elongated, and its position, marked with a red open cross, is marked at its 5σ peak. We overlay the NIRSpec IFU continuum with dashed green contours (the same as in Fig. 7a), which may be the stellar tidal tail of a stripped companion galaxy. |
We show the optical continuum from NIRSpec IFU in Fig. 8a as dashed green contours. This continuum map is constructed by collapsing the cube in wavelength directions with strong emission lines masked. We further masked artifacts at detector edges, the foreground galaxy to the west, and identified MSA leakage contamination.
The optical continuum has a complex morphology which resembles a merger tidal tail. A similar morphology is also seen in UV continuum by MUSE (Fig. D.2 and also HST). Taking 4C03-[C II]-B and -[C II]-C into account, it is more likely that we are witnessing stars and gas stripped through merger processes at the center of 4C+03.24. 4C03-[O III] may also be in the same system. It has been known for decades that the southern radio jet of 4C+03.24 is bent (e.g., Fig. 7a; see also van Ojik et al. 1996). The hypothesis is that a dense system may exist in the south deflecting the jet. With our new ALMA+JWST data, we now confirm tidal structures to the south responsible for this deflection. A future paper will examine the jet-cloud interaction in further detail. The morphology of the extended continuum is similar to the [O III]5007 (Fig. 7a). This cautions that the continuum emission might be scattered AGN light rather than stellar emission.
4.4. Companion search of 4C+19.71
Wang et al. (2024) reported the detection of multiple emission components to the south of the radio core of 4C+19.71, providing evidence for companions (see their Fig. 1c2). We confirm this detection at dRG = 6.2 kpc south of the core, 4C19-[O III] (Fig. 9b). As seen in the aperture-extracted spectrum in Fig. 9c, there are three line emission components. The most blueshifted component, shown as the teal Gaussian, has a spatial extent of only ∼3 kpc and is likely the companion. Wang et al. (2024) suggested that the most redshifted component at the position of 4C19-[O III] as the receding emission from a rotating disk, with the most blueshifted one as the approaching side. After a spatial examination, we find that the two Gaussians redward of the teal Gaussian in Fig. 9c are spatially more diffuse and are likely to be ionized ISM associated with the radio AGN. Hence, we infer that only the most blueshifted teal Gaussian is from a potential companion, with Δv = −584 km s−1 and σv = 210 km s−1. In Fig. 9d, we map the velocity shift 4C19-[O III]. We do not detect a clear gradient, though Δv in the northern part of the blob shows evidence of being redshifted with respect to the southern part by ∼100 km s−1 (Fig. 9e).
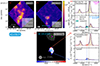 |
Fig. 9. Similar to Fig. 1, emission line maps and spectra of 4C+19.71 showing [O III] companion search. The fitted [O III] Gaussian component of 4C19-[O III] is highlighted in teal in panel (c). |
There is one bright [C II] emitter detected, 4C19-[C II] (Fig. 10). FIR continuum peaking at the same position is also detected (Figs. 9a and 9b). 4C19-[C II] is at a small projected distance from the radio core, dRG = 0.3 kpc (0.04″). We find that the [C II] and [O III] line profiles are different, as shown in Fig. 10b (offset ∼300 km s−1). Based on fitting of the 1D spectrum, [C II] is at Δv = −71 km s−1. This is more consistent with the redshift of the molecular gas ([C I]) than the warm ionized gas and suggests that the cold and warm gas are associated with two different systems (Falkendal et al. 2021; Kolwa et al. 2023). The absolute astrometric accuracy of ALMA can be estimated as posacc = beamFWHP/(S/N)/0.9 where beamFWHP is the Full Width Half Maximum synthesized beam size in arcseconds. With θ400 GHz = 0.23″ × 0.18″ and S/N = 13.3, the positional accuracy is ∼ 0.019″ ≃ dRG,4C19−[C II]/2. Assuming the errors are Gaussian distribution, the project distance is at 2σ away from the zero (i.e., the same position as the radio core) which implies that there is only a 5% probability that the dust is at the same position as the AGN. The probability can be even lower if we take the uncertainty of the radio position into consideration (∼θradio/10). In addition, there is no information on the line-of-sight separation. Hence, 4C19-[C II] might be a gas-rich companion in front of or behind the massive radio galaxy (e.g., Lin et al. 2025). We also model the [C II] emission with 3DBAROLO and find evidence of disk rotation (kinematic major axis along east-west with PA = 91°; Fig. 11 and Appendix C). Based on the residuals, we cannot rule out the possibility that the [C II] kinematics is disturbed by a jet-driven cocoon if they indeed belong to the same system (e.g., Mukherjee et al. 2016).
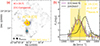 |
Fig. 10. Similar to Fig. 2, [C II] moment 0 map and spectrum of 4C19-[C II]. The right panel highlights the velocity difference between [C II] and [O III]. |
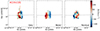 |
Fig. 11. Similar to Fig. 4, 3DBAROLO fit moment 1 maps of 4C19-[C II]. There is a Δv = −70 km s−1 offset between the zero velocity fitted by 3DBAROLO and zsys (Table 1). This is consistent with the single Gaussian fit (Table B.2). |
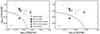 |
Fig. 12. Line ratio diagnostic diagrams for the individual kinetic components from the q3dfit 1D spectral fitting at the [O III] companion and radio core positions. We highlight the emission components of [O III] companions with larger symbols filled with same colors as used in Figs. 1c, 5c, 7c, and 9c. The other kinetic components at radio core and companion positions are shown with smaller gray stars and dots, respectively. The black curves are the empirical classifications that separate quiescent galaxies (lower left) from AGN (above this line) (Kewley et al. 2006). Typical errors are shown in the bottom left corner. |
5. Discussion
5.1. Companion kinematics and masses
Companions play an important role in galaxy evolution. In particular, nearby companion systems as detected in this work may be mergers which are key for both mass growth and triggering AGN (Springel et al. 2005; Hopkins et al. 2008b). The mass of a companion system is a crucial parameter. With our new observations, we offer a first order mass estimate. For this calculation, we ignore gravitational interactions between the companion and the central AGN.
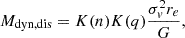
Most of the companions have large velocity dispersion, σv, which may indicate they are in dispersion dominated systems (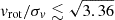 , where vrot is the rotation velocity, e.g., Förster Schreiber & Wuyts 2020, and see the fitting in Appendix B). Under this assumption, we estimated Mdyn following Übler et al. (2023):
 (1)
(1)
where G is the gravitational constant, re is the effective radius, K(n) = 8.87 − 0.831n + 0.0241n2 is a function of Sérsic index, n, and K(q) = [0.87 + 0.38e−3.71(1 − q)]2 is a function of axis ratio, q. For unresolved systems, we use the PSF or major synthesized beam size (or 2θ for J0205-[C II] and 4C03-[C II]) as a proxy for re. We stress that this mass estimate should be treated as an upper limit, as the size is overestimated. For Sérsic index we use n = 1 which gives an upper limit of Mdyn. For simplicity, we take q = 1. Equation (1) implies Mdyn, dis for the companions discovered in this work are approximately 1010 − 11 M⊙ (Table 2).
Alternatively, we can calculate the dynamical mass of the companion under the assumption of disk rotation using
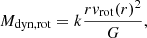 (2)
(2)
where vrot(r) is the circular rotation velocity, and k, the virial coefficient, is a function of n and q. We take k = 1.8 (e.g., de Graaff et al. 2024). For J0121-[C II]-B and 4C19-[C II], we obtain r and vrot from 3DBAROLO where the disk inclination angle, i, has been taken into account. Mdyn can be directly calculated for these two (Sects. 4.1 and 4.4). For the other fainter [C II] companions, we do not estimate a mass under the rotation scenario due to limited information. Warm ionized gas was also used to study regular dynamics (Übler et al. 2019; de Graaff et al. 2024). For the [O III] companions, we found tentative velocity gradients from q3dfit (Sect. 4). Assuming that these are rotating disks, we can perform the similar Mdyn estimation. Estimation of vrot for these [O III] companions is nontrivial given their marginally resolved spatial extents (except J0121-[O III]). Another uncertainty comes from their unknown inclination, i. Without further information, we use 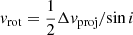 as a proxy for the rotation velocity where Δvproj is the projected velocity difference along the gradient and leaving sin i unconstrained (Nesvadba et al. 2011). Hence, the equation we use is
 (3)
(3)
where csc2 i = 1/sin2 i is left unconstrained. For the unresolved systems, we take the size of the NIRSpec IFU PSF, ∼0.11″, as the disk size, R, which is a lower limit. This simple estimation implies Mdyn, rot is around 109 − 10 M⊙ (Table 2).
As shown in Sect. 4.1 and Fig. 3, we estimate M⋆ estimation of J0121-[C II]-B to be 109.9 M⊙. This is the only companion where a zeroth order estimation could be done based on the continuum detected by NIRSpec IFU. By integrating along the wavelength direction of the NIRSpec IFU cube excluding strong emission lines, we find that the continuum of J0121-[C II]-B is detected at ∼8σ. This indicates that the 3σM⋆ detection limit in the cube is ∼109.5 M⊙ if optical continuum flux is directly proportional to stellar mass. Since our four radio AGN systems are at similar redshifts and observed with similar exposure times, this limit should be applicable to all four fields, with the caveat that the dust extinction of J0121-[C II]-B is high, implying the M⋆ detection upper limit may be lower if extinction is lower in the other fields. For J0121-[C II]-B, its Mdyn is around 1011 M⊙ which gives a M⋆/Mdyn ∼ 0.1. At high-z, we may find that galaxies with low M⋆ have high Mgas/Mdyn (Pillepich et al. 2019; de Graaff et al. 2024). Hence, the other companion systems may have low stellar mass (≲109.5 M⊙) and/or may be extremely gas-rich (or pure gas cloud systems).
Despite the large uncertainties in mass estimates, we inferred that the companions discovered here are a few percent of the central host galaxies of the radio AGN (M⋆ ≳ 1011 M⊙Seymour et al. 2007; De Breuck et al. 2010; Falkendal et al. 2019; Wang et al. 2021). If they go through mergers, they will be the minor mergers that are critical for the hierarchal growth of clusters (Moster et al. 2018). Despite previous environmental studies on cluster scales around larger sample of HzRGs which proves their proto-cluster natures (e.g., Venemans et al. 2007; Wylezalek et al. 2013, 2014), there is no clear evidence that the four HzRGs studied here live in dense environments. Our observations bring new information on 5 to 20 kpc scales and suggest the existence of Mdyn ∼ 1010 M⊙ systems around these four radio galaxies. Given that the detection presented in this work is not complete, the number of companion systems could be higher. If these companions will merge with the central mass galaxies, we are observing the forming progenitors of ≳1012 − 13 M⊙ halos, traced by radio AGN beyond cosmic noon (an estimate using M⋆/Mhalo ∼ 0.01 − 0.1, e.g., Behroozi et al. 2010, 2019). The detection rate of companions in our randomly selected sample is 100%. As a rough first order estimate, the major merger fraction in our four-source sample is fMM ∼ 25%, since 4C03 may be a potential major merger.
The discussion above ignores the gravitational impact from the central AGN. At the physical scales probed in this paper, it is very likely that these companion systems are disturbed in the potential well. Supporting this, the residuals from 3DBAROLO fitting of J0121-[C II]-B and 4C19-[C II] indicate the existence of complex gas motions.
5.2. Nature of [O III] companions
Unlike [C II] companions indicating cold gas systems, the nature of [O III] companions is often elusive in the vicinity of luminous quasars with Lbol ≳ 1047 erg s−1 (Falkendal et al. 2019). [O III] emission with complex features are discovered in bright z ∼ 0.5 type-2 AGN, which has been interpreted as debris from mergers (e.g., Lbol∼46 erg s−1, Storchi-Bergmann et al. 2018; Dall’Agnol de Oliveira et al. 2021). Our detection criteria for [O III] companions require peculiar kinematics distinct from the bulk motion of the warm ionized gas (Nesvadba et al. 2017a). As a first order check of the ionizing mechanism, we investigate line ratio diagnostics based on our 1D spectral fitting (Sect. 3, Kewley et al. 2001, 2006). We use both the [O III]/Hβ-[N II]/Hα and [O III]/Hβ-[S II]/Hα diagnostics. The line fluxes are corrected for extinction using Balmer decrement by adopting the canonical value of FHα/FHβ = 3.1 assuming Case B recombination (Veilleux & Osterbrock 1987; Osterbrock & Ferland 2006). The results are shown in Fig. 12. Simply assuming the Kewley et al. (2006) empirical classification, we conclude that all but one [O III] companion are photonionized by an AGN. Within the uncertainties of the line fitting and classification, the narrow component of 4C03-[O III] is also consistent with AGN photoionization. One immediate conclusion is that these emission components are indeed in the vicinity of powerful AGN, particularly J0205-[O III] and 4C03-[O III] with |Δv|∼1000 km s−1.
Except for J0121-[O III] whose morphology, kinematics, and [C II] detection make it a solid companion detection, we cannot rule out that the candidates are part of the outflows. Though they are all detected along the jet axis, the PA of tentative velocity gradients are not always clearly correlated with the jet axis, which may support them being companions. The relatively large |Δv|∼1000 km s−1 between these companions and the radio AGN may be expected, which is consistent with the velocity range of companion motions in clusters (e.g., Bahcall et al. 1994). Hence, a possible scenario could be that there are more of these gaseous companion systems moving randomly in the potential well of the proto-cluster centered around the radio AGN. In this scenario, the detected companions that happen to fall in the ionization cone are photoionized and therefore detected (i.e., the jet axis traces the direction of the ionization cone, Drouart et al. 2012). Another scenario could be that the [O III] blobs originated from gas stripped from companions in a previous (or ongoing) interaction, and is now being illuminated by the AGN (e.g., 4C03-[O III]).
We do not intend to be complete in companion detection in this paper but offer a possible explanation of these unresolved emission blobs with peculiar kinematics. We acknowledge that the [O III] companions are clumps accelerated or illuminated by the AGN but may not in themselves be stellar systems (Sect. 3).
5.3. Impact on galaxy evolution
There is no clear agreement on how powerful AGN jets are triggered in the early Universe. Merger processes provide one possibility (e.g., Chiaberge et al. 2015), though the confirmation of mergers and/or interactions is nontrivial without 3D information. In this work, we discover that the companions have a median dRG ≃ 7 kpc. Using a typical Δv of ∼100 − 500 km s−1 and assuming no projection, the zeroth order estimate of encounter time is around 10–100 Myr (i.e., dRG/Δv). Assuming the companions are in the post-encounter phase (i.e., after the first pericenter passage), this timescale is consistent with the observed time after jet launch (e.g., Nesvadba et al. 2017a,b). This supports the merger trigger scenario for jets.
Our detections show that there are gaseous clouds at ≲18 kpc from these four HzRGs. With resolution limited observations, Falkendal et al. (2019) and Kolwa et al. (2023) reported that gas in radio AGN hosts should be relatively depleted. Taking this into account, our work may support the scenario that gas, if not completely depleted, is located in nearby systems rather than in the AGN hosts. This is consistent with literature studies of high-z radio AGN, which show that gas-rich systems are present in the vicinity of massive host galaxies (e.g., Emonts et al. 2015; Lin et al. 2025; Huang et al. 2024). Our work may show evidence of how these mergers with high gas content evolve in the radiation field of AGN and contribute to the growth of mass of the system. Lehnert et al. (2016) predicted that z ∼ 2 − 4 galaxies are gas-rich (i.e., with H I). These galaxies with M⋆ ∼ 108 − 9 M⊙ are important for mass growth through minor merger processes. That is to say, gas-rich mergers such as the ones discovered in this paper bring fuel that feeds central SMBHs and lead to AGN ignition. Besides bringing gas within tens of kiloparsec scales, the disruption from these nearby companions plays an important role in dissipating angular momentum and accelerating gas accretion.
Apart from triggering AGN activity, companions could alter jet development. TN J0121+1320 is the only HzRG in our sample with a compact jet (at 0.3″ resolution). All three of its companions are to the west of the radio source. Dust is also detected at the same location as the dense environment. Hence, we infer that interaction of the jet with the dense medium disturbs the jet propagation, making the jet flow more turbulent and the emission more diffuse, thus also reducing its surface brightness. Furthermore, the dense environment may even cause the jet of TN J0121+1320 to fail in penetrating through the medium, resulting in its observed compact morphology despite being one of the most luminous radio sources (L500 MHz = 28.49 W Hz−1, De Breuck et al. 2010). The case of 4C+03.24 may be a prototypical example. It has gone through a merger phase during which gas (4C03-[C II]-B and -[C II]-C) and stars (continuum) were stripped. This merger process triggered the radio jet, which is then deflected by debris to the south.
We consider how radio selection effects may cause companions to be identified in particular phases. Emonts et al. (2023b) examined the correlation between radio axis and gas clouds or mergers and showed that the radio asymmetries (e.g., radio flux ratios) can be attributable to interactions with gas in the CGM. Our work on smaller scales similarly suggests that the gaseous systems deflect or disturb jets, resulting in asymmetry, for example, by brightening radio fluxes. This means that flux-limited radio surveys will preferentially detect radio galaxies that are interacting because this resistance causes the synchrotron emissivity to increase by driving shocks into the relativistic plasma (increasing the density of field lines and of radiating particles; see also, e.g., Steffen et al. 1997; Villar-Martín et al. 1999; Best et al. 1998; Gómez et al. 2006; Anderson et al. 2022; Jerrim et al. 2024).
6. Conclusion
We have presented the first analysis of the resolution-matched joint JWST/NIRSpec IFU and ALMA observations of a sample of four HzRGs at z ≈ 3.5. We focused on [O III]5007 and [C II] emitters detected by ALMA and JWST (Sect. 3) and reported the ubiquitous discovery of companion systems within ∼18 kpc of the powerful radio AGN using these two independent methods.
Specifically, we examined the 1D spectra at the positions of companions and quantified the gas kinematics (Δv and σv). For [O III] companions (Sect. 3.1), we mapped the gas kinematics with q3dfit. We discovered velocity gradients showing different motions than the bulk of the ionized gas. For the two [C II] companions detected at high S/N (J0121-[C II]-B and 4C19-[C II] with S/N > 10), we performed 3DBAROLO fits and detected disk rotation with residuals suggesting more chaotic underlying motions (Sect. 3.2).
We discussed individual companions in Sect. 4. First-order dynamical mass estimates derived from the gas kinematics imply a range of 109 − 11 M⊙, suggesting a possible minor merger with the central radio AGN host galaxy (Sect. 5.1). We further discussed the nature of [O III] companions in Sect. 5.2, which indicate AGN photoionized gaseous clouds that happen to be within the ionization cone, though we cannot rule out the possibility that they are part of an AGN outflow. Finally, we discussed that the companions could trigger the launch of a jet by supplying gas and dissipating angular momentum. These companion systems can also alter the jet development. This further suggests that these relatively minor companions play an important role in the evolution of massive systems.
The matched resolution JWST and ALMA data are very rich, and more detailed continuum and emission line studies are in preparation to decipher these complex systems. These investigations are critical to understanding the AGN feedback, star formation quenching, and mass growth of massive systems in the early Universe.
Acknowledgments
We thank the anonymous referee for their valuable comments and suggestions, which have improved the quality of this manuscript. This work uses the NASA’s Astrophysics Data System and a number of open source software other than the aforementioned ones such as Jupyter notebook (Kluyver et al. 2016); matplotlib (Hunter 2007); SciPy (Virtanen et al. 2020); NumPy (Harris et al. 2020); Astropy (Astropy Collaboration 2018); LMFIT (Newville et al. 2016). We thank Hannah Übler for the discussion of ionized gas kinematics. We thank Yechi Zhang for the discussion of modeling optical stellar continuum. This publication has received funding from the European Union’s Horizon 2020 research and innovation programme under grant agreement No 101004719 (ORP). This work is based in part on observations made with the NASA/ESA/CSA James Webb Space Telescope. The data were obtained from the Mikulski Archive for Space Telescopes at the Space Telescope Science Institute, which is operated by the Association of Universities for Research in Astronomy, Inc., under NASA contract NAS 5-03127 for JWST. These observations are associated with program JWST-GO-01970. Support for program JWST-GO-01970 was provided by NASA through a grant from the Space Telescope Science Institute, which is operated by the Association of Universities for Research in Astronomy, Inc., under NASA contract NAS 5-03127. D.W. and W.W. acknowledge support through an Emmy Noether Grant of the German Research Foundation, a stipend by the Daimler and Benz Foundation and the MERAC foundation and a Verbundforschung grant by the German Space Agency. W.W. also acknowledges the grant support from NASA through JWST-GO-3045 and JWST-GO-3950. The work of D.S. was carried out at the Jet Propulsion Laboratory, California Institute of Technology, under a contract with NASA. B. D. O. acknowledges the support from the Coordenação de Aperfeiçoamento de Pessoal de Nível Superior (CAPES-Brasil, 88887.985730/2024-00). This paper makes use of the following ALMA data: ADS/JAO.ALMA#2021.1.00576.S. ALMA is a partnership of ESO (representing its member states), NSF (USA) and NINS (Japan), together with NRC (Canada), MOST and ASIAA (Taiwan), and KASI (Republic of Korea), in cooperation with the Republic of Chile. The Joint ALMA Observatory is operated by ESO, AUI/NRAO and NAOJ.
References
- Anderson, C. S., Carilli, C. L., Tozzi, P., et al. 2022, ApJ, 937, 45 [NASA ADS] [CrossRef] [Google Scholar]
- Astropy Collaboration (Price-Whelan, A. M., et al.) 2018, AJ, 156, 123 [Google Scholar]
- Bahcall, N. A., Gramann, M., & Cen, R. 1994, ApJ, 436, 23 [NASA ADS] [CrossRef] [Google Scholar]
- Behroozi, P. S., Conroy, C., & Wechsler, R. H. 2010, ApJ, 717, 379 [Google Scholar]
- Behroozi, P., Wechsler, R. H., Hearin, A. P., & Conroy, C. 2019, MNRAS, 488, 3143 [NASA ADS] [CrossRef] [Google Scholar]
- Best, P. N., Carilli, C. L., Garrington, S. T., Longair, M. S., & Rottgering, H. J. A. 1998, MNRAS, 299, 357 [NASA ADS] [CrossRef] [Google Scholar]
- Calzetti, D., Armus, L., Bohlin, R. C., et al. 2000, ApJ, 533, 682 [NASA ADS] [CrossRef] [Google Scholar]
- Carnall, A. C., McLure, R. J., Dunlop, J. S., & Davé, R. 2018, MNRAS, 480, 4379 [Google Scholar]
- CASA Team, Bean, B., Bhatnagar, S., et al. 2022, PASP, 134, 114501 [NASA ADS] [CrossRef] [Google Scholar]
- Chiaberge, M., Gilli, R., Lotz, J. M., & Norman, C. 2015, ApJ, 806, 147 [NASA ADS] [CrossRef] [Google Scholar]
- Dall’Agnol de Oliveira, B., Storchi-Bergmann, T., Kraemer, S. B., et al. 2021, MNRAS, 504, 3890 [CrossRef] [Google Scholar]
- Dalmasso, N., Calabrò, A., Leethochawalit, N., et al. 2024, MNRAS, 533, 4472 [NASA ADS] [CrossRef] [Google Scholar]
- De Breuck, C., van Breugel, W., Stanford, S. A., et al. 2002, AJ, 123, 637 [NASA ADS] [CrossRef] [Google Scholar]
- De Breuck, C., Seymour, N., Stern, D., et al. 2010, ApJ, 725, 36 [NASA ADS] [CrossRef] [Google Scholar]
- de Graaff, A., Rix, H.-W., Carniani, S., et al. 2024, A&A, 684, A87 [NASA ADS] [CrossRef] [EDP Sciences] [Google Scholar]
- Dessauges-Zavadsky, M., Ginolfi, M., Pozzi, F., et al. 2020, A&A, 643, A5 [NASA ADS] [CrossRef] [EDP Sciences] [Google Scholar]
- Di Teodoro, E. M., & Fraternali, F. 2015, MNRAS, 451, 3021 [Google Scholar]
- Drouart, G., De Breuck, C., Vernet, J., et al. 2012, A&A, 548, A45 [NASA ADS] [CrossRef] [EDP Sciences] [Google Scholar]
- Duncan, K. J., Windhorst, R. A., Koekemoer, A. M., et al. 2023, MNRAS, 522, 4548 [NASA ADS] [CrossRef] [Google Scholar]
- Emonts, B. H. C., De Breuck, C., Lehnert, M. D., et al. 2015, A&A, 584, A99 [NASA ADS] [CrossRef] [EDP Sciences] [Google Scholar]
- Emonts, B. H. C., Lehnert, M. D., Yoon, I., et al. 2023a, Science, 379, 1323 [NASA ADS] [CrossRef] [Google Scholar]
- Emonts, B. H. C., Lehnert, M. D., Lebowitz, S., et al. 2023b, ApJ, 952, 148 [Google Scholar]
- Faisst, A. L., Schaerer, D., Lemaux, B. C., et al. 2020, ApJS, 247, 61 [NASA ADS] [CrossRef] [Google Scholar]
- Falkendal, T., De Breuck, C., Lehnert, M. D., et al. 2019, A&A, 621, A27 [NASA ADS] [CrossRef] [EDP Sciences] [Google Scholar]
- Falkendal, T., Lehnert, M. D., Vernet, J., De Breuck, C., & Wang, W. 2021, A&A, 645, A120 [NASA ADS] [CrossRef] [EDP Sciences] [Google Scholar]
- Förster Schreiber, N. M., & Wuyts, S. 2020, ARA&A, 58, 661 [Google Scholar]
- Galametz, A., Stern, D., De Breuck, C., et al. 2012, ApJ, 749, 169 [NASA ADS] [CrossRef] [Google Scholar]
- Gómez, J. L., Marscher, A. P., Jorstad, S. G., & Agudo, I. 2006, Astron. Nachr., 327, 223 [Google Scholar]
- Greisen, E. W. 2003 Astrophys. Space Sci. Lib., 285, 109 [NASA ADS] [Google Scholar]
- Gupta, A., Jaiswar, R., Rodriguez-Gomez, V., et al. 2023, ApJ, 957, L35 [Google Scholar]
- Harris, C. R., Millman, K. J., van der Walt, S. J., et al. 2020, Nature, 585, 357 [NASA ADS] [CrossRef] [Google Scholar]
- Harrison, C. M., Alexander, D. M., Mullaney, J. R., & Swinbank, A. M. 2014, MNRAS, 441, 3306 [Google Scholar]
- Heckman, T. M., & Best, P. N. 2014, ARA&A, 52, 589 [Google Scholar]
- Herrera-Camus, R., Förster Schreiber, N. M., Price, S. H., et al. 2022, A&A, 665, L8 [NASA ADS] [CrossRef] [EDP Sciences] [Google Scholar]
- Holden, L. R., & Tadhunter, C. N. 2025, MNRAS, 536, 1857 [Google Scholar]
- Hopkins, P. F., Cox, T. J., Kereš, D., & Hernquist, L. 2008a, ApJS, 175, 390 [Google Scholar]
- Hopkins, P. F., Hernquist, L., Cox, T. J., & Kereš, D. 2008b, ApJS, 175, 356 [Google Scholar]
- Huang, H.-T., Man, A. W. S., Lelli, F., et al. 2024, ApJ, 977, 251 [NASA ADS] [CrossRef] [Google Scholar]
- Hunter, J. D. 2007, Comput. Sci. Eng., 9, 90 [NASA ADS] [CrossRef] [Google Scholar]
- Huško, F., Lacey, C. G., & Baugh, C. M. 2022, MNRAS, 509, 5918 [Google Scholar]
- Ivison, R. J., Smail, I., Amblard, A., et al. 2012, MNRAS, 425, 1320 [NASA ADS] [CrossRef] [Google Scholar]
- Jerrim, L. A., Shabala, S. S., Yates-Jones, P. M., et al. 2024, MNRAS, 531, 2532 [Google Scholar]
- Jones, G. C., Übler, H., Perna, M., et al. 2024, A&A, 682, A122 [NASA ADS] [CrossRef] [EDP Sciences] [Google Scholar]
- Kewley, L. J., Dopita, M. A., Sutherland, R. S., Heisler, C. A., & Trevena, J. 2001, ApJ, 556, 121 [Google Scholar]
- Kewley, L. J., Groves, B., Kauffmann, G., & Heckman, T. 2006, MNRAS, 372, 961 [Google Scholar]
- Kluyver, T., Ragan-Kelley, B., Pérez, F., et al. 2016, in Positioning and Power in Academic Publishing: Players, Agents and Agendas, eds. F. Loizides, & B. Schmidt (IOS Press), 87 [Google Scholar]
- Kolwa, S., De Breuck, C., Vernet, J., et al. 2023, MNRAS, 525, 5831 [NASA ADS] [CrossRef] [Google Scholar]
- Lagache, G., Cousin, M., & Chatzikos, M. 2018, A&A, 609, A130 [NASA ADS] [CrossRef] [EDP Sciences] [Google Scholar]
- Lebowitz, S., Emonts, B., Terndrup, D. M., et al. 2023, ApJ, 951, 73 [NASA ADS] [CrossRef] [Google Scholar]
- Lehnert, M. D., van Driel, W., & Minchin, R. 2016, A&A, 590, A51 [NASA ADS] [CrossRef] [EDP Sciences] [Google Scholar]
- Lelli, F., Di Teodoro, E. M., Fraternali, F., et al. 2021, Science, 371, 713 [Google Scholar]
- Lin, L., Lelli, F., De Breuck, C., et al. 2025, A&A, 693, A91 [NASA ADS] [CrossRef] [EDP Sciences] [Google Scholar]
- Madau, P., & Dickinson, M. 2014, ARA&A, 52, 415 [Google Scholar]
- Miley, G., & De Breuck, C. 2008, A&ARv, 15, 67 [Google Scholar]
- Moster, B. P., Naab, T., & White, S. D. M. 2018, MNRAS, 477, 1822 [Google Scholar]
- Mukherjee, D., Bicknell, G. V., Sutherland, R., & Wagner, A. 2016, MNRAS, 461, 967 [NASA ADS] [CrossRef] [Google Scholar]
- Nesvadba, N. P. H., Lehnert, M. D., De Breuck, C., Gilbert, A., & van Breugel, W. 2007, A&A, 475, 145 [NASA ADS] [CrossRef] [EDP Sciences] [Google Scholar]
- Nesvadba, N. P. H., Boulanger, F., Lehnert, M. D., Guillard, P., & Salome, P. 2011, A&A, 536, L5 [NASA ADS] [CrossRef] [EDP Sciences] [Google Scholar]
- Nesvadba, N. P. H., De Breuck, C., Lehnert, M. D., Best, P. N., & Collet, C. 2017a, A&A, 599, A123 [NASA ADS] [CrossRef] [EDP Sciences] [Google Scholar]
- Nesvadba, N. P. H., Drouart, G., De Breuck, C., et al. 2017b, A&A, 600, A121 [NASA ADS] [CrossRef] [EDP Sciences] [Google Scholar]
- Newville, M., Stensitzki, T., Allen, D. B., et al. 2016, Astrophysics Source Code Library [record ascl:1606.014] [Google Scholar]
- Noirot, G., Vernet, J., De Breuck, C., et al. 2016, ApJ, 830, 90 [CrossRef] [Google Scholar]
- Noirot, G., Stern, D., Mei, S., et al. 2018, ApJ, 859, 38 [NASA ADS] [CrossRef] [Google Scholar]
- Ondaro-Mallea, L., Angulo, R. E., Aricò, G., et al. 2024, A&A, submitted [arXiv:2412.09526] [Google Scholar]
- Osterbrock, D. E., & Ferland, G. J. 2006, Astrophysics of gaseous nebulae and active galactic nuclei, 2nd edn. (Sausalito, CA: University Science Books) [Google Scholar]
- Pentericci, L., Röttgering, H. J. A., Miley, G. K., et al. 1999, A&A, 341, 329 [NASA ADS] [Google Scholar]
- Pérez-Martínez, J. M., Dannerbauer, H., Koyama, Y., et al. 2024, ApJ, 977, 74 [Google Scholar]
- Perley, R. A., & Butler, B. J. 2017, ApJS, 230, 7 [NASA ADS] [CrossRef] [Google Scholar]
- Perna, M., Arribas, S., Marshall, M., et al. 2023, A&A, 679, A89 [NASA ADS] [CrossRef] [EDP Sciences] [Google Scholar]
- Pierce, J. C. S., Tadhunter, C., Ramos Almeida, C., et al. 2023, MNRAS, 522, 1736 [NASA ADS] [CrossRef] [Google Scholar]
- Pillepich, A., Nelson, D., Springel, V., et al. 2019, MNRAS, 490, 3196 [Google Scholar]
- Rocca-Volmerange, B., Drouart, G., De Breuck, C., et al. 2013, MNRAS, 429, 2780 [NASA ADS] [CrossRef] [Google Scholar]
- Romano, M., Cassata, P., Morselli, L., et al. 2021, A&A, 653, A111 [NASA ADS] [CrossRef] [EDP Sciences] [Google Scholar]
- Roy, N., Heckman, T., Overzier, R., et al. 2024, ApJ, 970, 69 [NASA ADS] [CrossRef] [Google Scholar]
- Rupke, D., Wylezalek, D., Zakamska, N., et al. 2023, Astrophysics Source Code Library [record ascl:2310.004] [Google Scholar]
- Sanders, R. L., Shapley, A. E., Kriek, M., et al. 2016, ApJ, 816, 23 [Google Scholar]
- Saxena, A., Overzier, R. A., Villar-Martín, M., et al. 2024, MNRAS, 531, 4391 [CrossRef] [Google Scholar]
- Seymour, N., Stern, D., De Breuck, C., et al. 2007, ApJS, 171, 353 [CrossRef] [Google Scholar]
- Shimakawa, R., Pérez-Martínez, J. M., Dannerbauer, H., et al. 2024, ApJ, 977, 73 [NASA ADS] [Google Scholar]
- Springel, V., White, S. D. M., Jenkins, A., et al. 2005, Nature, 435, 629 [Google Scholar]
- Steffen, W., Gómez, J. L., Raga, A. C., & Williams, R. J. R. 1997, ApJ, 491, L73 [Google Scholar]
- Storchi-Bergmann, T., Dall’Agnol de Oliveira, B., Longo Micchi, L. F., et al. 2018, ApJ, 868, 14 [Google Scholar]
- Suzuki, T. L., Glazebrook, K., Schreiber, C., et al. 2022, ApJ, 936, 61 [Google Scholar]
- Übler, H., Genzel, R., Wisnioski, E., et al. 2019, ApJ, 880, 48 [Google Scholar]
- Übler, H., Maiolino, R., Curtis-Lake, E., et al. 2023, A&A, 677, A145 [NASA ADS] [CrossRef] [EDP Sciences] [Google Scholar]
- van Ojik, R., Roettgering, H. J. A., Carilli, C. L., et al. 1996, A&A, 313, 25 [NASA ADS] [Google Scholar]
- Vayner, A., Zakamska, N. L., Ishikawa, Y., et al. 2023, ApJ, 955, 92 [NASA ADS] [CrossRef] [Google Scholar]
- Vayner, A., Zakamska, N. L., Ishikawa, Y., et al. 2024a, ApJ, 960, 126 [NASA ADS] [CrossRef] [Google Scholar]
- Vayner, A., Díaz-Santos, T., Eisenhardt, P. R. M., et al. 2024b, ApJ, submitted [arXiv:2412.02862] [Google Scholar]
- Veilleux, S., & Osterbrock, D. E. 1987, ApJS, 63, 295 [Google Scholar]
- Venemans, B. P., Röttgering, H. J. A., Miley, G. K., et al. 2007, A&A, 461, 823 [NASA ADS] [CrossRef] [EDP Sciences] [Google Scholar]
- Vernet, J., Fosbury, R. A. E., Villar-Martín, M., et al. 2001, A&A, 366, 7 [NASA ADS] [CrossRef] [EDP Sciences] [Google Scholar]
- Vernet, J., Lehnert, M. D., De Breuck, C., et al. 2017, A&A, 602, L6 [NASA ADS] [CrossRef] [EDP Sciences] [Google Scholar]
- Villar-Martín, M., Tadhunter, C., Morganti, R., Axon, D., & Koekemoer, A. 1999, MNRAS, 307, 24 [CrossRef] [Google Scholar]
- Virtanen, P., Gommers, R., Oliphant, T. E., et al. 2020, Nat. Methods, 17, 261 [Google Scholar]
- Wang, W., Wylezalek, D., De Breuck, C., et al. 2021, A&A, 654, A88 [NASA ADS] [CrossRef] [EDP Sciences] [Google Scholar]
- Wang, W., Wylezalek, D., Vernet, J., et al. 2023, A&A, 680, A70 [NASA ADS] [CrossRef] [EDP Sciences] [Google Scholar]
- Wang, W., Wylezalek, D., De Breuck, C., et al. 2024, A&A, 683, A169 [NASA ADS] [CrossRef] [EDP Sciences] [Google Scholar]
- Wylezalek, D., Galametz, A., Stern, D., et al. 2013, ApJ, 769, 79 [NASA ADS] [CrossRef] [Google Scholar]
- Wylezalek, D., Vernet, J., De Breuck, C., et al. 2014, ApJ, 786, 17 [NASA ADS] [CrossRef] [Google Scholar]
- Wylezalek, D., Vayner, A., Rupke, D. S. N., et al. 2022, ApJ, 940, L7 [NASA ADS] [CrossRef] [Google Scholar]
- Zakamska, N. L., Strauss, M. A., Krolik, J. H., et al. 2003, AJ, 126, 2125 [NASA ADS] [CrossRef] [Google Scholar]
- Zhong, Y., Inoue, A. K., Sugahara, Y., et al. 2024, MNRAS, 529, 4531 [NASA ADS] [CrossRef] [Google Scholar]
Appendix A: [O III]5007 channel maps
We present the [O III]5007 channel maps in this section. The channel maps are constructed from continuum subtracted NIRSpec IFU data cubes. Each map is collapsed from three consecutive channels. The maps shown in Fig. A.1, A.2, A.3, and A.4 are for TN J0121+1320, TN J0205+2242, 4C+03.24, and 4C+19.71, respectively.
 |
Fig. A.1. [O III]5007 channel maps for TN J0121+1320. We overlay the radio contours in green. The positions of [O III] (blue triangle) and [C II] (red square) companions are shown. |
 |
Fig. A.2. Similar to Fig. A.1, [O III]5007 channel maps for TN J0205+2242. We note that there are some bad pixels in channels −860 and −702 km s−1. |
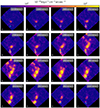
Appendix B: One-dimensional emission line fitting results
The fitted parameters of the 1D spectra are given in this section. For the warm ionized gas spectra extracted from the NIRSpec IFU, we present the redshifts and line widths for each Gaussian component in Table B.1. The fitted results of 1D [C II] spectra are presented in Table B.2.
Ionized gas kinematics from the 1D spectra extracted at the positions of the radio core and [O III] companions.
Fitting results of 1D [C II] spectra.
Appendix C: 3DBAROLO fit of [C II]
We use 3DBAROLO to fit the two bright [C II] companions, J0121-[C II]-B and 4C19-[C II]. In 3DBarolo, a rotating galaxy disk is modeled with a set of tilted rings. Each ring is parametrized by five geometric parameters — center coordinates (x0, y0), systemic velocity (vsys), position angle (PA, measured anti-clockwise from the North), and inclination (i) — and five physical parameters — rotation velocity (vrot), radial velocity (vrad), velocity dispersion (σv), surface density (Σgas), and vertical thickness (z0). The separation between rings is set to half the width of beam major axis by default. We note that there are no constraints on the initial guesses for PA and i. The fit is performed using values obtained from a visual inspection.
We initially perform the fit on cubes at the original resolution of 14 km s−1, which leads to poorer constraints on the parameters. To mitigate this, we apply spectral smoothing to the cubes, aiming to enhance the S/N at the expense of spectral resolution. For J0121-[C II]-B, the [C II] cube is smoothed to a velocity resolution of 28 km s−1. The initial values of PA and i are set to 193° and 60°. They are allowed to vary by ±15°. The initial values of σv is by default 8 km s−1. We set NORM=AZIM so that the observed moment-0 map is azimuthally averaged to obtain Σgas of each ring in the model. Initial value of other parameters are guessed by 3DBAROLO. The center coordinates (x0, y0) are fixed to the initial guess. Then, the free parameters to be minimized are vsys, PA, i, vrot, and σv. For 4C19-[C II], the [C II] cube is also smoothed to a velocity resolution of 28 km s−1. The initial values of PA and i are 100° and 10°. They are allowed to vary by ±15° and ±30°, respectively. The 3DBAROLO fit is performed in two steps. First, all free parameters are fitted. Then, the geometric parameters are fixed while only vrot and σv were fitted.
We show the fitted maps moment 0 (intensity) and moment 2 (velocity dispersion) maps in Fig. C.1 and C.2 for the two companions. In addition, we also present the position velocity diagrams from 3DBAROLO along the kinematic major axis in Fig. C.3 and C.4 for the two companions. We report that the best fits of J0121-[C II]-B PA and i are 187° and 61°, respectively. The best fits of 4C19-[C II] PA and i are 93° and 30°, respectively. We note that the i fit of 4C19-[C II] is limited by angular resolution and should be treated with caution.
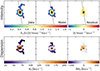 |
Fig. C.1. 3DBAROLO moment 0 (intensity) and moment 2 (velocity dispersion) maps of J0121-[C II]-B. |
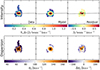 |
Fig. C.2. 3DBAROLO moment 0 (intensity) and moment 2 (velocity dispersion) maps of 4C19-[C II]. |
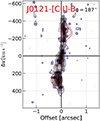 |
Fig. C.3. Position velocity diagram of J0121-[C II]-B from 3DBAROLO along kinematic major axis (black dashed line in Fig. 4). The gray scale maps and blue contours show the data. Red contours show the model. |
Appendix D: Foreground detection
D.1. Foreground cluster in the field of TN J0121+1320
We detect a foreground galaxy at z = 1.4577 in the field of TN J0121+1320 using the NIRSpec IFU data. The continuum emission of this foreground galaxy may contaminate the continuum of TN J0121+1320 given its small spatial offset, ∼0.1″ (0.85 kpc), from the line emission peak. This galaxy likely belongs to a cluster. Its [O II]3726, 3729 doublet is covered by MUSE (FoV of 1′×1′). We present the continuum-subtracted MUSE narrow band image integrated from −200 to 200 km s−1 around [O II]3729 in Fig. D.1. There are at least two additional [O II]3726, 3729 emitters at similar redshift within 10″ (∼84.5 kpc) of the one covered in the NIRSpec IFU FoV. We mark the positions of these two [O II]3726, 3729 emitters and name them GN and GS for the one in the north and south, respectively. In addition to [O II]3726, 3729, we also detect [S III]9533, He I10833 and Paβ at the same redshift and position as the foreground galaxy using NIRSpec IFU. These assure the redshift of this foreground galaxy. The spectra are shown in Fig. D.1. The spatial position of the foreground cluster and its redshift may lead to magnification and/or distortion of the emission from TN J0121+1320 by gravitational lensing.
D.2. 4C+03.24
We report a potential foreground galaxy in the field of 4C+03.24. This galaxy is covered at the edge of the NIRSpec IFU FoV. We did not find any emission lines in the NIRSpec IFU data cube and note that analysis of SINFONI data assumed it to be a star (Nesvadba et al. 2017a). At the same position in MUSE data cube, we detect both an emission line and continuum (Fig. D.2). With only a single line detected, the redshift is uncertain. If we assume it to be redshifted [O II]3726, 3729, the redshift is z ∼ 0.7384. The projected distance between the radio core of 4C+03.24 and this potential foreground object is 0.58″, implying the possibility of gravitational lensing.
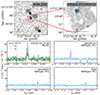 |
Fig. D.1. Narrow-band emission line images and spectra of the foreground galaxies in the field of TN J0121+1320. Upper left: Narrow-band image of [O II]3726, 3729 at z = 1.4577 integrated from MUSE data cube. We mark the positions of the two [O II] emitters outside the NIRSpec IFU FoV in green and orange, respectively. The blue circle indicates the r = 0.25″ aperture used to extract the foreground galaxy (FG) in the NIRSpec IFU data. It is centered (blue dot) at the spatial position of the emission lines (Sect. 4.1) of FG, as in Fig. 1. The red box shows the FoV of the NIRSpec IFU. Upper right: Narrow-band image of [S III]9533 at z = 1.4577 observed by NIRSpec IFU. The blue dot and circle are the same as in the upper left panel. Middle and lower rows: Spectra extracted at the position of the FG in blue. We also show MUSE spectra of the two [O II] emitters in green and orange, respectively. |
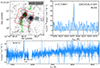 |
Fig. D.2. MUSE continuum image and spectra of foreground galaxy in the field of 4C+03.24. Upper left: Continuum image extracted from MUSE cube around 7250 Å. The blue dot marks the position of the potential foreground continuum source. The blue circle shows the r = 0.25″ aperture from which the spectrum was extracted. The red box indicates the NIRSpec IFU FoV. The green contours are same radio map as in Fig. 7. The dashed red contours are the same NIRSpec IFU optical continuum as in Fig. 7. Lower panel: Full MUSE spectrum extracted at the foreground galaxy position with a focus on the continuum. The red dotted vertical line indicates Lyα from 4C+03.24. The vertical gray dashed lines mark the zoom-in region around the emission line of the foreground galaxy. Upper right: Zoom-in view of the potential foreground [O II]3726, 3729 line. |
All Tables
Ionized gas kinematics from the 1D spectra extracted at the positions of the radio core and [O III] companions.
All Figures
|
Fig. 1. Emission line maps and spectra of TN J0121+1320 showing the [O III] companion search. (a, b): [O III]5007 channel maps. Each map is integrated over three consecutive wavelength channels (i.e., ∼150 km s−1). The central velocity is marked at the top right corner. We mark the position of the radio AGN with a magenta star. The position of [O III] companion and the [C II] companions are marked by a blue triangle and red square, respectively. The position of the foreground galaxy is marked with a blue dot. The ALMA 400 GHz continuum is shown as white contours (levels of [0.35, 0.63, 1.1, 2.0, 3.0] mJy beam−1). The 8 GHz radio emission is shown as green contours. We illustrate the sizes of the NIRSpec IFU PSF (gray) and the synthesized beam of ALMA 400 GHz (θ400 GHz white) at the bottom left of each panel. (c): [O III]4959, 5007 spectra at the positions of the radio AGN (upper) and J0121-[O III] (lower). These continuum-subtracted spectra were extracted using r = 0.1″ apertures. The best fits from q3dfit are in dark magenta. Different Gaussian components are shown in shaded colors. The fitted Gaussian component of J0121-[O III] is highlighted in dark red. The vertical shaded regions mark the velocity ranges where the channel maps in panels (a, b) are integrated. The projected distance between the [O III] companion and radio core is marked at the top right corner of the lower panel. (d): Velocity map of J0121-[O III] constructed from the q3dfit fitting. The markers and contours are the same as in panels (a, b). (e): Example [O III]4959, 5007 spectra from two spaxels showcasing the different kinematics across J0121-[O III]. The Gaussian components are highlighted in blue and red for bluer and redder Δv, respectively. |
| In the text | |
|
Fig. 2. Emission line maps and spectra of TN J0121+1320 showing evidence of [C II] companion detection. (a): [C II] moment 0 maps in contours integrated at different channels as indicated in the bottom right corner. The contours are given in [3, 4, 5, …] × σ levels, where σ is the rms noise of the map. We note that only odd σ levels are used for [C II]-B for better visualization. The gray scale background image is the same as Fig. 1b. The red open crosses mark the positions of the [C II] companions, i.e., the same as the red boxes in Fig. 1. (b): [C II] spectra extracted at the [C II] companion positions. The vertical shaded regions mark the velocity ranges where the moment 0 maps in panel (a) are integrated. The single Gaussian fit of [C II] spectra are shown as dark magenta curves. Where available, we show the [O III]5007 spectra in black in arbitrary units extracted at the same position with the same aperture as the [C II] companion. We mark the projected distance between the [C II] and the radio core at the top right corners. |
| In the text | |
|
Fig. 3. NIRSpec IFU spectrum of J0121-[C II]-B extracted from r = 0.2″ aperture to maximize the continuum. The zoom-in focuses on the continuum shape. We mark the positions of bright emission lines. The yellow spectrum is the Bagpipe model with M⋆ = 109.9 M⊙ and AV = 1.5 (Carnall et al. 2018). The vertical gray shaded region indicates the detector gap. |
| In the text | |
|
Fig. 4. Moment 1 (line-of-sight velocity) map of 3DBAROLO [C II] fit to J0121-[C II]-B. The data, model, and residual are shown in the left, middle, and right panels, respectively. The black cross marks the kinematic center. The black dashed line indicates the kinematic major axis. The green contours mark zero velocity, which has a Δv = 114 km s−1 offset between the systemic redshift (Table 1). |
| In the text | |
|
Fig. 5. Similar to Fig. 1, emission line maps and spectra of TN J0205+2242 showing the [O III] companion search. The northern [O III]5007 emission blob in panel (b) could be an outflowing component spectrally related to radio core. The Gaussian fit to [O III] for J0205-[O III] is highlighted in cyan in panel (c). We note that spectra in panel (c) have different y-axis limits. |
| In the text | |
|
Fig. 6. Similar to Fig. 2, [C II] moment 0 map and spectrum of J0205-[C II]. Given the low S/N, the [C II] spectrum has been rebinned by a factor of three to 42 km s−1. |
| In the text | |
|
Fig. 7. Similar to Fig. 1, emission line maps and spectra of 4C+03.24 showing the [O III] companion search. The dashed contours in panel (a) show the optical continuum from NIRSpec IFU. We note that we mask the continuum from the foreground galaxy (blue dot, Appendix D.2). There are two [O III] Gaussian components that may be [O III] companions (panel c lower). We highlight them in dark green and black for the broad and narrow components, respectively. The fitted velocity maps of these two components of 4C03-[O III] are shown in panel (d) and panel (e) for the narrow and broad components, respectively. Example spectra at two spaxels are shown in panel (f) with the broad component highlighted in red and blue. |
| In the text | |
|
Fig. 8. Similar to Fig. 2, [C II] moment 0 maps and spectra of 4C03-[C II]. We note that 4C03-[C II]-A is at the radio core, whereas 4C03-[C II]-C is elongated, and its position, marked with a red open cross, is marked at its 5σ peak. We overlay the NIRSpec IFU continuum with dashed green contours (the same as in Fig. 7a), which may be the stellar tidal tail of a stripped companion galaxy. |
| In the text | |
|
Fig. 9. Similar to Fig. 1, emission line maps and spectra of 4C+19.71 showing [O III] companion search. The fitted [O III] Gaussian component of 4C19-[O III] is highlighted in teal in panel (c). |
| In the text | |
|
Fig. 10. Similar to Fig. 2, [C II] moment 0 map and spectrum of 4C19-[C II]. The right panel highlights the velocity difference between [C II] and [O III]. |
| In the text | |
|
Fig. 11. Similar to Fig. 4, 3DBAROLO fit moment 1 maps of 4C19-[C II]. There is a Δv = −70 km s−1 offset between the zero velocity fitted by 3DBAROLO and zsys (Table 1). This is consistent with the single Gaussian fit (Table B.2). |
| In the text | |
|
Fig. 12. Line ratio diagnostic diagrams for the individual kinetic components from the q3dfit 1D spectral fitting at the [O III] companion and radio core positions. We highlight the emission components of [O III] companions with larger symbols filled with same colors as used in Figs. 1c, 5c, 7c, and 9c. The other kinetic components at radio core and companion positions are shown with smaller gray stars and dots, respectively. The black curves are the empirical classifications that separate quiescent galaxies (lower left) from AGN (above this line) (Kewley et al. 2006). Typical errors are shown in the bottom left corner. |
| In the text | |
|
Fig. A.1. [O III]5007 channel maps for TN J0121+1320. We overlay the radio contours in green. The positions of [O III] (blue triangle) and [C II] (red square) companions are shown. |
| In the text | |
|
Fig. A.2. Similar to Fig. A.1, [O III]5007 channel maps for TN J0205+2242. We note that there are some bad pixels in channels −860 and −702 km s−1. |
| In the text | |
|
Fig. C.1. 3DBAROLO moment 0 (intensity) and moment 2 (velocity dispersion) maps of J0121-[C II]-B. |
| In the text | |
|
Fig. C.2. 3DBAROLO moment 0 (intensity) and moment 2 (velocity dispersion) maps of 4C19-[C II]. |
| In the text | |
|
Fig. C.3. Position velocity diagram of J0121-[C II]-B from 3DBAROLO along kinematic major axis (black dashed line in Fig. 4). The gray scale maps and blue contours show the data. Red contours show the model. |
| In the text | |
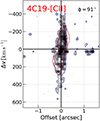 |
Fig. C.4. Similar to Fig. C.3, 3DBAROLO position velocity diagram of 4C19-[C II]. |
| In the text | |
|
Fig. D.1. Narrow-band emission line images and spectra of the foreground galaxies in the field of TN J0121+1320. Upper left: Narrow-band image of [O II]3726, 3729 at z = 1.4577 integrated from MUSE data cube. We mark the positions of the two [O II] emitters outside the NIRSpec IFU FoV in green and orange, respectively. The blue circle indicates the r = 0.25″ aperture used to extract the foreground galaxy (FG) in the NIRSpec IFU data. It is centered (blue dot) at the spatial position of the emission lines (Sect. 4.1) of FG, as in Fig. 1. The red box shows the FoV of the NIRSpec IFU. Upper right: Narrow-band image of [S III]9533 at z = 1.4577 observed by NIRSpec IFU. The blue dot and circle are the same as in the upper left panel. Middle and lower rows: Spectra extracted at the position of the FG in blue. We also show MUSE spectra of the two [O II] emitters in green and orange, respectively. |
| In the text | |
|
Fig. D.2. MUSE continuum image and spectra of foreground galaxy in the field of 4C+03.24. Upper left: Continuum image extracted from MUSE cube around 7250 Å. The blue dot marks the position of the potential foreground continuum source. The blue circle shows the r = 0.25″ aperture from which the spectrum was extracted. The red box indicates the NIRSpec IFU FoV. The green contours are same radio map as in Fig. 7. The dashed red contours are the same NIRSpec IFU optical continuum as in Fig. 7. Lower panel: Full MUSE spectrum extracted at the foreground galaxy position with a focus on the continuum. The red dotted vertical line indicates Lyα from 4C+03.24. The vertical gray dashed lines mark the zoom-in region around the emission line of the foreground galaxy. Upper right: Zoom-in view of the potential foreground [O II]3726, 3729 line. |
| In the text | |
Current usage metrics show cumulative count of Article Views (full-text article views including HTML views, PDF and ePub downloads, according to the available data) and Abstracts Views on Vision4Press platform.
Data correspond to usage on the plateform after 2015. The current usage metrics is available 48-96 hours after online publication and is updated daily on week days.
Initial download of the metrics may take a while.