| Issue |
A&A
Volume 698, May 2025
|
|
|---|---|---|
| Article Number | A241 | |
| Number of page(s) | 20 | |
| Section | Extragalactic astronomy | |
| DOI | https://doi.org/10.1051/0004-6361/202553837 | |
| Published online | 17 June 2025 | |
The MUSE view of Lyman-α nebulae in high redshift radio galaxies
1
Dipartimento di Fisica, Università degli Studi di Torino, Via Pietro Giuria 1, 10125 (Torino), Italy
2
INAF – Osservatorio Astrofisico di Torino, Via Osservatorio 20, I-10025 Pino Torinese, Italy
3
Osservatorio di Astrofisica e Scienza dello Spazio di Bologna Via Gobetti 93/3, I-40129 Bologna, Italy
⋆ Corresponding author.
Received:
21
January
2025
Accepted:
5
May
2025
We present the results from VLT/MUSE integral field spectroscopic observations of the Lyα emission nebulae associated with 11 high redshift (z≥2.9) radio galaxies (HzRGs) with Dec < 25°. When considering the additional nine sources with archival MUSE data available, these observations extend the coverage to half of the currently known HzRGs. We cannot confirm the original identification of two of the observed sources, as no Lyα emission was detected. We produced narrowband images centered on the Lyα line, extracted their nuclear spectra, mapped their ionized gas kinematics, and derived the Lyα surface-brightness profiles (SBPs). The SBPs are generally well reproduced by an exponential law with a typical scale length of ∼20−30 ckpc. We measured emission line ratios, finding most sources in agreement with an AGN origin for their gas ionization, with a single object hinting at strong star formation. Regarding the connection between the radio and ionized gas emission, we find that while the Lyα nebulae are preferentially aligned with the direction of the radio emission, there is no clear correlation in terms of size or gas kinematics, and only a weak trend connects their radio and Lyα luminosities. The alignment is most likely the result of anisotropic nuclear emission rather than a direct impact of the jets into the ionized gas.
Key words: galaxies: active / galaxies: high-redshift / galaxies: ISM
© The Authors 2025
 Open Access article, published by EDP Sciences, under the terms of the Creative Commons Attribution License (https://creativecommons.org/licenses/by/4.0), which permits unrestricted use, distribution, and reproduction in any medium, provided the original work is properly cited.
This article is published in open access under the Subscribe to Open model. Subscribe to A&A to support open access publication.
1. Introduction
At high redshift, the emission lines commonly used to trace ionized gas (e.g., [O III]λλ4959,5007, Hα) are redshifted into the infrared bands, greatly hindering ground-based observations of distant and faint objects. In return, rest-frame UV lines, which are unavailable at low redshift due to atmospheric absorption, become visible in optical bands; the chief among them is Lyman α.
Galactic Lyα radiation is created as a byproduct of hydrogen recombination: ∼60–70% of the photoionized hydrogen atoms yield a Lyα photon as they cascade down to lower energy levels (Cantalupo et al. 2008). It is a highly resonant transition, with a large cross section of interaction between Lyα photons and the ever-present HI atoms. As such, the Lyα emission – even when primarily produced in a small region within a galaxy, e.g., an active galactic nucleus (AGN) – becomes imprinted with the kinematic information corresponding to the different phases of intervening HI gas it interacts with as it travels through the interstellar medium (ISM) and circumgalactic medium (CGM). This results in complex profiles, with strong absorption troughs, tracing multiple emission components.
The Lyα line profile tends to be more heavily absorbed on the blue side as compared to the red side. This asymmetry is observed in the redshift measurements performed with both Lyα and nonresonant ionized lines, as the profile centroids are systematically offset by ∼400 km s−1 redward from the systemic velocity (Steidel et al. 2010). A great amount of effort has been invested in radiative transfer simulations of Lyα, considering a plethora of different configurations for CGM and ISM geometries, in order to explain the observed line profiles (e.g., Verhamme et al. 2006; Behrens et al. 2014; Gronke et al. 2015, 2017).
Studying objects at high redshift gives us a peek into cosmic noon (z∼2−3). This corresponds to an epoch in the Universe's history where cosmic averages of star formation rate density, black hole accretion, and AGN activity were at or very close to their maxima (Madau & Dickinson 2014; D’Silva et al. 2023; Wang et al. 2024). As such, the effects of AGNs in their host galaxies and the large-scale environments surrounding them are expected to be particularly pronounced.
Lyα has been routinely utilized to trace nebular emission extending up to a few 100 kpc from the nucleus of high redshift AGN (see Cantalupo et al. 2014; Borisova et al. 2016; Arrigoni-Battaia et al. 2018; Cai et al. 2019), utilizing the new generation of integral field units (IFU), namely MUSE at the Very Large Telescope and KCWI at the W. M. Keck Observatory. The combination of fluorescent emission due to resonant scattering and intrinsic line brightness (Hayes 2015) enables observations of these gargantuan gas structures, whereas other ionized tracers cannot probe at such depths.
In particular, high redshift radio galaxies (HzRGs) represent an ideal laboratory in which one can study the interplay between nuclear activity and AGN host galaxies. This is because selective obscuration caused by the circumnuclear medium entirely eliminates the need to remove the quasar light, which is essential in type 1 AGN if one wishes to analyze the galactic component. This is a process that can generate large uncertainties and loss of valuable information – especially at high redshift due to objects appearing increasingly fainter.
The HzRGs are a well-studied (Villar-Martín et al. 2007a, b; Miley & De Breuck 2008; Matsuoka et al. 2009; Nesvadba et al. 2017; Silva et al. 2017; Wang et al. 2023) but rare class of objects, with ∼50 known HzRGs above z = 3 (Miley & De Breuck 2008). They are very massive (Rocca-Volmerange et al. 2004; Seymour et al. 2007; De Breuck et al. 2010), vigorously star-forming (Seymour et al. 2008; Drouart et al. 2014), and reside in overdense environments (Venemans et al. 2006; Hatch et al. 2011; Wylezalek et al. 2013; Uchiyama et al. 2022).
Wang et al. (2023) presented results from MUSE observations of eight HzRGs, selected from a list compiled by Miley & De Breuck (2008) and obtained as part of several observing programs. These sources were selected because in previous observations they had been found to be associated with large Lyα nebulae, extended over more than 10″. In this paper, we present results from MUSE observations of an additional 11 HzRGs that are accessible for observations at the VLT (δ<25°), and have Lyα visible in their MUSE spectra (z≥2.9), in order to obtain a more general view of the properties of Lyα nebulae around these sources.
The paper is organized as follows: in Sect. 2 we present the sample and describe the observations and the data reduction. In Sect. 3 we present our results divided into the following subsections: Sect. 3.1 presents the radial distribution of the Lyα emission, Sect. 3.2 the gas kinematics, and Sect. 3.3 the emission line ratios. The connection between the radio and Lyα emission is addressed in Sect. 4. In Sect. 5 we summarize the main findings and draw our conclusions. We adopt the following set of cosmological parameters: H0 = 69.7 km s−1 Mpc−1 and Ωm = 0.286 (Bennett et al. 2014).
2. The sample and the MUSE observations
The sample selection was inherently limited due to the relative scarcity of known HzRGs. From the aforementioned list of HzRGs compiled by Miley & De Breuck (2008), we first limited our selection to the 47 sources with z≥2.9, which corresponds to the Lyα emission line cutoff in the MUSE spectral coverage. Additionally, these sources were further restricted to those which are easily observable with the VLT, i.e., with δ<25°. This results in 25 sources, which represents about half of all known HzRGs at z≥2.9. From this list, we dropped the nine sources for which MUSE data were already available; the analysis of the MUSE observations of said sources was presented for all but one object by Wang et al. (2023). Five sources from the original list were not observed due to scheduling constraints. The remaining 11 sources were observed as part of the ESO program 108.22FU.001 (PI B. Balmaverde). Four separate observations were performed, between which the telescope was rotated 90° to reject cosmic rays, for a total of ∼2600 s of exposure time at minimum. We used the European Southern Observatory (ESO) MUSE pipeline (version 2.8.7) to obtain a fully reduced and calibrated data cube (Weilbacher et al. 2020). The seeing ranged from 0 5 to 1
 2, with a median value of 0
 71.
71.
In Table 1 we list all 25 sources with z≥2.9, in order of increasing redshift, and provide a record of their observations. Overall, archival MUSE data have significantly longer exposure times (with an average of 15 200 s) than those obtained with our program (with an average of 2960 s), by a factor of ∼5.
Main properties of the HzRGs sample and observation log.
We corrected the astrometry of the MUSE data using the position of several sources visible in the PanSTARRS images (Chambers et al. 2016) (or, when these were not available, from the Digitized Sky Survey1) and present in the MUSE field of view. This procedure enabled us to align the MUSE data with the radio data derived from the images of the Karl G. Jansky Very Large Array Sky Survey (VLASS; Lacy et al. 2020) obtained at a frequency of 3 GHz with a spatial resolution of 2 5, with an accuracy of
  .
.
3. Results
In two of the 11 sources observed, NVSS J021308-322338 and TN J1123-2154, Lyα emission was not detected in the MUSE data. The 3σ upper bound of their Lyα flux is well below the values reported in literature measurements. Therefore, we cannot confirm the identification of these two sources as HzRGs. They are consequently dropped from the sample and excluded from the remaining analysis in this study. More details are given in Appendix C.
In Fig. 1 we present as an example the main results obtained from the analysis of the MUSE data for NVSS J151020-352803. The remaining sources are shown in Appendix A, Figs. A.1. through A.9.. For each source we present the nuclear spectrum, extracted using an 1 2 radius aperture (∼8–10 kpc) centered on the pixel with the brightest Lyα emission. Whenever additional lines (namely, NVλλ1238,1242, CIVλλ1548,1550, HeIIλ1640, and CIII]λ1908) are observed, they are also shown along with Lyα. For the objects in which HeII is detected, its centroid is used as a velocity reference, as it is a more robust measurement of systemic redshift than Lyα. We also present 20″ × 20″ images for each source, created using a wavelength range spanning across the FWHM of the total line profile and centered on the peak of the Lyα emission. For the sources in which the radio emission is extended, we overplot the radio contours onto the Lyα image. The Lyα brightness profile extracted in circular annuli of increasing radius (see Sect. 3.1) are also shown. Lastly, we present spatially resolved maps of velocity and line width (see Sect. 3.2). In Appendix B we provide notes on the individual sources.
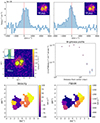 |
Fig. 1. NVSS J151020-352803. Top: Spectra extracted from the two Lyα regions (shown as black circles in the narrowband images in the insets). The dashed red line represents the systemic redshift taken from the Lyα centroid. Middle: On the left is the Lyα image extracted from the spectral region shown in the inset with superposed radio contours obtained from the VLASS image. Black contours mark the 2σ flux limits, and the blue cross is the point from which the brightness profile is extracted. On the right is the surface brightness profile. Bottom: Voronoi-tessellated maps of velocity and FWHM of the Lyα line. |
3.1. Radial distribution of the Lyα emission
We produce Lyα surface-brightness profiles (SBPs) extracted in circular annuli of increasing radius. The extraction regions are first limited to a 1-pixel radius circular aperture, and the interval between the radii used to create each annulus increases as they draw away from the center of emission, to increase the total collecting area and decrease noise in zones of fainter nebular emission. The manner in which these intervals are defined ensures that the inner regions, the extended emission, and the sky background are all well sampled on a logarithmic scale, as they are fit with either an exponential or a power law. The sizes of the annuli are maintained across all sources rather than modified case by case. This is done to have a similar spatial sampling for all our sources, as the angular scale changes little within the redshift interval of interest. The procedure is as follows: Within every annulus, we sum the relevant spectral pixels from each spaxel to generate a representative spectrum. The continuum is modeled with a single-degree polynomial and removed. The Lyα emission is then measured in each annulus by direct integration of the line profile.
We did not attempt to account for the effects of absorption in the Lyα profile due to the inherent limitations in our sample, given the relatively low surface brightnesses and S/N of the sources. Performing the absorption correction of the spectrum in each annulus is unfeasible considering that (1) the outermost annuli would be entirely impossible to correct, and we would have to limit ourselves to the highest-surface-brightness regions; and (2) even in the central brighter regions, each annulus would contain emission from antipodal regions. This is because both the number of absorbers and the depth of the troughs they produce have been observed to change dramatically in kpc scales (see, e.g., Coloma Puga et al. 2024), making this approach unfeasible.
The collection of the SBPs obtained for all sources is shown in Fig. 2. In this Figure we also report the background levels in each image, shown as horizontal lines in the right vertical axis. We define the maximum nebular radius as the distance at which the measured surface brightness is twice the value of the background. Overall, the SBPs show significant curvature in the log SB – log r representation, indicating that they are better reproduced by an exponential function rather than a power law. This is supported by the fact that the χ2 statistic is, on average, more than a factor of 10 larger when fitting with a power law. The SBPs are then fit with a function given by SB(r) = Cexp(−r/rh), where C denotes normalization and rh is the scale length. The values of rh as well as the maximum measurable distance within the 2σ limit of the nebulae are reported in Table 2. In this table we also give the derived the total Lyα luminosity as well as the maximum extent of the radio emission.
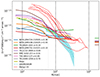 |
Fig. 2. Redshift-corrected surface brightness curves for all the observed objects within our sample as well as those studied by Wang et al. (2023) (dashed lines) and Arrigoni-Battaia et al. (2018) (average indicated by the solid blue-shaded area with a dashed line). On the right side Y-axis, we report the different background level estimated for each individual source. |
Properties of the brightness profiles.
The closest comparison of our results can be drawn with the sample studied by Wang et al. (2023): they observe the same class of object (HzRGs) with the same instrument (MUSE). However, these objects were chosen for observations as part of the MUSE commissioning program due to their known brightness and extension. This induces a bias – which the authors themselves acknowledge – as their Lyα nebulae are both systematically brighter and larger than any other sample of high redshift AGN. Indeed, our targets’ Lyα emission is, as a general trend, significantly fainter: at a fixed radius of 50 ckpc, we find values in the range 2×10⁻¹⁵−2×10⁻¹⁴ erg s−1 cm−2 arcsec−2, while the observed SBPs of Wang et al. (2023) span a range that is a factor of ∼10 brighter. Their SBPs are best reproduced by a two-piece function, including an exponential and power law. Given that our objects are fit exclusively with exponential functions, we limit the comparison to their exponential fitting results, where they find the scale lengths to vary from 28 to 135 ckpc, averaging out at ∼75 ckpc. By comparison, our objects only range from 16 to 33 ckpc, and their average length is ∼27 ckpc. This is likely a slight overestimation of their average size given that two out of the nine objects remain unresolved. Thus, these sources are associated with both significantly brighter and more extended Lyα nebulae. The inner regions of the SBP of our HzRGs are closer to those seen in large samples of high redshift type 1 AGN (Arrigoni-Battaia et al. 2018), though the objects in our sample and HzRGs more generally appear larger in size. The SBPs of both these samples are also included in Figure 2.
3.2. Velocity and FWHM maps
Interpreting the kinematics of the Lyα emitting gas is not, in general, a trivial effort. Resonant scattering can and regularly does result in spectra that are radically different from the intrinsic Lyα emission of the galaxy due to the presence of intervening HI gas at both extra- and intergalactic scales. In order to obtain robust and representative results of the kinematic properties of the ionized gas, we chose to forgo some amount of spatial resolution in order to increase the S/N of the spectra used in our analysis. To this end, we performed Voronoi tessellation (Cappellari & Copin 2003) of the observed emission by first making a hard cutoff of S/N > 1.5 to limit the pixels used, then adjusted the desired S/N in each bin in order to achieve the best compromise between the spatial resolution and quality of the spectra.
Once the bins were selected, we performed Gaussian fitting of the different spectra. We accounted for absorption troughs and multiple emission components in cases where the total S/N was high enough. The results of this analysis are presented in velocity and line width maps in Appendix A. Although the emission is visibly extended for NVSS J095751-213321, it is faint enough that creating more than a single bin results in excessively noisy spectra unfit for modeling. By contrast, the object TN J0924-2201 is not spatially resolved. In both these cases, only the width of the line is given as a representative value of the source in Appendix B.
The results of this analysis are Lyα line widths which oscillate between 900 and 1400 km s−1 with relatively small changes across individual nebulae. The velocity fields have generally very low amplitudes – typically smaller than ±100 km s−1. Three out of the six cases for which this analysis is possible – namely TN J1112-2948, TN J1049-1258, and MRC 0251-273 – show clear signs of ordered rotation, albeit maintaining the aforementioned small-scale gradients.
It is also interesting to explore whether there is any connection between the gas kinematics and the radio emission, i.e., whether there are signs of interaction between the radio jets and the ionized gas. We can only simultaneously resolve the radio and velocity fields in three cases, and none of them display a clear correlation between the radio morphology and the morphokinematic properties of the host galaxy, be it systemic velocity or line width. We describe this comparison in detail below:
-
NVSS J151020-352803: The radio emission covers almost the entirety of the observable nebula. The western lobe is redshifted by ∼200 km s−1 with respect to the eastern lobe. It also appears more disturbed. However, as absorption correction was not possible in this case, it is difficult to draw any conclusions.
-
TN J1112-2948: In this case, the radio lobes are well beyond the observed nebula. A clear rotational motion is observed in the velocity field of this object, and the FWHM has a slight gradient along the direction of the radio jet.
-
TN J1049-1258: The kinematics and general characteristics of this peculiar case were studied more in depth in Coloma Puga et al. (2023). In summary, the host galaxy displays a clear rotational motion with a wide (∼103 km s−1) line profile, while the extended emission has a velocity gradient along the radio axis and a much narrower (∼300 km s−1) profile.
Three objects do not contain enough flux in the entirety of the nebula to produce more than one bin (NVSS J095751-213321 and TN J0924-2201) or more than two bins (NVSS J095438-210425). In these instances, we forgo spatial kinematic analysis: a single bin contains no spatial information, while the two bins in NVSS J095438-210425 are very spatially extended and contain many loose pixels. Thus, they are highly likely to smother out any kinematic features along the breadth of the nebula.
3.3. Emission line fluxes
The lines available in the MUSE spectra of these objects are all at rest-frame UV (i.e., Lyα, NVλλ1238,1242, CIVλλ1548,1550, HeIIλ1640, and CIII]λ1908). The emission line fluxes are measured for each object by adding the spectrum in each pixel where the Lyα flux remains above 2σ. This approach ensures that the S/N is optimized for this line; regarding the other emission lines, which are visibly more compact, it guarantees all of their emission are taken into account, even if it increases the final uncertainty. We find this to be a desirable compromise: resonant scattering means precise and complex modeling is necessary for Lyα, while a simple Gaussian model quite accurately reproduces the observed profile of the other lines and is less affected by pixels which include spurious noise or whose flux is close to background levels.
Those objects that do not display visible absorption troughs – either because they are too faint or too heavily absorbed on one side – are fit with a single Gaussian for the Lyα profile. If the line appears absorbed but is too faint for accurate fitting, a narrowband measurement is used.
One exception to this rule occurs on the brightest source of this fainter population, TN 1049-1258. In this object, HeII emission is not associated with the host galaxy but rather with an extended region of heavily redshifted and extended Lyα emission aligned with the radio emission. As the origin and nature of this emission are still under discussion, we refer to Coloma Puga et al. (2023).
3.3.1. Line ratios and ionization mechanisms
Five out of the nine sources in our sample display detectable levels of line emission other than Lyα (see Table 3). The observed Lyα/CIV and Lyα/HeII ratios are generally within the observed range for other HzRGs. For instance, Villar-Martín et al. (2007a) find mean values of Lyα/CIV = 7.8 and Lyα/HeII = 9.6 in a sample of 53 HzRGs at z∼2−4. We find mean values of Lyα/CIV = 6.6 and Lyα/HeII = 14.4, albeit from a much more limited sample. In the case of TXS 0952-217 and MRC 0251-273, the relatively high Lyα/HeII and Lyα/CIV ratios suggest an alternative origin for at least a fraction of the Lyα emission, meaning star formation is a possible additional ionization mechanism as postulated by Villar-Martín et al. (2007a).
Emission line fluxes and ratios.
Given the Lyα/HeII and Lyα/CIV ratios observed in the brighter objects of our sample (with the exception of NVSS J151020), and those observed in large samples of HzRGs, this is expected. If one assumes relatively similar ratios for all sources, the emission of the non-Lyα lines on the fainter part of the sample fall to or below background levels, rendering them unobservable. This raises an additional issue: when observing this fainter end of the HzRG Lyα luminosity function, we are limited to highly uncertain upper bounds for the fluxes of these lines. Consequently, it remains a point of contention whether the ionization mechanism for Lyα is the same in the more luminous sources, since precise diagnostics are unfeasible. It could very well be that the line ratios in these fainter objects are much higher than in those on the brighter end and that the sources of ionizing photons are altogether different. The available observations do not shed light on this.
Matsuoka et al. (2009) proposed a combination of the CIV/HeII and CIII]/CIV line ratios as a probe for metallicity in high redshift active galaxies. While the estimated metallicities are dependent on the parameters used in the photoionization models, we find our observed line ratios to be well in line with those in the sample presented in Matsuoka et al. (2018).
3.3.2. The CIV/CIII ratio and UV photon escape fraction
Recent works, such as those by Schaerer et al. (2022) and Saxena et al. (2022), have found a likely correlation between the strength of the CIVλλ1548,1550 emission line and the escape fraction of the Lyman continuum, both at low and high redshift. Given the high S/N achievable with an 8-m class telescope, the MUSE observations are uniquely suited for complete modeling of the Lyα profile. Consequently, one can directly obtain fesc by comparing the intrinsic and observed fluxes of the line, and also measure the strength of the CIV line by comparing it with CIII]λ1908. Schaerer et al. (2022) proposes an empirical cutoff of C43 = CIV/CIII]>0.75, above which galaxies become strong Lyman leakers (fesc>0.1).
In our case, accurate and complete modeling of the Lyα emission was only possible for two sources: MRC 0251-273 and TXS 0952-217. For both, C43 is above the cutoff, with values of 3.31 and 1.25, respectively, and the escape fractions of Lyα photons are 0.59 and 0.41, respectively.
These estimates must be taken with a grain of salt, as – in addition to the intrinsic uncertainties associated with studying such faint objects – the results from Lyα modeling are affected by strong degeneracies between intrinsic emission and HI column density (e.g., Silva et al. 2017). As such, they are best interpreted as upper bounds of the true value of fesc.
4. Radio versus Lyα properties
4.1. Radio versus Lyα luminosities
Low redshift radio galaxies show a strong trend of increasing optical line luminosity with radio power (see, e.g., Baum & Heckman 1989a, b; Rawlings et al. 1989; Willott et al. 1999). Buttiglione et al. (2010) explored this connection based on a spectroscopic study of the radio sources in the Third Cambridge Catalog (3C, Spinrad et al. 1985) with z<0.3. They found that radio galaxies follow a quasilinear correlation between line ([O III]λ5007 and Hα) and radio luminosity at 178 MHz, i.e., ![$ L_{\mathrm {[O\ III]}} \propto L_{178}^{0.99} $](/articles/aa/full_html/2025/06/aa53837-25/aa53837-25-eq7.gif) with a spread of 0.5 dex. From observations of 3C radio galaxies at 0.3<z<0.8, Capetti et al. (2023) found that although the trend of increasing optical emission line (also [O III]λ5007) luminosity with radio power remains present, the slope of radio-line correlation decreases at the highest radio power (∼1028 W Hz−1). This suggests that in more luminous AGNs, a higher fraction of nuclear ionizing photons escape without being absorbed and reprocessed by the ISM. Studies of HzRGs enable us to explore this issue at even higher radio power.
with a spread of 0.5 dex. From observations of 3C radio galaxies at 0.3<z<0.8, Capetti et al. (2023) found that although the trend of increasing optical emission line (also [O III]λ5007) luminosity with radio power remains present, the slope of radio-line correlation decreases at the highest radio power (∼1028 W Hz−1). This suggests that in more luminous AGNs, a higher fraction of nuclear ionizing photons escape without being absorbed and reprocessed by the ISM. Studies of HzRGs enable us to explore this issue at even higher radio power.
In Fig. 3 we compare the radio power at the rest frame frequency of 500 MHz (as estimated by Miley & De Breuck (2008)) and the total Lyα luminosity. We also include in this comparison the measurements by Wang et al. (2023). By considering only the nine sources observed as part of our program, we find no connection between these quantities. The inclusion of the eight sources from Wang et al. (2023) results in a marginal correlation with a 5% probability and a slope of m = 0.75±0.33.
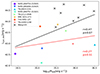 |
Fig. 3. Total Lyα luminosity vs radio power at 500 MHz. We added the measurements from Wang et al. (2023), marked as black crosses, to those of our sample (colored symbols). The red line represents the best linear fit to our data only, while the black line displays the fit to the combined sample. |
The spread in data points is very large – about two orders of magnitude – which is much larger than what is observed in lower redshift radio galaxies. This indicates a looser connection between jet power and Lyα line luminosity, which might be due to either (1) the presence of additional ionization mechanisms (e.g., star formation) or (2) internal absorption of the Lyα photon within the gas nebulae, caused by aforementioned resonant scattering or absorption by dust. This second mechanism could explain the systematic spread in these data, as variations in the geometry and density of HI gas in both the ISM and CGM (Verhamme et al. 2006; Behrens et al. 2014; Gronke et al. 2015, 2017), as well as galaxy-to-galaxy differences in the dust concentration (see Laursen et al. 2009) yield varying escape fractions of Lyα. In contrast, more “traditional” ionized emission lines such as [O III]λ5007 and Hα are not subject to those effects to such a high degree.
4.2. Geometrical relation between radio and Lyα emission
Wang et al. (2023) report a connection between radio and Lyα emission, with an alignment between the position angle (PA) of the radio emission and the Lyα nebula. In our sample of nine HzRGs, six sources show a resolved structure in the VLASS images (i.e., NVSS J151020-352803, TN J1112-2948, NVSS J095751-213321, NVSS J094724-210505, TN J1049-1258, and TN J0924-2201)2. However in J0924-2201, the farthest source of the sample, the Lyα line is extremely compact and faint, making it impossible to extract information about the morphology of its Lyα emission. It is thus omitted from this analysis.
In order to estimate the angle of the Lyα nebulae, we performed a 2D Gaussian fitting using the narrowband images shown in Appendix A (smoothed using a 1-pixel Gaussian kernel). This process yielded both the PA, as well as the semimajor and semiminor axes of the ellipse. In some cases, the available signal and the small size of the nebula did not yield a robust fit. In those instances, the PA was extracted from the morphology of the 2σ isophote. Lastly, although the Lyα emission in NVSS J095751-213321 was slightly extended, it is far too faint for any robust analysis (see Fig. A.4.). The derived values are listed in Table 4.
Geometrical properties of the Lyα nebulae and radio emission of the sources for which both are resolved.
In the radio, all the extended sources present a clear double-lobe morphology, and the PA was calculated using the brightest pixel of each lobe.
All four sources in our observing program – for which we derived this comparison – show alignment between these two structures within less than 16°. We also considered the measurements by Wang et al. (2023), and in Fig. 4 we show the distribution of PA offsets between the radio axis and the Lyα nebulae. We performed a Kolmogorov-Smirnov statistical test on the distribution of PA offsets for both the total sample (our work plus W23+) and W23+ alone (i.e., the larger individual sample). We report the probability of drawing such a distribution as P = 0.7% from a random sample for the total sample and P = 10% for W23+ alone. As such, the four sources included in our analysis are key to increasing the statistical significance of the observed alignment between radio and Lyα emission.
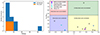 |
Fig. 4. Left: Offset between the PA of the radio and the Lyα structures. The orange histogram refers to the sources in our sample, while the blue histogram also includes those from Wang et al. (2023). Right: Nebular ellipticity e vs PA offset. |
Considering size, there is more variety. In cases such as NVSS J151020-352803 and NVSS J094724-210505, the extent of their radio and ionized emissions is very similar. The other two, however, exhibit much larger radio emissions than the observed Lyα. The objects which did not form part of this size analysis, however, must also be accounted for, as there are multiple sources in which the Lyα emission is extended while the radio emission remains unresolved. Therefore, we cannot claim that a connection exists between the extension of the ionized gas emitting regions and the radio emission. Nevertheless, strong evidence suggests alignment between the radio and Lyα present in HzRGs.
To analyze the relationship between radio and Lyα emission alignment with respect to general nebular morphology, we employed ellipticity from the 2D Gaussian analysis as a measure of emission asymmetry. When comparing this alignment parameter, we observe clustering in a region that corresponds to nebulae whose emission is highly correlated to radio emission in terms of direction but remains relatively symmetrical nonetheless. While the radio emission and its associated phenomena are likely to have an enhancing effect on the emission of the ionized gas they interact with, they do not appear to reshape the nebulae on larger scales – or, at the very least, this is not the case in the majority of sources observed. Exceptions, however, remain: three highly elongated sources lie along the direction of the radio emission, and a single source appears oriented perpendicular to the radio emission.
Given the lower exposure times and intrinsic brightness of the sources, these results and, in particular, those drawn from our sample must be interpreted with the following caveat: it is exceedingly difficult to draw robust limits on the extent of these nebulae, and radiative transfer of Lyα plays a considerable part in reshaping the original ionized emission in both kinematic and morphological terms. This is compounded by the fact that numerous phenomena associated with radio jets could enhance ionized line emission, and it is likely that they all play a part: relativistic beaming, cavities and their associated shocks, young stellar emission from positive feedback, among others. Disentangling the extent to which these components contribute to this apparent alignment is beyond the scope of this work and will require multiwavelength observations.
Villar-Martín et al. (2007b) noticed similar phenomena in a smaller sample of HzRGs (z∼2.5), where two of the three nebulae observed with VIMOS were well aligned with the radio direction. In one object, the Lyα emission remained relatively symmetrical, while in a different one it was highly elongated along the radio axis.
Alignment between the morphologies of the extended line and radio emission around high-redshift active galaxies is a well-documented phenomenon (e.g., Heckman et al. 1991; Nesvadba et al. 2017); Eales (1992) proposed that the origin of these observations is partly due to selection effects. Radio emission appears to be preferentially observed when aligned with nebular line emission, due to jet-cloud interactions in high-density environments. These denser regions, which are inherently brighter due to both interaction with the jets and illumination from the AGN, enhance the radio emission itself, leading to an inherent bias from observational limitations. As we probe the brighter end of the Lyα luminosity function of HzRGs, we are more likely to observe those objects in which this radio emission is enhanced. This is in agreement with the fact that no clear correlation has been observed between the sizes of the radio and nebular emissions. If the origin for nebular morphology were jet-cloud interactions, one would also expect a spatial correlation.
Different environments, AGN activity cycles and their associated feedback, and accretion histories of these galaxies may likely all play a part in the observed nebular morphologies. Disentangling these various underlying components requires a profound multiwavelength approach and is beyond the scope of this work.
5. Summary and conclusions
In this study, we analyzed the IFU data of 11 observations of HzRGs performed with MUSE at the VLT. We detected nine sources and provided upper limits on the emission of two undetected objects which we cannot identify as HzRGs. This paper covers Lyα morphology and spatial distribution, the overall UV spectral properties of the sources, and the possible connections between these parameters and the radio emission associated with these objects. Our summarized findings are as follows:
-
We present synthetic narrowband Lyα maps, nuclear spectra, and surface brightness profiles for all the observed sources in Appendix A. For those sources in which HeII is detected, we report accurate systemic redshift measurements.
-
We find that the SBPs of the objects in our sample are generally better described by an exponential function. They are systematically smaller and fainter than those previously studied (e.g. W23+). These latter sources, however, were preselected for having bright and extended Lyα nebulae, and we conclude that this is a result of selection bias. The SBP of our sources are similar to those observed in type 1 QSOs (e.g., Arrigoni-Battaia et al. 2018).
-
The general spectral properties of the sample are in line with other observations of Lyα in HzRGs, presenting clear signs of absorption due to intervening HI gas and broad line profiles in the order of 1000 km s−1. In terms of velocity fields, we observe rotation of very small amplitude in a number of objects and less ordered kinematics in others, without a clear connection to radio power, morphology, or Lyα luminosity.
-
The observed emission line ratios are, in most cases, consistent with an AGN as the source of ionizing photons. We find slightly increased Lyα/HeII ratios in several objects, which also coincide with an increase in the CIV/HeII ratio, while Lyα/CIV remains within levels expected from AGN photoionization. As such, these ratios can be explained by either a higher ionization parameter – possibly resulting from increased star-forming activity (Villar-Martín et al. 2007a) – or an overall lower metallicity (Matsuoka et al. 2009).
-
Contrary to what is found in lower redshift sources using rest-frame optical ionized lines, we do not report a strong correlation between the total or nuclear Lyα luminosities and radio power. This is possibly due to the effects of resonant scattering of Lyα photons, yielding luminosities which are highly dependent on both the intervening HI gas along the line of sight, the environment and morphology of the nebulae of origin, and the presence of dust in the host galaxy.
-
For the four objects in our sample where it was possible to simultaneously spatially resolve the radio and nebular UV emission, we find that all are very well aligned with the direction of the radio emission, with, at most, a 16° deviation. This is a well-documented and commonly observed phenomenon postulated as an effect of limiting magnitudes and selection bias due to jet-cloud interactions. While we probe a sample of slightly lower power than those previously studied, this effect remains pervasive, as we also fail to observe a clear correlation between the degree of alignment and the morphological properties of the nebulae.
In general, we find that while these data allow for, in particular cases, the detection and characterization of AGN-related phenomena (e.g., Silva et al. 2017; Coloma Puga et al. 2024), they are far from the norm. Most of the objects in this sample are far too faint to allow for such an analysis given the observing strategy, which was more “snapshot-minded” than necessary for both attaining a high enough signal near the nuclear regions to confirm the presence of outflows and quantify their effects, as well as for probing the very sparse and extended emission line regions observed in other samples of HzRGs. The advent of new generation telescopes – JWST and ELT in particular – should allow for more accurate IFU observations and yield better estimates of the impact of AGN feedback at this essential point in cosmic time.
One positive result is the confirmation that the alignment effect between radio and Lyα persists even when probing the lower end of the available luminosity range for HzRGs. While this may be less of interest to IFU and imaging projects, long-slit spectroscopy can still play a role in identifying and characterizing these objects, as the radio morphology – and to a lesser degree, the radio power – remains a good primer for designing observing strategies that orient the slit along the radio axis.
Acknowledgments
We extend our gratitude to Wuji Wang and Fabrizio Arrigoni-Battaia for allowing us to use their data in parts of our analysis, as well as to the referee for their help and insightful comments. The Pan-STARRS1 Surveys (PS1) and the PS1 public science archive have been made possible through contributions by the Institute for Astronomy, the University of Hawaii, the Pan-STARRS Project Office, the Max-Planck Society and its participating institutes, the Max Planck Institute for Astronomy, Heidelberg and the Max Planck Institute for Extraterrestrial Physics, Garching, The Johns Hopkins University, Durham University, the University of Edinburgh, the Queen's University Belfast, the Harvard-Smithsonian Center for Astrophysics, the Las Cumbres Observatory Global Telescope Network Incorporated, the National Central University of Taiwan, the Space Telescope Science Institute, the National Aeronautics and Space Administration under Grant No. NNX08AR22G issued through the Planetary Science Division of the NASA Science Mission Directorate, the National Science Foundation Grant No. AST–1238877, the University of Maryland, Eotvos Lorand University (ELTE), the Los Alamos National Laboratory, and the Gordon and Betty Moore Foundation. The Digitized Sky Survey was produced at the Space Telescope Science Institute under U.S. Government grant NAG W–2166. The images of these surveys are based on photographic data obtained using the Oschin Schmidt Telescope on Palomar Mountain and the UK Schmidt Telescope. The plates were processed into the present compressed digital form with the permission of these institutions.
Available at http://archive.eso.org/dss/dss.
In the VLASS image, this source is unresolved, but a higher resolution image (FWHM = 0 49) at 8.5 GHz available at https://www.vla.nrao.edu/astro/nvas/ shows two components separated by 1
 2, oriented at PA ∼ 70°.
References
- Arrigoni-Battaia, F., Hennawi, J. F., Prochaska, J. X., et al. 2018, MNRAS, 482, 3162 [Google Scholar]
- Baum, S. A., & Heckman, T. 1989a, ApJ, 336, 681 [NASA ADS] [CrossRef] [Google Scholar]
- Baum, S. A., & Heckman, T. 1989b, ApJ, 336, 702 [NASA ADS] [CrossRef] [Google Scholar]
- Behrens, C., Dijkstra, M., & Niemeyer, J. C. 2014, A&A, 563, A77 [NASA ADS] [CrossRef] [EDP Sciences] [Google Scholar]
- Bennett, C. L., Larson, D., Weiland, J. L., & Hinshaw, G. 2014, ApJ, 794, 135 [Google Scholar]
- Borisova, E., Cantalupo, S., Lilly, S. J., et al. 2016, ApJ, 831, 39 [Google Scholar]
- Buttiglione, S., Capetti, A., Celotti, A., et al. 2010, A&A, 509, A6 [NASA ADS] [CrossRef] [EDP Sciences] [Google Scholar]
- Cai, Z., Cantalupo, S., Prochaska, J. X., et al. 2019, ApJSS, 245, 23 [Google Scholar]
- Cantalupo, S., Porciani, C., & Lilly, S. J. 2008, ApJ, 672, 48 [Google Scholar]
- Cantalupo, S., Arrigoni-Battaia, F., Prochaska, J. X., Hennawi, J. F., & Madau, P. 2014, Nature, 506, 63 [Google Scholar]
- Capetti, A., Balmaverde, B., Baldi, R. D., et al. 2023, A&A, 671, A32 [NASA ADS] [CrossRef] [EDP Sciences] [Google Scholar]
- Cappellari, M., & Copin, Y. 2003, MNRAS, 342, 345 [Google Scholar]
- Chambers, K. C., Magnier, E. A., Metcalfe, N., et al. 2016, arXiv e-prints [arXiv:1612.05560] [Google Scholar]
- Coloma Puga, M., Balmaverde, B., Capetti, A., et al. 2023, ApJ, 958, L36 [NASA ADS] [CrossRef] [Google Scholar]
- Coloma Puga, M., Balmaverde, B., Capetti, A., et al. 2024, A&A, 686, A220 [NASA ADS] [CrossRef] [EDP Sciences] [Google Scholar]
- De Breuck, C., van Breugel, W., Röttgering, H., et al. 2001, AJ, 121, 1241 [NASA ADS] [CrossRef] [Google Scholar]
- de Breuck, C., Hunstead, R. W., Sadler, E. M., Rocca-Volmerange, B., & Klamer, I. 2004, MNRAS, 347, 837 [Google Scholar]
- De Breuck, C., Seymour, N., Stern, D., et al. 2010, ApJ, 725, 36 [NASA ADS] [CrossRef] [Google Scholar]
- Drouart, G., De Breuck, C., Vernet, J., et al. 2014, A&A, 566, A53 [NASA ADS] [CrossRef] [EDP Sciences] [Google Scholar]
- D’Silva, J. C. J., Driver, S. P., Lagos, C. D. P., et al. 2023, MNRAS, 524, 1448 [Google Scholar]
- Eales, S. A. 1992, ApJ, 397, 49 [NASA ADS] [CrossRef] [Google Scholar]
- Gronke, M., Bull, P., & Dijkstra, M. 2015, ApJ, 812, 123 [Google Scholar]
- Gronke, M., Dijkstra, M., McCourt, M., & Oh, S. P. 2017, A&A, 607, A71 [NASA ADS] [CrossRef] [EDP Sciences] [Google Scholar]
- Hatch, N. A., De Breuck, C., Galametz, A., et al. 2011, MNRAS, 410, 1537 [NASA ADS] [Google Scholar]
- Hayes, M. 2015, PASA, 32, e027 [NASA ADS] [CrossRef] [Google Scholar]
- Heckman, T. M., Lehnert, M. D., van Breugel, W., & Miley, G. K. 1991, ApJ, 370, 78 [NASA ADS] [CrossRef] [Google Scholar]
- Kashikawa, N., Aoki, K., Asai, R., et al. 2002, PASJ, 54, 819 [NASA ADS] [Google Scholar]
- Lacy, M., Baum, S. A., Chandler, C. J., et al. 2020, PASP, 132, 035001 [Google Scholar]
- Laursen, P., Sommer-Larsen, J., & Andersen, A. C. 2009, ApJ, 704, 1640 [Google Scholar]
- Lee, K., Kohno, K., Hatsukade, B., et al. 2023, ApJ, 944, 35 [Google Scholar]
- Lee, K., Akiyama, M., Kohno, K., et al. 2024, ApJ, 972, 111 [Google Scholar]
- Madau, P., & Dickinson, M. 2014, ARA&A, 52, 415 [Google Scholar]
- Matsuoka, K., Nagao, T., Maiolino, R., Marconi, A., & Taniguchi, Y. 2009, A&A, 503, 721 [NASA ADS] [CrossRef] [EDP Sciences] [Google Scholar]
- Matsuoka, K., Nagao, T., Maiolino, R., Marconi, A., & Taniguchi, Y. 2011, A&A, 532, L10 [NASA ADS] [CrossRef] [EDP Sciences] [Google Scholar]
- Matsuoka, K., Nagao, T., Marconi, A., et al. 2018, A&A, 616, L4 [NASA ADS] [CrossRef] [EDP Sciences] [Google Scholar]
- Miley, G., & De Breuck, C. 2008, A&AR, 15, 67 [Google Scholar]
- Nesvadba, N. P. H., De Breuck, C., Lehnert, M. D., Best, P. N., & Collet, C. 2017, A&A, 599, A123 [NASA ADS] [CrossRef] [EDP Sciences] [Google Scholar]
- Rawlings, S., Saunders, R., Eales, S. A., & Mackay, C. D. 1989, MNRAS, 240, 701 [NASA ADS] [Google Scholar]
- Rocca-Volmerange, B., Le Borgne, D., De Breuck, C., Fioc, M., & Moy, E. 2004, A&A, 415, 931 [NASA ADS] [CrossRef] [EDP Sciences] [Google Scholar]
- Saxena, A., Cryer, E., Ellis, R. S., et al. 2022, MNRAS, 517, 1098 [Google Scholar]
- Schaerer, D., Izotov, Y. I., Worseck, G., et al. 2022, A&A, 658, L11 [NASA ADS] [CrossRef] [EDP Sciences] [Google Scholar]
- Seymour, N., Stern, D., De Breuck, C., et al. 2007, ApJS, 171, 353 [CrossRef] [Google Scholar]
- Seymour, N., Ogle, P., De Breuck, C., et al. 2008, ApJ, 681, L1 [Google Scholar]
- Silva, M., Humphrey, A., Lagos, P., et al. 2017, MNRAS, 474, 3649 [Google Scholar]
- Spinrad, H., Marr, J., Aguilar, L., & Djorgovski, S. 1985, PASP, 97, 932 [CrossRef] [Google Scholar]
- Steidel, C. C., Erb, D. K., Shapley, A. E., et al. 2010, ApJ, 717, 289 [Google Scholar]
- Uchiyama, H., Yamashita, T., Toshikawa, J., et al. 2022, ApJ, 926, 76 [NASA ADS] [CrossRef] [Google Scholar]
- Venemans, B. P., Röttgering, H. J. A., Miley, G. K., et al. 2006, A&A, 461, 823 [Google Scholar]
- Verhamme, A., Schaerer, D., & Maselli, A. 2006, A&A, 460, 397 [NASA ADS] [CrossRef] [EDP Sciences] [Google Scholar]
- Villar-Martín, M., Humphrey, A., De Breuck, C., et al. 2007a, MNRAS, 375, 1299 [CrossRef] [Google Scholar]
- Villar-Martín, M., Sanchez, S. F., Humphrey, A., et al. 2007b, MNRAS, 378, 416 [CrossRef] [Google Scholar]
- Wang, W., Wylezalek, D., Vernet, J., et al. 2023, A&A, 680, A70 [NASA ADS] [CrossRef] [EDP Sciences] [Google Scholar]
- Wang, W., Yuan, Z., Yu, H., & Mao, J. 2024, A&A, 683, A174 [NASA ADS] [CrossRef] [EDP Sciences] [Google Scholar]
- Weilbacher, P. M., Palsa, R., Streicher, O., et al. 2020, A&A, 641, A28 [NASA ADS] [CrossRef] [EDP Sciences] [Google Scholar]
- Willott, C. J., Rawlings, S., Blundell, K. M., & Lacy, M. 1999, MNRAS, 309, 1017 [Google Scholar]
- Wylezalek, D., Galametz, A., Stern, D., et al. 2013, ApJ, 769, 79 [NASA ADS] [CrossRef] [Google Scholar]
Appendix A: Main analysis results
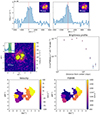 |
Fig. A.1. NVSS J151020-352803. Top: spectra extracted from the two Lyα regions (shown as the black circles in the narrow band images in the 10”×10” insets). Middle: on the left is shown the Lyα image extracted from the spectral region shown in the inset with superposed radio contours. The black contours mark the 2σ flux limits, and the blue cross is the point from which the brightness profile is extracted. On the right is shown the surface brightness profile. Bottom: Voronoi-tessellated maps of velocity and FWHM of the Lyα line. |
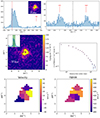 |
Fig. A.2. TXS 0952-217. Top: nuclear spectra centered on the Lyα (left) and CIV + HeII lines (right) extracted from the region shown as black circle in the inset. Middle left: Lyα image extracted from the spectral region shown in the 10”×10” inset. The black contours mark the 2σ flux limits, and the blue cross is the point from which the brightness profile is extracted. The location of the radio source, unresolved in the VLASS image, is marked with a red cross. Middle right: Lyα brightness profile. Bottom: Voronoi-tessellated maps of velocity and FWHM of the Lyα line. |
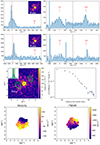 |
Fig. A.3. TN J1112-2948. First line, left: nuclear spectra in the Lyα spectral region extracted from a nuclear aperture of 1 |

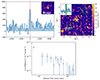 |
Fig. A.4. NVSS J095751-213321. Top: nuclear spectra (left) and Lyα narrowband image (right) extracted from the spectral region shown in the 10”×10” inset with superposed radio contours obtained from the VLASS image. The black contours mark the 2σ flux limits, and the blue cross is the point from which the brightness profile is extracted. Bottom: Lyα brightness profile. |
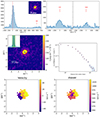 |
Fig. A.5. MRC 0251-273. Top: nuclear spectra centered on the Lyα (left) and CIV + HeII lines (right) extracted from the region shown as black circle in the inset. Middle: left, Lyα narrowband image extracted from the spectral region shown in the 10”×10” inset; right: Lyα brightness profile. The black contours mark the 2σ flux limits, and the blue cross is the point from which the brightness profile is extracted. The location of the radio source, unresolved in the VLASS image, is marked with a red cross. Bottom: Voronoi-tessellated maps of velocity and FWHM of the Lyα line. |
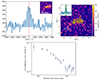 |
Fig. A.6. NVSS J094724-210505. Top: nuclear spectra (left) and Lyα narrowband image (right) extracted from the spectral region shown in the 10”×10” inset with superposed radio contours obtained from the VLASS image. The black contours mark the 2σ flux limits, and the blue cross is the point from which the brightness profile is extracted. Bottom: Lyα brightness profile. |
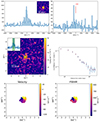 |
Fig. A.7. NVSS J095438-210425. Top: nuclear spectra centered on the Lyα (left) and CIV (right) extracted from the region shown as black circle in the inset. Middle: left, Lyα narrowband image extracted from the spectral region shown in the 10”×10” inset; right: Lyα brightness profile. The black contours mark the 2σ flux limits, and the blue cross is the point from which the brightness profile is extracted. The location of the radio source, unresolved in the VLASS image, is marked with a red cross. Bottom: Voronoi-tessellated maps of velocity and FWHM of the Lyα line. |
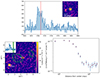 |
Fig. A.8. TN J1049-1258: Top: nuclear spectra centered on Lyα (left) and CIV (right). Bottom left: narrow band image (left) with superposed radio contours obtained from the VLASS image. The black contours mark the 2σ flux limits, and the blue cross is the point from which the brightness profile is extracted. Bottom right Lyα brightness profile. |
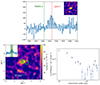 |
Fig. A.9. TN J0924-2201: Top: nuclear spectra centered on Lyα . The red dashed line corresponds to the redshift measured as the centre of the Lyα emission, while the green line corresponds to the centroid measurement of the [CII]λ158μm molecular line (Lee et al. 2024). Bottom: narrow band image (left) and Lyα brightness profile (right). The black contours mark the 2σ flux limits, and the blue cross is the point from which the brightness profile is extracted. While the radio emission is unresolved in the VLASS image, a higher resolution image (FWHM = 0 |


Appendix B: Notes on the individual sources.
- NVSS J151020-352803: z = 2.937. Radio morphology: asymmetric double lobe, extension of 8 2 with PA = -65°. This source shows in its Lyα emission a clear double lobed morphology, oriented in an east-west direction with a slight valley separating the two emission regions. The velocity difference between the Lyα centroids is ∼120 km s−1. There are no additional visible lines on either region. The direction, size and position of the radio emission coincide with the observed Lyα morphology, suggesting a relation between both emissions. There are various hypotheses which could explain the morphology of this source, for instance, a recent merger with another massive object which has strongly disturbed the galactic morphology. In this post-merger state, the relative velocities of both sources have come close to zero as they spiral towards one another. Another possibility would be the presence of a very dense region of neutral HI gas along the line of sight, located in the center of the source, absorbing Lyα photons and creating the illusion of a double lobe morphology, or possibly a dust lane. Given the shape of the emission lines, there are clear signatures of absorption in the spectra of both lobes, so this is a strong possibility as well. However, the spatial correlation between radio and ionized emission suggests a nuclear origin for the large scale morphology of the Lyα emission. This final hypothesis could very well be connected to a prior merger, as it is a well-known AGN triggering mechanism. It remains unclear which of these hypotheses best explains our observations.
- TXS 0952-217: z = 2.942±0.001 from HeIIλ1640. Radio morphology: point source, upper limit to its deconvolved size is 1.2”. The second-brightest source in our sample, TXS 0952-217 presents a highly absorbed Lyα profile that changes along the spatial extension of the nebula. This source was the object of study in Coloma Puga et al. (2024), where an extended outflow of ionized gas was found via modeling of the observed emission profile. CIV, HeII, and CIII] are also observed, obtaining a robust redshift measurement as well as several line ratios, which were consistent with an AGN origin, as no clear signs of enhanced star formation were observed. While both the galaxy and outflow are extended (∼25 kpc for the galaxy and ∼20 kpc for the outflow), the radio source is point-like. The kinematics of the host do not suggest orderly motion, but this might be the result of a very limited S/N.
- TN J1112-2948: z = 3.089±0.001 from HeIIλ1640. Radio morphology; double lobe, extension of 10″, PA = -45°. This object presents a heavily absorbed Lyα profile, as is made apparent by the various peaks and valleys on the red side of the line, and the extremely narrow emission peak given how wide the total line profile is. CIV and HeII are also detected. The Lyα morphology is quite complex in this object. It is the only object beside TN 1049-1258 for which we confirmed the presence of a close companion galaxy, ∼30 kpc southeast of the host. In the companion we detect the same ionized lines as in the host, although the detection of CIV is borderline. Both the narrow width of the lines and the line ratio between Lyα and HeII indicate this companion is a quiescent galaxy displaying no signs of nuclear activity. In addition, there is a filament of ionized gas north of the host galaxy, which is only visible in Lyα emission. The very elongated morphology of this emission suggests it may be part of the extended nebula instead of an additional companion, as well as the fact that no helium or carbon lines are detected. There is no detectable continuum emission on any of the sources, likely caused in part by contamination due to the presence of a magnitude 7 star, HD 97412, slightly outside the northwest corner of the image.
- NVSS J095751-213321: z = 3.126. Radio morphology: double lobe, extension of 16″, PA = -45°. Only a small region of Lyα emission is detected in this source. The morphology of the Lyα emission appears clumpy and very faint, almost certainly the result of resonant scattering. The emission is extremely narrow (FWHM = 325±43 km s−1) compared to the typical widths for RGs at this redshift, and by far the narrowest in our sample or W23+, which confirms the presence of intervening gas along our line of sight. No other lines are observed and no companions are found in the MUSE field. The radio emission, which displays a very large double lobe in the SE-NW direction, appears to be entirely disconnected from the ionized gas, although deeper observations will be necessary in order to ascertain the true extent of the nebula.
- MRC 0251-273: z = 3.163±0.001 from the He line. Radio morphology: point source. The brightest object in our sample, it displays relatively compact and symmetric Lyα emission, and very compact NV, CIV and HeII emission. This object displays a high Lyα /HeII flux ratio of ∼16; values this high have been previously associated with enhanced star formation (Villar-Martín et al. 2007a). The kinematic analysis of the Lyα emission yields widths in the order of 103 km s−1, and its velocity field is suggestive of a rotating disk.
- NVSS J094724-210505: z = 3.374±0.001 from Lyα . Radio morphology: asymmetric double lobe, extension of 4.1”, PA = -76°. From its Lyα emission, this object appears to be the largest among those observed in this sample, with a projected extension of about 70 kpc in the E-W direction. Similarly to NVSS J151020-352803, the radio and Lyα emission appear to be cospatial, although the true extent of the ionized nebula is difficult to parse given how faint it appears. No other lines are observed in its spectrum, and the width of the Lyα profile is within normal bounds for HzRGs (FWHM = 870±90 km s−1).
- NVSS J095438-210425: z = 3.431. Radio morphology: point source. Relatively compact and faint Lyα emission. Out of the other ionized lines, only CIV is visible; as it is also a resonant line as well as a doublet, it does not necessarily yield a more robust systemic redshift measurement. The rotation of the ionized gas is clear in spite of its intrinsic faintness, suggesting that the observed emission corresponds to a galactic disk. The line emission appears to be quite narrow when compared to the rest of the sample, likely due to intervening gas, which is visible in the many absorption troughs present in the nuclear spectrum. Given the upper bound of HeII flux, which appears to be right under the detection threshold, CIV seems to be at minimum 4 times brighter. This is an outlier in our sample, as we generally observe the CIV/HeII to hover close to 1.
- TN J1049-1258: z = 3.697. Radio morphology: asymmetric double lobe, extension of 10”, PA is -80°. This source consists of what appear to be two distinct patches of Lyα emission. The RG itself, identified by its position relative to the radio emission as well as by virtue of being the brightest emission line source, only presents Lyα emission. Slightly displaced both in the spatial and frequency domains, there is an extended patch of emission west of the RG and aligned with the radio axis, for which Lyα and HeII are visible. There are various possibilities for the origin of this emission, including a companion galaxy and an outflow of ionized gas. The source is also embedded within what appears to be a protocluster, with two other separate Lyα emission galaxies situated at 60 pkpc and 25 pkpc. A deeper study of both the nature of the extended emission as well as the environment of this source was performed in Coloma Puga et al. (2023).
-TN J0924-2201: z = 5.197. Radio morphology: double source, ″1.4 in size at PA 75. At a redshift of ∼5.2 it is the farthest source in our sample, and one of the highest redshift HzRGs found to date. Lyα is barely detectable by integrating the whole emission of the galaxy. It appears very compact, as it is the only nebula which cannot be spatially resolved due to being smaller or around the size of the seeing. The line profile is in agreement with what is generally observed in HzRGS (FWHM = 880±170 km s−1). Lee et al. (2024) detected high S/N [CII]λ158μm emission which yielded a redshift of z = 5.1736±0.0002, corresponding to an offset of ∼103 km s−1 between Lyα and the systemic redshift, the largest observed to date. This suggests that the Lyα emission from this source is extremely absorbed given that, both in our observations with MUSE and those performed by Matsuoka et al. (2011) with FOCAS at Subaru (Kashikawa et al. 2002), no flux is detectable at the theoretical line center of Lyα . The actual ionized emission from this galaxy is likely much higher, but the low S/N of the ionized line observations, along with the implicit degeneracies between HI column density and intrinsic line flux, make it impossible to ascertain the extent of the effects of resonant scattering given the currently available data. Companion CO(1–0) has been detected from galaxies close to this source (Lee et al. 2023), but none of these emitters are visible in the MUSE image, neither in continuum nor Lyα . CIV was also detected by Matsuoka et al. 2011, but, along with HeII and CIII], falls outside of our spectral coverage with MUSE given the object's very high systemic redshift.
Appendix C: Undetected sources
In two of 11 sources observed, Lyα emission was not detected anywhere within the MUSE data. They are NVSS J021308-322338 (z = 3.976±0.001, identified by de Breuck et al. 2004) and TN J1123-2154 (z = 4.109±0.004, identified by De Breuck et al. 2001). In order to obtain an upper bound to their fluxes, we placed two synthetic apertures with a radius of 1 2 at the nominal centers of the radio structure. The spectra extracted at these locations are shown in Fig. C.1..
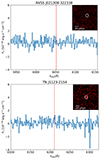 |
Fig. C.1. Nuclear spectra of NVSS J021308-322338 (left) and TN J1123-2154 (right) extracted using a circular synthetic aperture with a radius of 1 |

For NVSS J021308-322338, the flux reported by de Breuck et al. 2004 is (0.16±0.02)×10−16 erg s−1 cm−2. The 3σ upper bound to the Lyα flux (centered at the wavelength of the reported detection) we obtain for this source based on the MUSE data is FLyα <0.08×10⁻¹⁶ erg s−1 cm−2. This measurement has been obtained adopting a conservative value for the integration range in wavelength corresponding to 1,000 km s−1. For TN J1123-2154, the 3σ upper bound is 0.07×10⁻¹⁶ erg s−1 cm−2, whilst the flux observed by de Breuck et al. 2004 is (0.18±0.05)×10−16 erg s−1 cm−2. In conclusion, we can not confirm the identification of these two sources as HzRGs.
All Tables
Geometrical properties of the Lyα nebulae and radio emission of the sources for which both are resolved.
All Figures
|
Fig. 1. NVSS J151020-352803. Top: Spectra extracted from the two Lyα regions (shown as black circles in the narrowband images in the insets). The dashed red line represents the systemic redshift taken from the Lyα centroid. Middle: On the left is the Lyα image extracted from the spectral region shown in the inset with superposed radio contours obtained from the VLASS image. Black contours mark the 2σ flux limits, and the blue cross is the point from which the brightness profile is extracted. On the right is the surface brightness profile. Bottom: Voronoi-tessellated maps of velocity and FWHM of the Lyα line. |
| In the text | |
|
Fig. 2. Redshift-corrected surface brightness curves for all the observed objects within our sample as well as those studied by Wang et al. (2023) (dashed lines) and Arrigoni-Battaia et al. (2018) (average indicated by the solid blue-shaded area with a dashed line). On the right side Y-axis, we report the different background level estimated for each individual source. |
| In the text | |
|
Fig. 3. Total Lyα luminosity vs radio power at 500 MHz. We added the measurements from Wang et al. (2023), marked as black crosses, to those of our sample (colored symbols). The red line represents the best linear fit to our data only, while the black line displays the fit to the combined sample. |
| In the text | |
|
Fig. 4. Left: Offset between the PA of the radio and the Lyα structures. The orange histogram refers to the sources in our sample, while the blue histogram also includes those from Wang et al. (2023). Right: Nebular ellipticity e vs PA offset. |
| In the text | |
|
Fig. A.1. NVSS J151020-352803. Top: spectra extracted from the two Lyα regions (shown as the black circles in the narrow band images in the 10”×10” insets). Middle: on the left is shown the Lyα image extracted from the spectral region shown in the inset with superposed radio contours. The black contours mark the 2σ flux limits, and the blue cross is the point from which the brightness profile is extracted. On the right is shown the surface brightness profile. Bottom: Voronoi-tessellated maps of velocity and FWHM of the Lyα line. |
| In the text | |
|
Fig. A.2. TXS 0952-217. Top: nuclear spectra centered on the Lyα (left) and CIV + HeII lines (right) extracted from the region shown as black circle in the inset. Middle left: Lyα image extracted from the spectral region shown in the 10”×10” inset. The black contours mark the 2σ flux limits, and the blue cross is the point from which the brightness profile is extracted. The location of the radio source, unresolved in the VLASS image, is marked with a red cross. Middle right: Lyα brightness profile. Bottom: Voronoi-tessellated maps of velocity and FWHM of the Lyα line. |
| In the text | |
|
Fig. A.3. TN J1112-2948. First line, left: nuclear spectra in the Lyα spectral region extracted from a nuclear aperture of 1 |
| In the text | |
|
Fig. A.4. NVSS J095751-213321. Top: nuclear spectra (left) and Lyα narrowband image (right) extracted from the spectral region shown in the 10”×10” inset with superposed radio contours obtained from the VLASS image. The black contours mark the 2σ flux limits, and the blue cross is the point from which the brightness profile is extracted. Bottom: Lyα brightness profile. |
| In the text | |
|
Fig. A.5. MRC 0251-273. Top: nuclear spectra centered on the Lyα (left) and CIV + HeII lines (right) extracted from the region shown as black circle in the inset. Middle: left, Lyα narrowband image extracted from the spectral region shown in the 10”×10” inset; right: Lyα brightness profile. The black contours mark the 2σ flux limits, and the blue cross is the point from which the brightness profile is extracted. The location of the radio source, unresolved in the VLASS image, is marked with a red cross. Bottom: Voronoi-tessellated maps of velocity and FWHM of the Lyα line. |
| In the text | |
|
Fig. A.6. NVSS J094724-210505. Top: nuclear spectra (left) and Lyα narrowband image (right) extracted from the spectral region shown in the 10”×10” inset with superposed radio contours obtained from the VLASS image. The black contours mark the 2σ flux limits, and the blue cross is the point from which the brightness profile is extracted. Bottom: Lyα brightness profile. |
| In the text | |
|
Fig. A.7. NVSS J095438-210425. Top: nuclear spectra centered on the Lyα (left) and CIV (right) extracted from the region shown as black circle in the inset. Middle: left, Lyα narrowband image extracted from the spectral region shown in the 10”×10” inset; right: Lyα brightness profile. The black contours mark the 2σ flux limits, and the blue cross is the point from which the brightness profile is extracted. The location of the radio source, unresolved in the VLASS image, is marked with a red cross. Bottom: Voronoi-tessellated maps of velocity and FWHM of the Lyα line. |
| In the text | |
|
Fig. A.8. TN J1049-1258: Top: nuclear spectra centered on Lyα (left) and CIV (right). Bottom left: narrow band image (left) with superposed radio contours obtained from the VLASS image. The black contours mark the 2σ flux limits, and the blue cross is the point from which the brightness profile is extracted. Bottom right Lyα brightness profile. |
| In the text | |
|
Fig. A.9. TN J0924-2201: Top: nuclear spectra centered on Lyα . The red dashed line corresponds to the redshift measured as the centre of the Lyα emission, while the green line corresponds to the centroid measurement of the [CII]λ158μm molecular line (Lee et al. 2024). Bottom: narrow band image (left) and Lyα brightness profile (right). The black contours mark the 2σ flux limits, and the blue cross is the point from which the brightness profile is extracted. While the radio emission is unresolved in the VLASS image, a higher resolution image (FWHM = 0 |
| In the text | |
|
Fig. C.1. Nuclear spectra of NVSS J021308-322338 (left) and TN J1123-2154 (right) extracted using a circular synthetic aperture with a radius of 1 |
| In the text | |
Current usage metrics show cumulative count of Article Views (full-text article views including HTML views, PDF and ePub downloads, according to the available data) and Abstracts Views on Vision4Press platform.
Data correspond to usage on the plateform after 2015. The current usage metrics is available 48-96 hours after online publication and is updated daily on week days.
Initial download of the metrics may take a while.