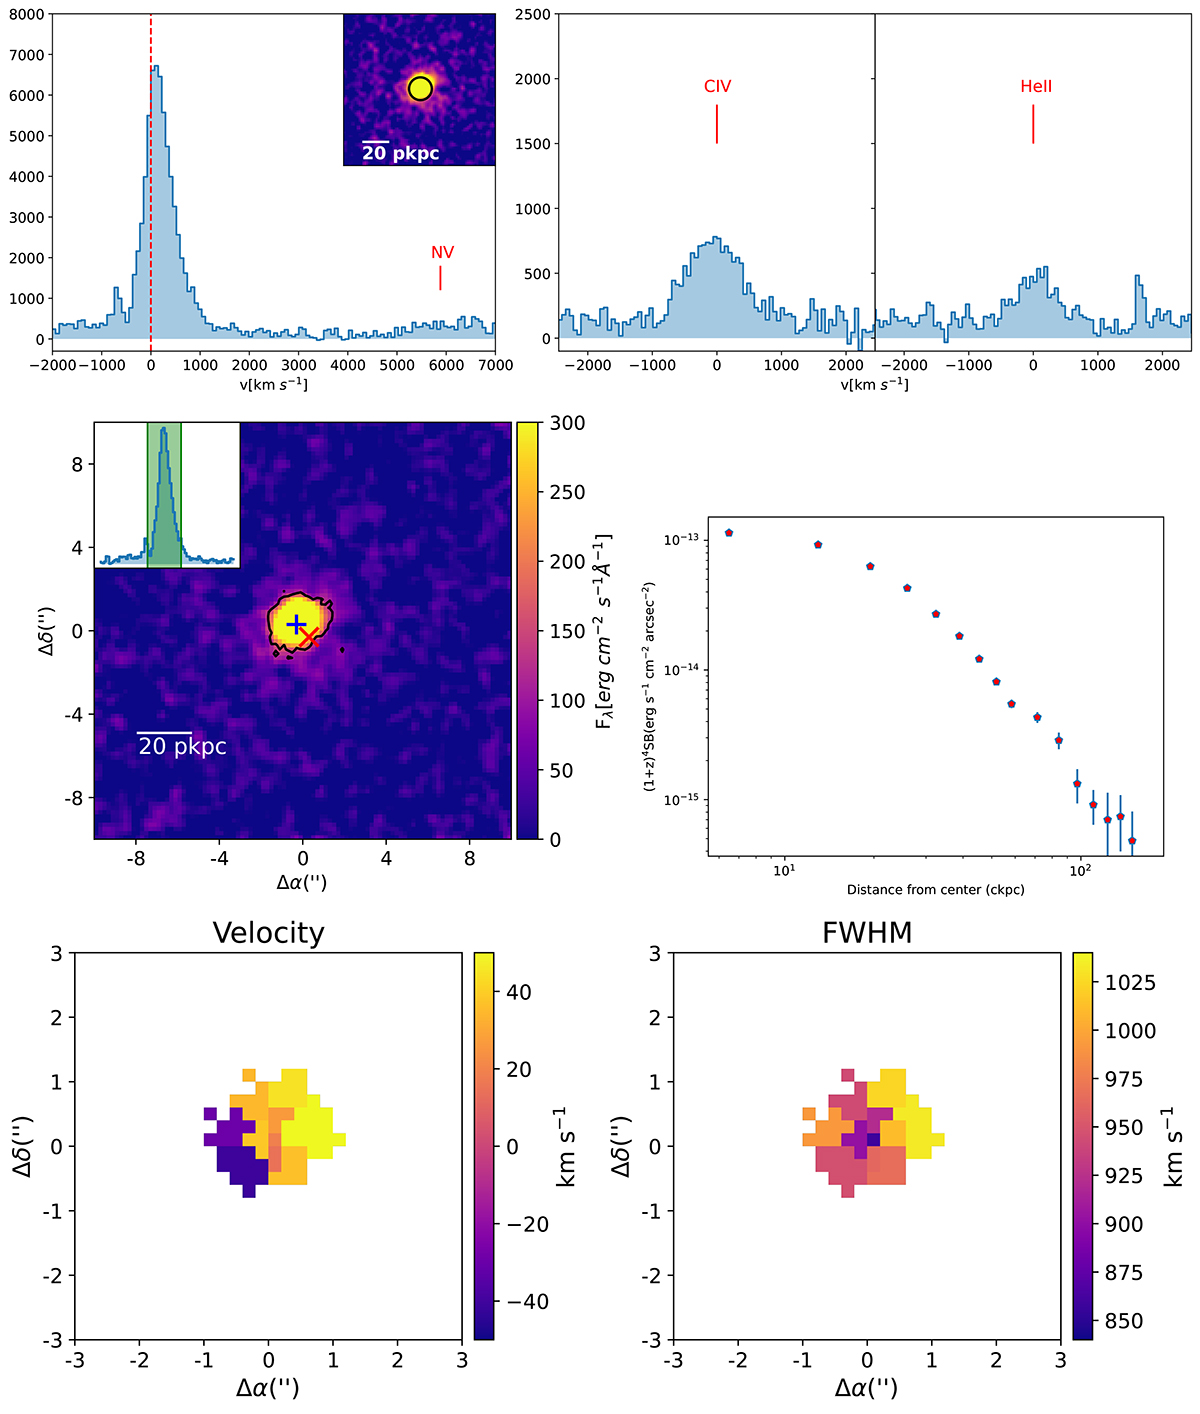
Fig. A.5.
Download original image
MRC 0251-273. Top: nuclear spectra centered on the Lyα (left) and CIV + HeII lines (right) extracted from the region shown as black circle in the inset. Middle: left, Lyα narrowband image extracted from the spectral region shown in the 10”×10” inset; right: Lyα brightness profile. The black contours mark the 2σ flux limits, and the blue cross is the point from which the brightness profile is extracted. The location of the radio source, unresolved in the VLASS image, is marked with a red cross. Bottom: Voronoi-tessellated maps of velocity and FWHM of the Lyα line.
Current usage metrics show cumulative count of Article Views (full-text article views including HTML views, PDF and ePub downloads, according to the available data) and Abstracts Views on Vision4Press platform.
Data correspond to usage on the plateform after 2015. The current usage metrics is available 48-96 hours after online publication and is updated daily on week days.
Initial download of the metrics may take a while.