Fig. A.9.
Download original image
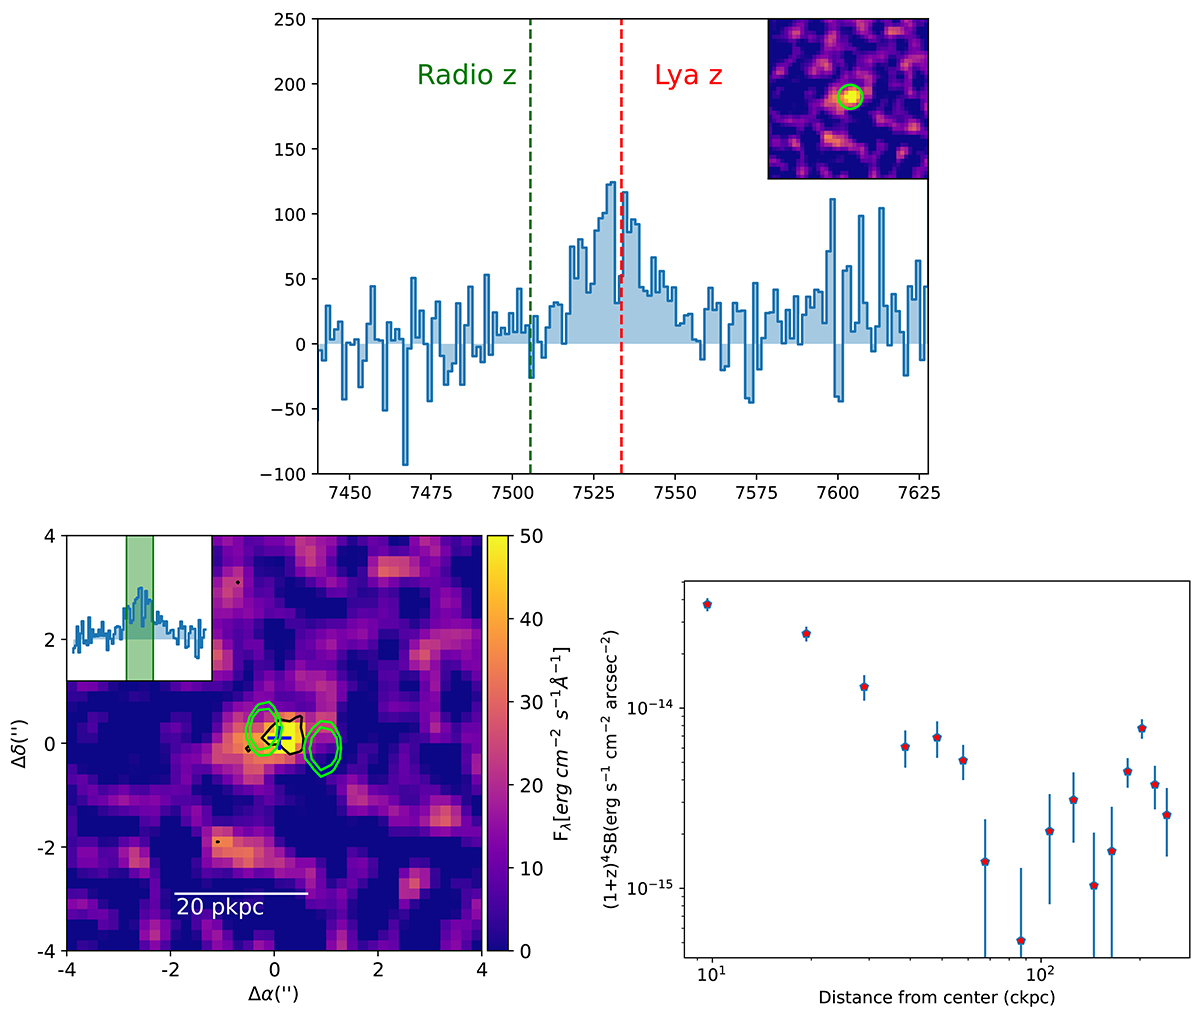
TN J0924-2201: Top: nuclear spectra centered on Lyα . The red dashed line corresponds to the redshift measured as the centre of the Lyα emission, while the green line corresponds to the centroid measurement of the [CII]λ158μm molecular line (Lee et al. 2024). Bottom: narrow band image (left) and Lyα brightness profile (right). The black contours mark the 2σ flux limits, and the blue cross is the point from which the brightness profile is extracted. While the radio emission is unresolved in the VLASS image, a higher resolution image (FWHM = 0![]() 49) at 8.5 GHz shows two components separated by 1
49) at 8.5 GHz shows two components separated by 1![]() 2, oriented at PA∼70°.
2, oriented at PA∼70°.
Current usage metrics show cumulative count of Article Views (full-text article views including HTML views, PDF and ePub downloads, according to the available data) and Abstracts Views on Vision4Press platform.
Data correspond to usage on the plateform after 2015. The current usage metrics is available 48-96 hours after online publication and is updated daily on week days.
Initial download of the metrics may take a while.