Fig. A.3.
Download original image
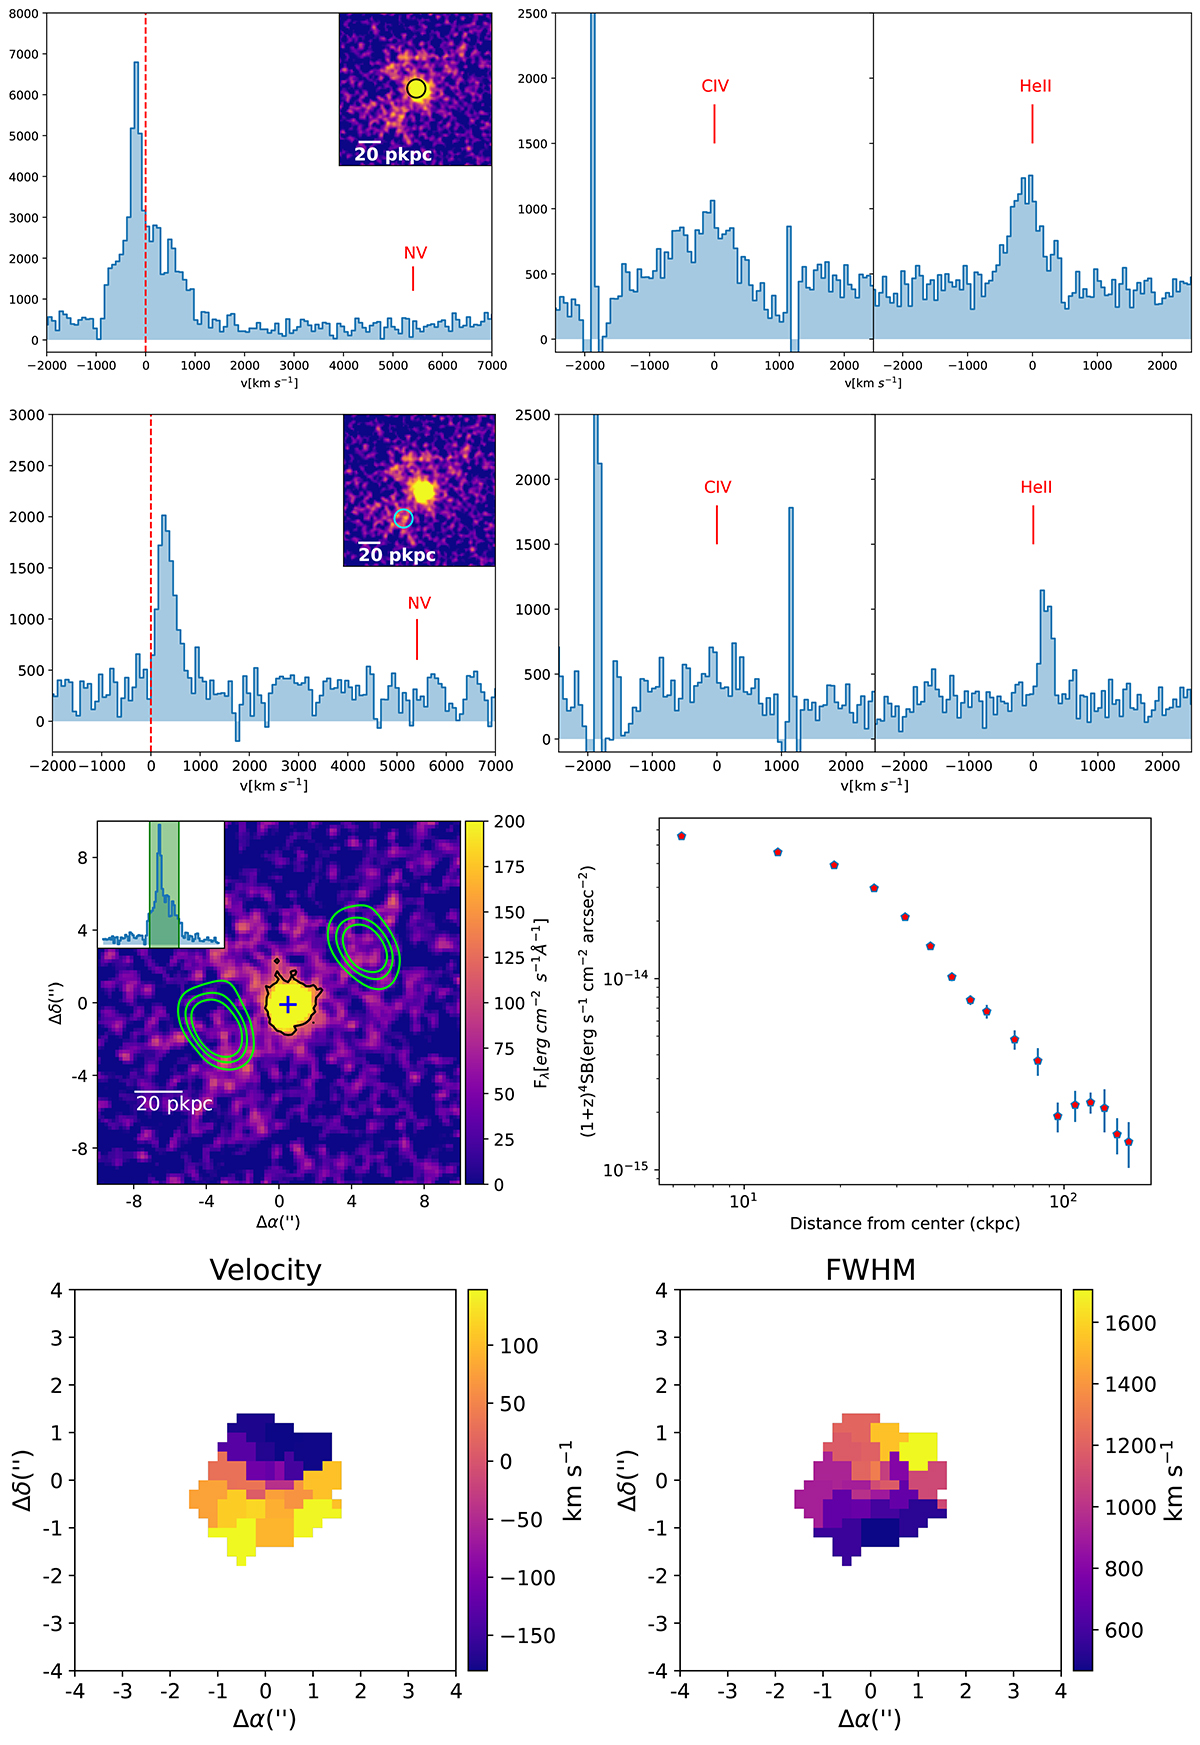
TN J1112-2948. First line, left: nuclear spectra in the Lyα spectral region extracted from a nuclear aperture of 1![]() 2 radius (shown as the black circle in the narrow band image in the 20”×20” inset) with the velocity scale based on the redshift measured from the He II line. On the right, nuclear spectrum in the C IV and He II spectral region. Second line: same as the first for the companion galaxy. Third line, left: narrow band image extracted from the spectral range shown in the inset centered on the Lyα line with superposed radio contours. The black contours mark the 2σ flux limits, and the blue cross is the point from which the brightness profile is extracted. On the right, Lyα brightness profile. Fourth line: Voronoi-tessellated maps of velocity and FWHM of the Lyα line.
2 radius (shown as the black circle in the narrow band image in the 20”×20” inset) with the velocity scale based on the redshift measured from the He II line. On the right, nuclear spectrum in the C IV and He II spectral region. Second line: same as the first for the companion galaxy. Third line, left: narrow band image extracted from the spectral range shown in the inset centered on the Lyα line with superposed radio contours. The black contours mark the 2σ flux limits, and the blue cross is the point from which the brightness profile is extracted. On the right, Lyα brightness profile. Fourth line: Voronoi-tessellated maps of velocity and FWHM of the Lyα line.
Current usage metrics show cumulative count of Article Views (full-text article views including HTML views, PDF and ePub downloads, according to the available data) and Abstracts Views on Vision4Press platform.
Data correspond to usage on the plateform after 2015. The current usage metrics is available 48-96 hours after online publication and is updated daily on week days.
Initial download of the metrics may take a while.