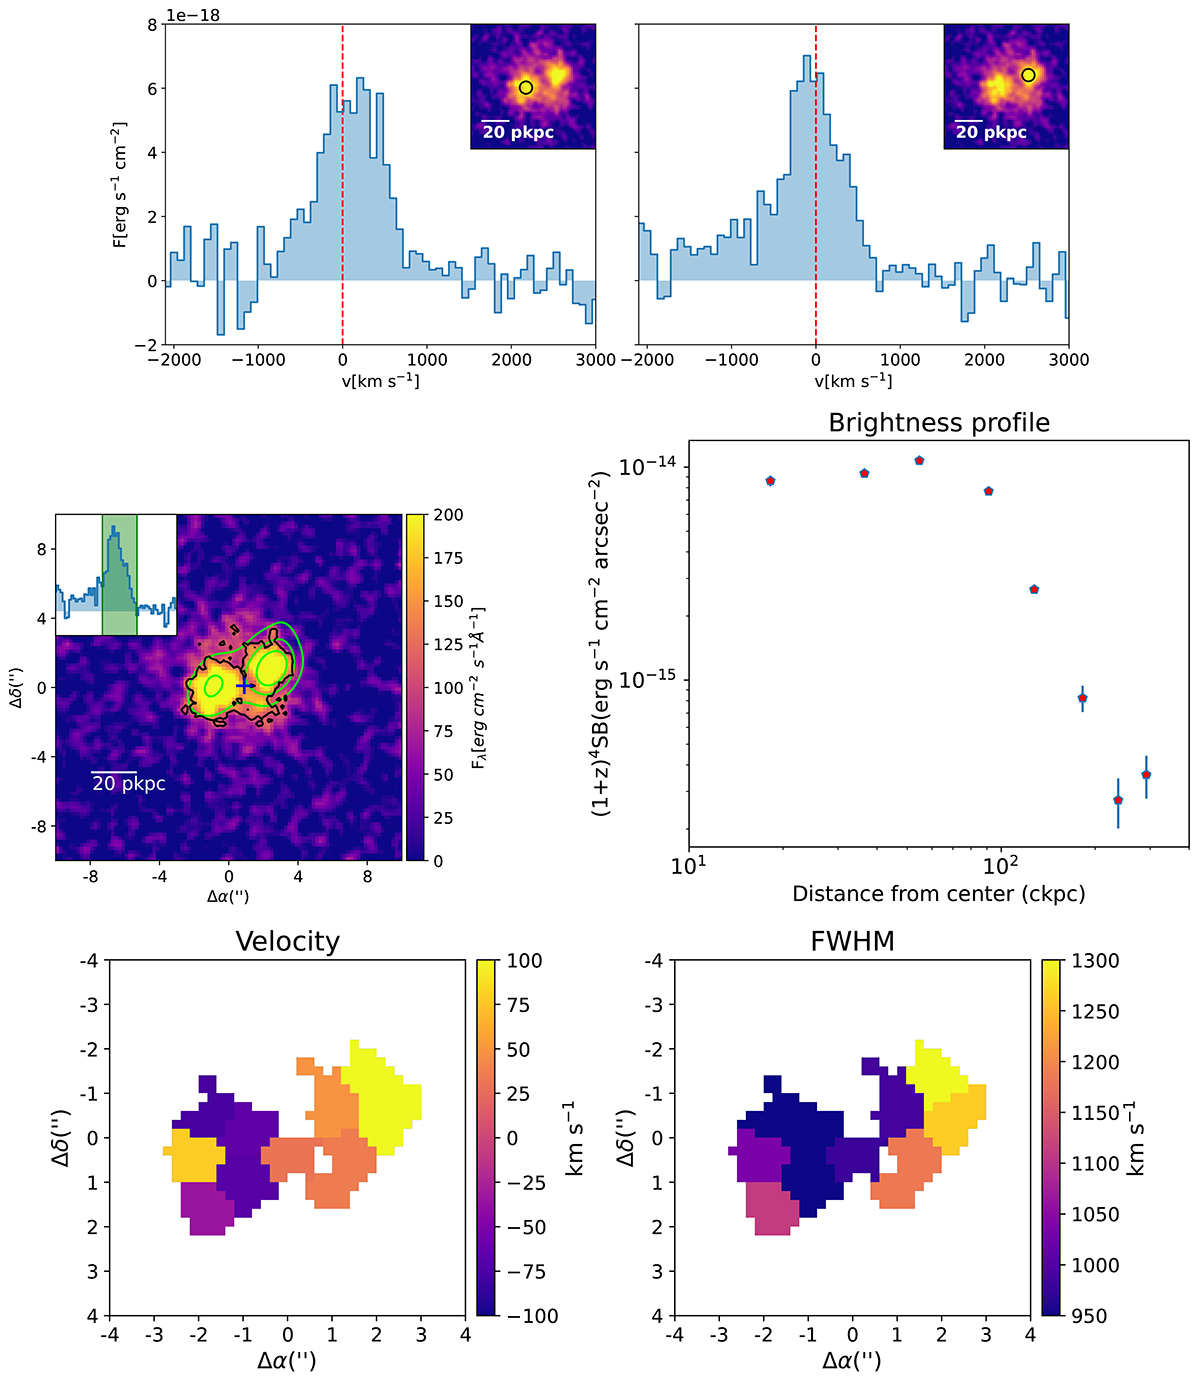
Fig. A.1.
Download original image
NVSS J151020-352803. Top: spectra extracted from the two Lyα regions (shown as the black circles in the narrow band images in the 10”×10” insets). Middle: on the left is shown the Lyα image extracted from the spectral region shown in the inset with superposed radio contours. The black contours mark the 2σ flux limits, and the blue cross is the point from which the brightness profile is extracted. On the right is shown the surface brightness profile. Bottom: Voronoi-tessellated maps of velocity and FWHM of the Lyα line.
Current usage metrics show cumulative count of Article Views (full-text article views including HTML views, PDF and ePub downloads, according to the available data) and Abstracts Views on Vision4Press platform.
Data correspond to usage on the plateform after 2015. The current usage metrics is available 48-96 hours after online publication and is updated daily on week days.
Initial download of the metrics may take a while.