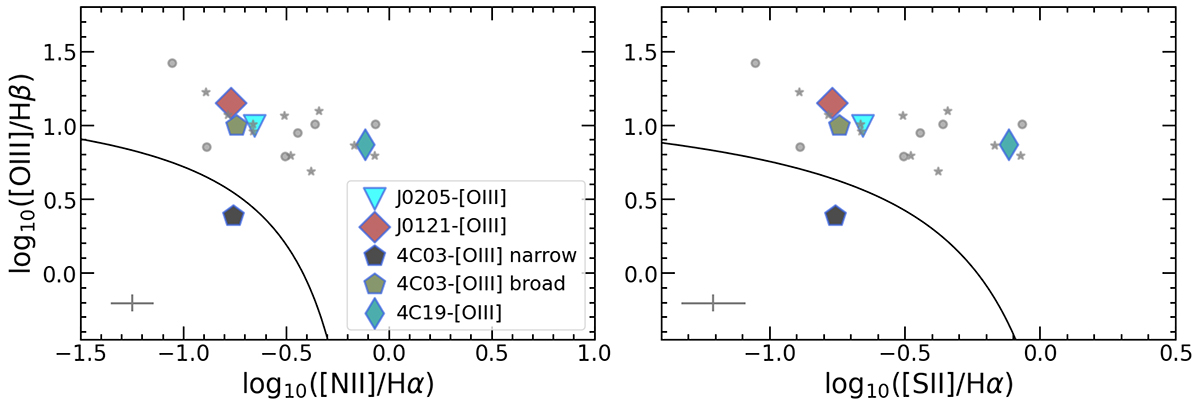
Fig. 12.
Download original image
Line ratio diagnostic diagrams for the individual kinetic components from the q3dfit 1D spectral fitting at the [O III] companion and radio core positions. We highlight the emission components of [O III] companions with larger symbols filled with same colors as used in Figs. 1c, 5c, 7c, and 9c. The other kinetic components at radio core and companion positions are shown with smaller gray stars and dots, respectively. The black curves are the empirical classifications that separate quiescent galaxies (lower left) from AGN (above this line) (Kewley et al. 2006). Typical errors are shown in the bottom left corner.
Current usage metrics show cumulative count of Article Views (full-text article views including HTML views, PDF and ePub downloads, according to the available data) and Abstracts Views on Vision4Press platform.
Data correspond to usage on the plateform after 2015. The current usage metrics is available 48-96 hours after online publication and is updated daily on week days.
Initial download of the metrics may take a while.