Fig. 1.
Download original image
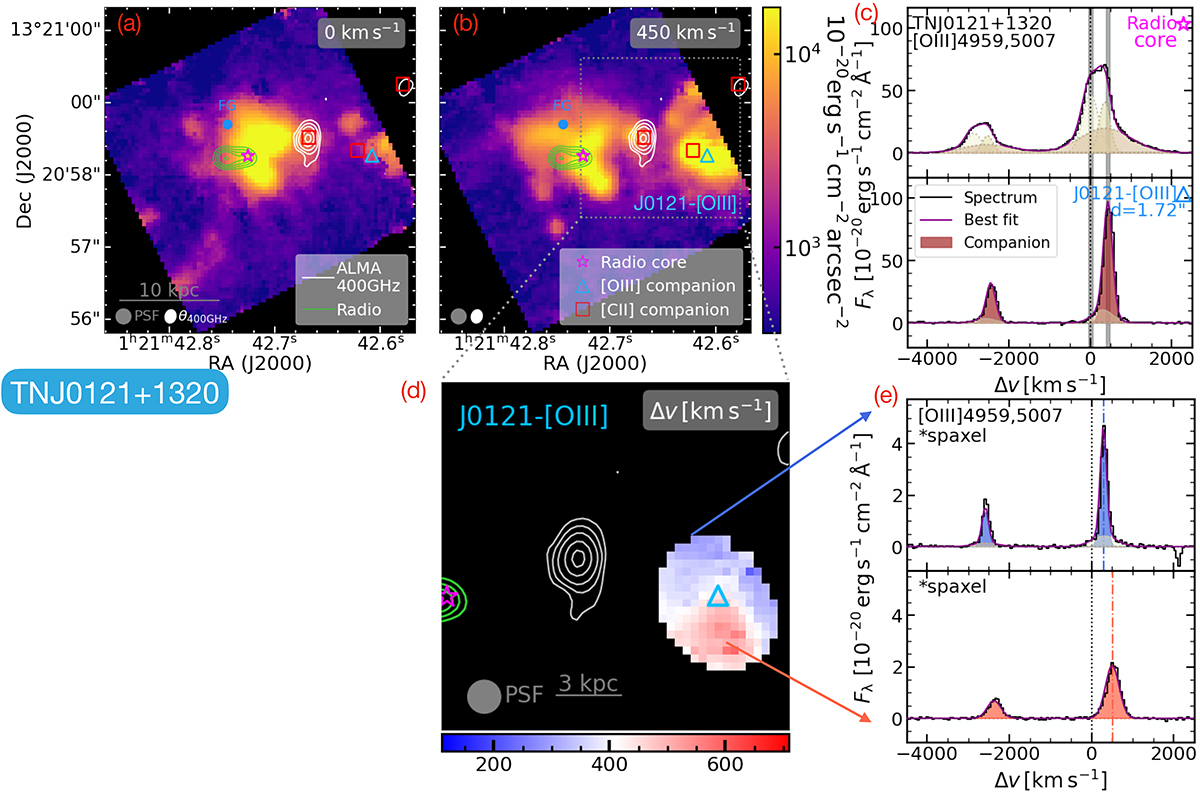
Emission line maps and spectra of TN J0121+1320 showing the [O III] companion search. (a, b): [O III]5007 channel maps. Each map is integrated over three consecutive wavelength channels (i.e., ∼150 km s−1). The central velocity is marked at the top right corner. We mark the position of the radio AGN with a magenta star. The position of [O III] companion and the [C II] companions are marked by a blue triangle and red square, respectively. The position of the foreground galaxy is marked with a blue dot. The ALMA 400 GHz continuum is shown as white contours (levels of [0.35, 0.63, 1.1, 2.0, 3.0] mJy beam−1). The 8 GHz radio emission is shown as green contours. We illustrate the sizes of the NIRSpec IFU PSF (gray) and the synthesized beam of ALMA 400 GHz (θ400 GHz white) at the bottom left of each panel. (c): [O III]4959, 5007 spectra at the positions of the radio AGN (upper) and J0121-[O III] (lower). These continuum-subtracted spectra were extracted using r = 0.1″ apertures. The best fits from q3dfit are in dark magenta. Different Gaussian components are shown in shaded colors. The fitted Gaussian component of J0121-[O III] is highlighted in dark red. The vertical shaded regions mark the velocity ranges where the channel maps in panels (a, b) are integrated. The projected distance between the [O III] companion and radio core is marked at the top right corner of the lower panel. (d): Velocity map of J0121-[O III] constructed from the q3dfit fitting. The markers and contours are the same as in panels (a, b). (e): Example [O III]4959, 5007 spectra from two spaxels showcasing the different kinematics across J0121-[O III]. The Gaussian components are highlighted in blue and red for bluer and redder Δv, respectively.
Current usage metrics show cumulative count of Article Views (full-text article views including HTML views, PDF and ePub downloads, according to the available data) and Abstracts Views on Vision4Press platform.
Data correspond to usage on the plateform after 2015. The current usage metrics is available 48-96 hours after online publication and is updated daily on week days.
Initial download of the metrics may take a while.