Fig. 4.
Download original image
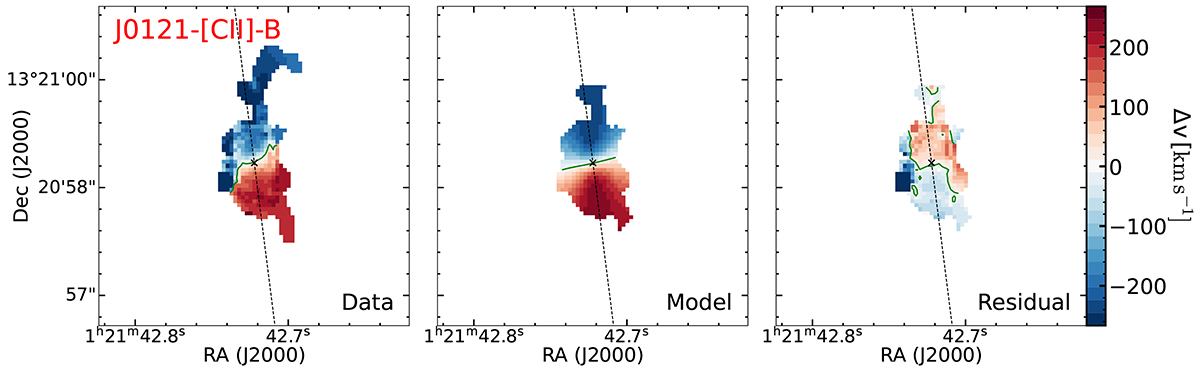
Moment 1 (line-of-sight velocity) map of 3DBAROLO [C II] fit to J0121-[C II]-B. The data, model, and residual are shown in the left, middle, and right panels, respectively. The black cross marks the kinematic center. The black dashed line indicates the kinematic major axis. The green contours mark zero velocity, which has a Δv = 114 km s−1 offset between the systemic redshift (Table 1).
Current usage metrics show cumulative count of Article Views (full-text article views including HTML views, PDF and ePub downloads, according to the available data) and Abstracts Views on Vision4Press platform.
Data correspond to usage on the plateform after 2015. The current usage metrics is available 48-96 hours after online publication and is updated daily on week days.
Initial download of the metrics may take a while.