Open Access
Fig. C.3.
Download original image
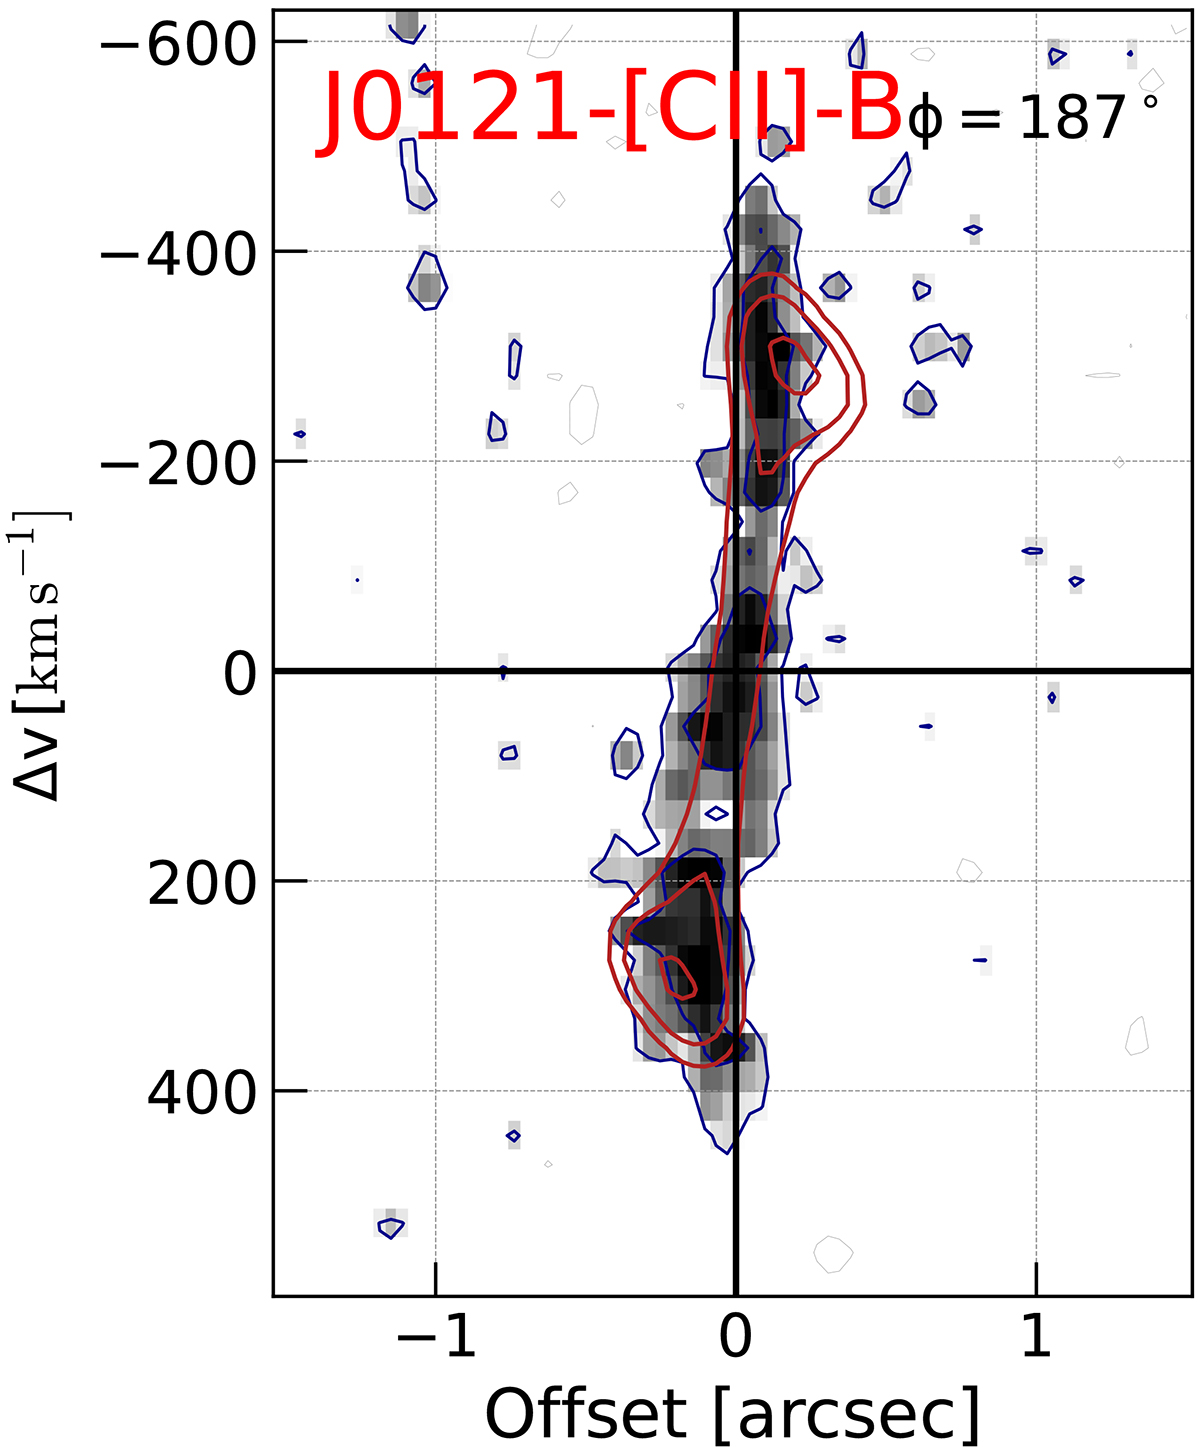
Position velocity diagram of J0121-[C II]-B from 3DBAROLO along kinematic major axis (black dashed line in Fig. 4). The gray scale maps and blue contours show the data. Red contours show the model.
Current usage metrics show cumulative count of Article Views (full-text article views including HTML views, PDF and ePub downloads, according to the available data) and Abstracts Views on Vision4Press platform.
Data correspond to usage on the plateform after 2015. The current usage metrics is available 48-96 hours after online publication and is updated daily on week days.
Initial download of the metrics may take a while.