Fig. 2.
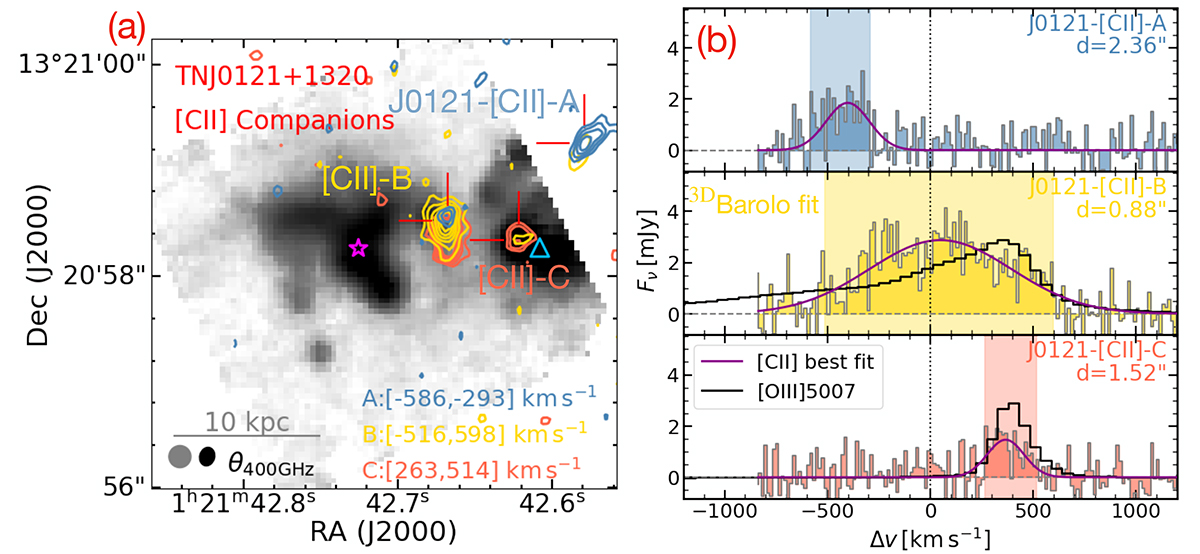
Download original image
Emission line maps and spectra of TN J0121+1320 showing evidence of [C II] companion detection. (a): [C II] moment 0 maps in contours integrated at different channels as indicated in the bottom right corner. The contours are given in [3, 4, 5, …] × σ levels, where σ is the rms noise of the map. We note that only odd σ levels are used for [C II]-B for better visualization. The gray scale background image is the same as Fig. 1b. The red open crosses mark the positions of the [C II] companions, i.e., the same as the red boxes in Fig. 1. (b): [C II] spectra extracted at the [C II] companion positions. The vertical shaded regions mark the velocity ranges where the moment 0 maps in panel (a) are integrated. The single Gaussian fit of [C II] spectra are shown as dark magenta curves. Where available, we show the [O III]5007 spectra in black in arbitrary units extracted at the same position with the same aperture as the [C II] companion. We mark the projected distance between the [C II] and the radio core at the top right corners.
Current usage metrics show cumulative count of Article Views (full-text article views including HTML views, PDF and ePub downloads, according to the available data) and Abstracts Views on Vision4Press platform.
Data correspond to usage on the plateform after 2015. The current usage metrics is available 48-96 hours after online publication and is updated daily on week days.
Initial download of the metrics may take a while.