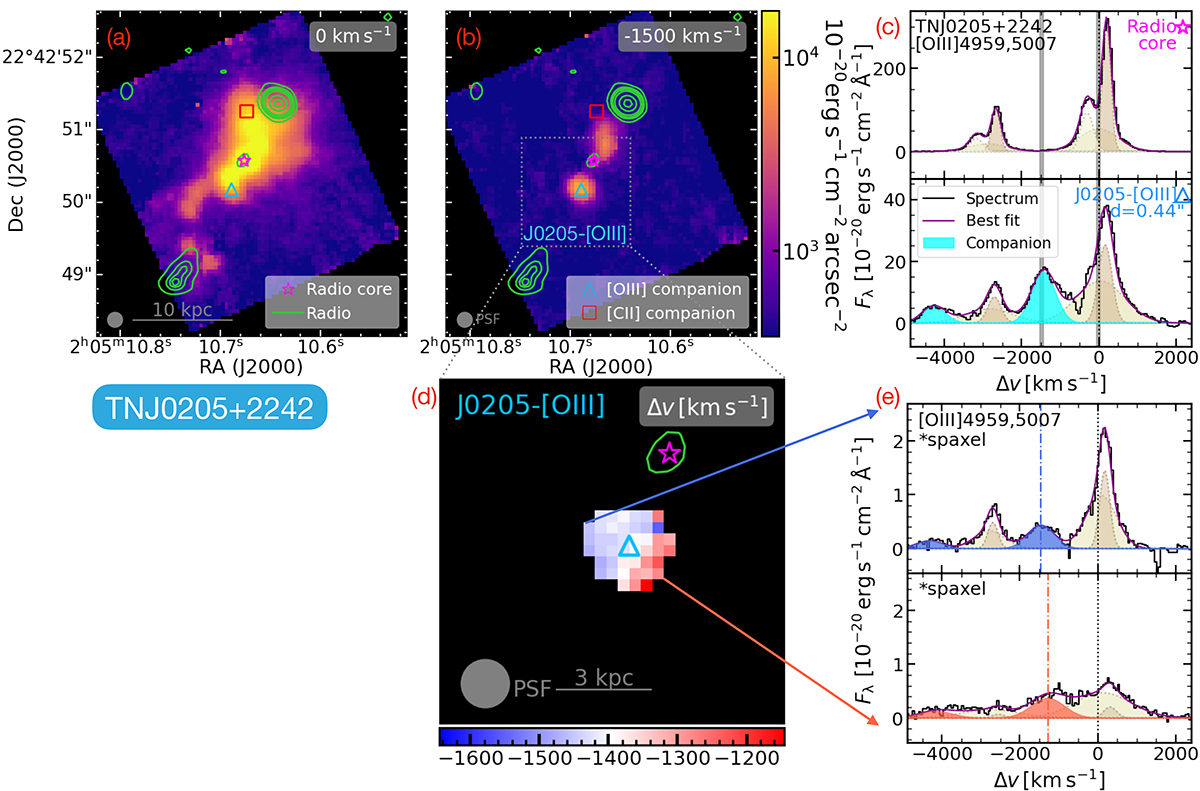
Fig. 5.
Download original image
Similar to Fig. 1, emission line maps and spectra of TN J0205+2242 showing the [O III] companion search. The northern [O III]5007 emission blob in panel (b) could be an outflowing component spectrally related to radio core. The Gaussian fit to [O III] for J0205-[O III] is highlighted in cyan in panel (c). We note that spectra in panel (c) have different y-axis limits.
Current usage metrics show cumulative count of Article Views (full-text article views including HTML views, PDF and ePub downloads, according to the available data) and Abstracts Views on Vision4Press platform.
Data correspond to usage on the plateform after 2015. The current usage metrics is available 48-96 hours after online publication and is updated daily on week days.
Initial download of the metrics may take a while.