| Issue |
A&A
Volume 696, April 2025
|
|
|---|---|---|
| Article Number | A133 | |
| Number of page(s) | 16 | |
| Section | Extragalactic astronomy | |
| DOI | https://doi.org/10.1051/0004-6361/202453192 | |
| Published online | 10 April 2025 | |
Gas excitation in galaxies and active galactic nuclei with He IIλ4686 and X-ray emission
Astronomical Institute, Academy of Sciences, Boční II 1401, CZ-14131 Prague, Czech Republic
⋆ Corresponding author; konstantinos.kouroumpatzakis@asu.cas.cz
Received:
27
November
2024
Accepted:
3
March
2025
Context. The origin of He II emission in galaxies remains a debated topic, requiring ionizing photons with energies exceeding 54 eV. While massive stars, such as Wolf-Rayet stars, have been considered potential sources, their UV flux often fails to fully explain the observed He II emission. Recent studies suggest that X-ray binaries (XRBs) might contribute significantly to this ionization.
Aims. We explore the relationship between X-ray and He IIλ 4686 emission in a statistically significant sample of galaxies, investigating whether X-ray sources, including active galactic nuclei (AGNs) and XRBs, serve as the primary mechanism for He II ionization across different galactic environments.
Methods. We cross-matched a sample of known well-detected He II galaxies with the Chandra Source Catalog, yielding 165 galaxies with X-ray and He IIλ 4686 detections. The sources were classified into star-forming galaxies (SFGs) and AGNs based on the BPT diagram and a classification scheme defined for He II galaxies. We analyzed the correlation between X-ray and He II luminosity across different energy bands and other parameters.
Results. The comparison between X-ray and He II luminosity shows a strong, linear correlation across AGNs and SFGs spanning over seven orders of magnitude. AGNs generally exhibit higher He II/Hβ flux ratios, stronger extinction, and harder X-ray spectra. The O32 ratio of SFGs is tightly correlated with the Hβ equivalent width (EWHβ) but not with the He II/Hβ ratio, suggesting a different excitation mechanism. We derive an O32–EWHβ line above which only AGNs of our sample reside.
Conclusions. The tight correlation between X-ray and He II luminosity supports X-rays as the primary driver of He II excitation. While AGNs have one common ionization source, the central black hole, in SFGs low-energy species are mainly excited by UV emission related to star-forming activity, however, high-energy species like He II require the presence of XRBs.
Key words: galaxies: ISM / galaxies: Seyfert / galaxies: starburst / X-rays: binaries / X-rays: galaxies / X-rays: ISM
© The Authors 2025
 Open Access article, published by EDP Sciences, under the terms of the Creative Commons Attribution License (https://creativecommons.org/licenses/by/4.0), which permits unrestricted use, distribution, and reproduction in any medium, provided the original work is properly cited.
This article is published in open access under the Subscribe to Open model. Subscribe to A&A to support open access publication.
1. Introduction
Doubly ionized Helium with emission in the wavelengths λ= 1640, 2733, 3203, 4686, 5412, and 8237 Å has a very high excitation threshold of 54 eV. Thus, it requires the presence of hard ionizing radiation with wavelengths λ ≤ 228 Å. It has long been debated which is the excitation mechanism responsible for the He II emission. Young massive stars are a source of ionizing radiation, but their UV emission energy has been considered not high enough to excite He II (e.g., Stasińska et al. 2015; Nanayakkara et al. 2019; Stanway & Eldridge 2019; Plat et al. 2019; Saxena et al. 2020a; Berg et al. 2021; Olivier et al. 2022). Modeling the radiation of simple stellar populations (SPs) showed that their flux at the energies of 54 eV can be down to about four orders of magnitude lower than that required to ionize hydrogen or oxygen.
Wolf-Rayet (WR) stars were known to show He II emission in their spectra (e.g., Rublev 1964; Schmutz et al. 1989), so they were naturally considered as the underlying source of the He II emission found in the spectra of galaxies (e.g., Schaerer 1996). The WR stars can be mainly found in galaxies with developed SPs and metallicities 12 + log(O/H) ≥ 8.4 but also actively star-forming (e.g., Maeder et al. 1980). However, on most occasions, WR stars’ emission could not fully account for the observed fluxes (e.g., Shirazi & Brinchmann 2012; Jaskot & Oey 2013).
The observed He IIλ 4686 intensity was found to show an anti-correlation with metallicity and SP age (e.g., Pakull & Angebault 1986; Schaerer et al. 2019), similar to that of the X-ray radiation from X-ray binary (XRB) populations (e.g., Fragos et al. 2013b; Brorby et al. 2016). Led from such similarities some studies suggested XRBs or ultraluminous XRBs (ULXs) as the main sources of its ionization (e.g., Garnett et al. 1991; Schaerer et al. 2019; Oskinova et al. 2019; Simmonds et al. 2021; Oskinova & Schaerer 2022; Lehmer et al. 2022; Triani et al. 2024). Modeling the ionizing capabilities of simple stellar and their XRB populations showed that the presence of the latter extends the high-energy ionizing radiation which affects the strength of nebular lines like He II (Schaerer et al. 2019; Umeda et al. 2022; Garofali et al. 2024).
On the other hand, the study of Saxena et al. (2020b) showed no significant difference in the X-ray emission of galaxies with or without He IIλ 4686 ionization suggesting that the former cannot be the main excitation mechanism of the latter, albeit the small size of the studied sample. Other alternative sources of He II excitation involve galaxies with extended initial mass function (IMF) hosting supermassive stars with stellar mass M⋆ ≳ 100 M⊙ or the presence of metal-free population III stars (e.g., Cassata et al. 2013; Szécsi et al. 2015; Crowther et al. 2016; Götberg et al. 2019). This solution was also suggested by recent observations with the James Webb Space Telescope to explain the He IIλ 4686 emission of a distant z = 11 galaxy (Maiolino et al. 2024).
In the modern Universe, He II emission is a strikingly scarce phenomenon among galaxies. Analyzing the Sloan Digital Sky Survey (SDSS) Data Release (DR) 7, which encompasses the spectra of approximately one million galaxies and quasars, Shirazi & Brinchmann (2012) (hereafter SB12) identified only 2865 well-detected sources with signal-to-noise ratio (S/N) > 5.5 in He IIλ 4686 emission. This rarity highlights the exceptional astrophysical conditions required for He II excitation and underscores the critical need to investigate its underlying mechanisms and contributing factors.
To explore the effect X-ray emission has on exciting He II1, a dedicated study based on a statistically significant sample of galaxies is required. A potential correlation could reveal an underlying cause or on the other hand, lack of it would direct us to some other potential mechanism that can excite He II. This work combines the SB12 sample of He II emission galaxies with the Chandra source catalog (CSC; Evans et al. 2010, 2024) to study the observational correlation between the X-ray and He II emission.
This paper is organized as follows: Section 2 describes the X-ray and He II sample. Section 3 provides details about the classification of the sources, describes the main analysis, and gives the results. Section 4 expands the analysis by examining some of the ionization properties of all the SB12 galaxies regardless if they were observed in X-rays. Finally in Section 5 we discuss based on the results and in Section 6 we summarize this work. Throughout this paper we adopted a Planck Collaboration XIII (2016) cosmology (Ωm = 0.308, h = 0.678). Regarding the statistical analyses, confidence intervals (CIs) and errors refer to 32%68% and Scott’s rule (Scott 1979) is used to determine the size of the histogram’s bins.
2. Sample of He II and X-ray galaxies
To study the X-ray emission of He II emission galaxies we adopt the sample of SB12. It provides the He II/Hβ and [N II]/Hα flux ratios for 2865 galaxies that have detected He II with S/N > 5.5. We crossmatch the SB12 sample with the MPA-JHU catalog (Kauffmann et al. 2003; Brinchmann et al. 2004; Tremonti et al. 2004) which provides the fluxes of several emission lines and their uncertainties. We also adopt the MPA-JHU estimations of the galaxies’ star-formation rate (SFR), stellar mass (M⋆), and metallicity (12 + log(O/H)).
Moreover, we crossmatch with CSC, providing uniformly calibrated and analyzed X-ray fluxes in the energy bands 0.5–1.2 (soft), 1.2–2 (medium), 2–7 (hard), and 0.5–7 keV (total). CSC accumulates the detected sources of the Chandra Space Telescope (Chandra from now on) public archive. The estimated fluxes are based on a Bayesian X-ray aperture photometry code. The second release of CSC has a compact source sensitivity limit of about five photons across most of Chandra’s field of view. The cross-matching process led to 254 galaxies. After omitting sources that had bad X-ray photometries indicated by CSC’s confidence, saturation, or readout streak flags or problematic (e.g., infinite) fluxes the final sample is composed of 165 bona fide He II and X-ray emission galaxies. The luminosities are calculated based on the fluxes and the distances estimated through the redshifts provided by MPA-JHU. The classification of the sources is examined in Section 3.1.
The SFRs used in this work are adopted by the MPA-JHU analysis. They were calculated with the methods of Gallazzi et al. (2005) and Salim et al. (2007) which adopted a Chabrier (2003) IMF. To homogenize our comparisons we transfer all relations used in the following analysis to the Chabrier (2003) IMF used by our sample’s SFR estimations. Thus, we multiplied the relations of Mineo et al. (2014) and Brorby et al. (2016) by 0.67 (following Madau & Dickinson 2014) to convert from Salpeter (1955) IMF. Similarly, we multiply by 1.06 to convert the Fragos et al. (2013b) and Lehmer et al. (2021) relations which had adopted the Kroupa (2001) IMF. Moreover, the CSC provides fluxes in the energy range of 0.5–7 keV while most relations were established on the 0.5–8 keV energy bands. Assuming a typical power-law spectrum with NH = 1021 cm−2, and Γ = 2 we estimate a conversion of 0.95 which equals to −0.02 dex to account for the shorter energy range. Similarly, the conversion from 0.3–8 kev to 0.5–7 keV is equal to 0.89 or −0.05 dex.
3. Results
Several comparisons presented in Figure 1 allow us to have a complete overview of the properties of the selected sample. The top two plots show the classifications based on BPT (Baldwin et al. 1981; Veilleux & Osterbrock 1987; Kewley et al. 2001; Kauffmann et al. 2003) and SB12 diagrams. The middle left plot presents the SFR over M⋆ of the galaxies, known as the main sequence of star-forming galaxies (SFGs), and the middle right plot the relation between their X-ray luminosity (LX) and SFR. The two lower plots present the normalized-by-SFR X-ray luminosity (LX/SFR) of the sources as a function of metallicity (lower left) and He II/Hβ ratio (lower right). In all plots of Figure 1, all points are color-coded based on the sources’ He II/Hβ ratio.
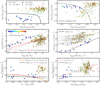 |
Fig. 1. Physical relations of galaxies emitting He II with SnR > 5.5, measured and cataloged by SB12, detected in X-rays and cataloged in the CSCv2.0. In all subplots, the points are color-coded based on the galaxies’ He II/Hβ ratio. The emission-line ratios have low uncertainties which are not plotted for clarity. BPT SFGs are represented by a circle, and BPT AGNs are represented by a triangle marker. SB12 SFGs are marked with a rhombus. Top left: He II/Hβ ratio as a function of the [N II]/Hα ratio. The black curve represents the SB12 classification curve separating AGNs (top right) from SFGs (bottom left). Top right: [O III]/Hβ as a function of the [N II]/Hα ratio, aka the BPT diagram. The dashed black line shows the Kauffmann et al. (2003) classification curve above which composite galaxies and AGNs are located. Middle left: SFR as a function of M⋆, aka the main sequence of SFGs. The brown-dotted, and red dashed-dotted lines represent the Popesso et al. (2019), and Kouroumpatzakis et al. (2021) main sequence fits respectively. Middle right: LX as a function of SFR. The black dashed-dotted line represents the Mineo et al. (2014) relation. Bottom left: LX/SFR as a function of metallicity. The orange continuous, black dashed-doted, green dashed, and magenta dashed-dotted lines represent the Fragos et al. (2013b), Mineo et al. (2014), Brorby et al. (2016), and Lehmer et al. (2021) relations respectively. Bottom right: LX/SFR as a function of He II/Hβ ratio. The black dashed-dotted line represents the Mineo et al. (2014) relation. The red dashed line shows the best linear regression fit involving all sources regardless of their class. |
3.1. Classification of the He II and X-ray galaxies
The top two plots of Figure 1 show the He II/Hβ over [N II]/Hα flux ratio diagram, and the BPT [O III]/Hβ over [N II]/Hα diagram. Based on the BPT diagram, the Kewley et al. (2001) theoretical extreme ionization line, and the Kauffmann et al. (2003) empirical line, 46 galaxies are classified as star-forming and the rest are active galactic nuclei (AGNs) or composite galaxies. Based on the classification proposed by SB12 only 17 sources are classified as SFGs. It must be noted that many BPT SFGs are not considered as SFGs by the SB12 diagram because they have high He II/Hβ ratios although they show relatively low N II/Hα ratios (Figure 1 upper left). These sources are mostly located in the lower ionization parameter (U) and higher metallicity part of the BPT (e.g., Kewley et al. 2001).
Moreover, as it is shown in the LX/SFR–metallicity plot of Figure 1 (lower left) these sources form a separate group of high metallicity, therefore developed galaxies. This group also shows a large excess of X-ray emission, which indicates the presence of AGN. We further explore the classification of the galaxies by examining the velocity dispersion (σ) of their Balmer lines, as measured by the MPA-JHU catalog (Figure 2). The group of BPT-SFGs-but-SB12-AGNs shows high velocity dispersions, strongly suggesting the presence of AGN. Interestingly, their velocity dispersion is even higher than the BPT AGNs.
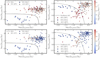 |
Fig. 2. Same plots as the upper plots of Figure 1 but color-coded based on the galaxies’ velocity dispersion (σ) of their Balmer lines (top), and the ratio of the velocity dispersions of the Balmer and forbidden lines (bottom). |
In a simplified archetypical scenario, AGNs are divided into Seyfert I (aka quasars or broad-line AGNs), and Seyfert II (aka narrow-line AGNs; e.g., Khachikian & Weedman 1974; Antonucci 1993). For the former, we can observe the AGN’s broad-line region (BLR) because we see them face-on in our line of sight. Due to edge-on inclination, we can not observe the BLR of Seyfert II AGNs, which are otherwise located at the top right of the BPT diagram. AGNs showing broadened Balmer lines are not usually included in the BPT diagram due to difficulties in disentangling the narrow from the broad component (e.g., Veilleux & Osterbrock 1987; Kauffmann et al. 2003). BLRs are characterized by high-density gas, typically exceeding ne > 109 cm−3. These higher densities lead to collisions dominating the de-excitation of the gas and the suppression of the forbidden emission lines. Therefore, a significantly higher Balmer-to-forbidden line velocity dispersion ratio can help us distinguish whether the high-σ is attributed to the BLR of an AGN or is driven by shocks related to extreme star-forming activity (e.g., recent supernovae or H II bubbles).
In the lower plots of Figure 2 we examine the possibility of this high σ being a result of a shock-dominated interstellar medium. The sources are color-coded based on the ratio of their Balmer-to-forbidden velocity dispersion. Most BPT-SFGs-but-SB12-AGNs show a significantly higher ratio while their σ is overall higher. Additionally, we present in Appendix A the optical spectra near the Hα and Hβ lines of this sample’s X-ray detected BPT-SFGs-but-SB12-AGNs. Based on visual inspection, 29/30 sources clearly show wider Balmer lines signaling the contribution from a BLR (e.g., Reines et al. 2013; Reines & Volonteri 2015). Because these sources have broadened Balmer lines but relatively lower σ compared to those defined as broad-line AGNs (σ > 2000 km s−1) we consider them as narrow-line Seyfert 1 (NLS1; e.g., Osterbrock & Pogge 1985; Mathur 2000). Moreover, these NLS1 show excessive X-ray emission similar to the BPT Seyfert II. Thus, these sources can be safely discarded as SFGs.
A possible reason for this misclassification by the BPT diagram could be an overestimation of the narrow component of the Balmer lines which lowered the [N II]/Hα and [O III]/Hβ ratios. However, the SB12 diagram shows its ability to correctly classify these sources accounting for their strong He II emission. Sixteen galaxies of this sample fulfill both BPT and SB12 classification schemes as SFGs simultaneously. Additionally, we omit the highest-metallicity (12 + log(O/H)≃9.2) galaxy of these 16 SFGs which also shows a large excess of X-ray emission. This source is at the edge of the SB12 classification curve. At the same time, it is located at the center of the group of this sample’s NLS1s regarding metallicity (Figure 1, lower left) hinting contamination by AGN activity. This subsample of 15 sources will be considered the SFGs and the rest as AGNs for the following analysis regarding the comparisons between X-ray and He II emission.
3.2. Star-forming activity and X-ray luminosity
As revealed by the SFR–M⋆ relation, all BPT and SB12 SFGs of this sample show intense star-forming activity with average specific SFR 〈log10(sSFR−1)〉 ≃ −8 with sizes from very small to average size galaxies (6 ≤ log10(M⋆/M⊙)≤10.5). Most of these galaxies are dwarf and resemble Green Peas (e.g., Cardamone et al. 2009; Izotov et al. 2011), or Blueberries (Yang et al. 2017; Kouroumpatzakis et al. 2024). In fact, two of them are part of the known Blueberry samples (PGC 140535 and 3328271; Kouroumpatzakis et al. 2024). The AGNs, which also have higher He II/Hβ, form a separate group of higher mass host galaxies (9.2 ≤ log10(M⋆/M⊙) ≤ 11.8) which are also less active with average 〈log10(sSFR−1)〉 ≃ −10. The low-SFR AGN galaxies have large uncertainties in their SFR estimations due to the overall low SFR and the contribution of the AGN in their emission which is difficult to disentangle from the star-forming activity. Nevertheless, the SFRs of AGNs are only used in Figure 1 for demonstration purposes. They are not used in any other part of the analysis.
In the middle right plot of Figure 1 we compare the total LX as a function of the SFR of the sources. As a reference, we plot the Mineo et al. (2014) relation. Most of the SB12 SFGs follow the Mineo et al. (2014) relation. However, three sources show a significant excess of X-ray emission. These galaxies spread over a wide range of SFRs. All of the higher He II/Hβ ratio, thus SB12 AGNs, are above the Mineo et al. (2014) line. Additionally, the vast majority shows significant LX excess reaching up to four orders of magnitude. The average LX excess of the SB12 AGNs is about 2 dex higher compared to that expected by their star-forming activity. Still, there is significant scatter.
3.3. Normalized X-ray luminosity compared to metallicity and He II emission
The lower left plot of Figure 1 presents the normalized X-ray luminosity (LX/SFR) as a function of the metallicity (12 + log(O/H)) of the sources. This plot includes only the BPT and SB12 SFGs as MPA-JHU does not provide metallicity estimations for sources classified as AGNs by the BPT diagram. We also plot the Mineo et al. (2014) relation where the LX/SFR ratio is independent of metallicity, and the Fragos et al. (2013b), Brorby et al. (2016) and Lehmer et al. (2021) relations which are functions of metallicity.
Most of the SB12 SFGs follow the relations mentioned above except for three low metallicity sources which show significant excess compared to what is expected by their SFR and low metallicities. The NLS1s (BPT-SFGs-but-SB12-AGN; Section 3.1) form a separated group located at higher metallicities (12 + log(O/H) > 8.8). However, because of the AGN’s possible contribution to the observed spectrum and the emission-line component, their metallicity estimations should be considered with caution. All NLS1s of this sample show significantly elevated LX/SFR.
The lower right plot of Figure 1 presents the LX/SFR as a function of the He II/Hβ ratio. The SB12 SFGs and AGNs are located at the left and right parts of the diagram respectively due to the increased He II/Hβ ratio of the AGNs. On average the AGNs also show increased LX/SFR compared to the SFGs. The LX/SFR monotonically increases with He II/Hβ regardless of the class of the source. A linear regression fit involving all the sources, regardless of their class, shows that there is an underlying relation that correlates the LX/SFR with the He II/Hβ ratio regardless of the nature of the X-ray emission. However, the sources show a large scatter which is increasing at a higher He II/Hβ ratio. The scatter is larger for the AGNs probably driven by the large uncertainties of their SFR estimations, due to their host-galaxy passive nature, and the contribution of the AGN in the galaxy’s spectral energy distribution (SED) and emission-line component. Moreover, their X-ray emission is mainly attributed to the AGN and thus is less relevant and related to the host galaxy’s SFR.
3.4. Hardness ratio and obscuration
The distribution of the X-ray hardness for the different classes of our sample is examined in the upper plot of Figure 3. The X-ray hardness ratio is defined here as (H − S)/(H + S), where H is the count rate in the hard band (2–8 keV) and S is the count rate in the soft and medium bands (0.5–2 keV) of Chandra. The hardness ratio is a useful quantity that encapsulates the spectral slope of the X-ray spectrum. A large population of AGNs is not expected to be dominated by a very hard X-ray spectrum overall. Obscured sources tend to have higher X-ray hardness due to absorption of the soft X-ray flux (e.g., Hasinger 2008; Civano et al. 2012; Fornasini et al. 2018). However, the SB12 AGNs of our sample show a distribution dominated by sources with hard X-ray spectra hinting that they may be obscured sources. On the other hand, the hardness distribution of the purely SFGs is dominated by sources with soft X-ray spectrum. Interestingly, the hardness distribution of our sample’s NLS1s stands in the middle with the distribution’s mode 〈HR〉 ≃ 0. It should be mentioned that the homogeneous analysis by CSC does not specifically fit the X-ray spectra of the sources with obscured models so the delivered fluxes do not account for intrinsic obscuration.
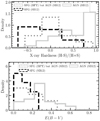 |
Fig. 3. Histograms of the hardness ratio (top), and extinction (bottom) of our sample of He II and X-ray detected sources. The black dashed, and light gray continuous lines correspond to SB12 SFGs and AGNs. The gray dotted line represents sources classified as SFGs by BPT but AGNs by the SB12 diagram (NLS1s; Section 3.1). |
The bottom panel of Figure 3 presents the extinction of the sources measured in E(B − V). The E(B − V) was estimated spectroscopically through the Balmer ratio assuming case-B recombination and the reddening law of Calzetti et al. (2000). Similarly to the hardness ratio, the extinction is significantly higher for the Seyfert II (BPT and SB12) AGNs compared to the SFGs and NLS1s. The modes of their E(B − V) distribution lie at 0.05, 0.05, and 0.27 for the SFGs, NLS1s, and Seyfert II AGNs respectively, showcasing the latter’s dustier nature. Our sample’s Seyfert II AGNs show hard spectra and high reddening, a combination suggesting that they are obscured sources.
3.5. The relation of normalized X-ray luminosity and He II to Hβ ratio of purely star-forming galaxies
In this section, we examine more closely the LX/SFR–He II/Hβ relation for our sample’s SFGs. In Figure 4 we present the relation between the LX/SFR and metallicity (left column), or He II/Hβ ratio (right column) in logarithmic space for the 15 purely SFGs of our sample based on the SB12 and BPT classification. The comparison is performed separately for the CSC’s total, hard, medium, and soft X-ray energy bands while all points are color-coded based on the galaxies’ sSFR.
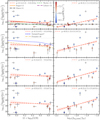 |
Fig. 4. LX/SFR as a function of metallicity (left column), or He II/Hβ ratio (right column) of SFGs classified by both the SB12 and BPT diagrams. The energy bands total, hard, medium, and soft appear from top to bottom respectively. All points are color-coded based on the galaxies’ sSFR. The red dashed line represents the best linear regression fit and the shaded area shows the uncertainties of the fit. The orange continuous, black dashed-doted line, green dashed, and purple dashed-dotted curves represent the Fragos et al. (2013b), Mineo et al. (2014), Brorby et al. (2016), and Lehmer et al. (2021) relations respectively. The blue dashed and the yellow dashed-dotted lines shown in the second row correspond to the Madau & Fragos (2017) and Fornasini et al. (2020) relations respectively. |
The galaxies form two groups of almost the same number of sources regarding metallicity. At the left are low metallicity sources with 12 + log(O/H)⪅8, and at the right are sources scattered around the solar metallicity (8.4 < 12 + log(O/H) < 8.9). We also compare with the established Mineo et al. (2014), and the Fragos et al. (2013b), Brorby et al. (2016), and Lehmer et al. (2021) relations where the LX/SFR is a function of metallicity. The low-metallicity sources show a large scatter above and below these relations. The observed scatter can be attributed to the stochastic nature of XRBs or the presence of ULXs. Both scenarios can have a stronger effect on low-mass galaxies. Conversely, the near-solar metallicity sources tend to follow the reference relations more closely.
The comparison between the LX/SFR and He II/Hβ ratios (right column) shows a positive correlation which holds in all the examined energy bands. For a given LX/SFR, the observed He II/Hβ ratios of these SFGs align exclusively with the highest X-ray efficiency models proposed by Senchyna et al. (2020). Notably, these models predict a strong positive correlation between LX/SFR and He II/Hβ, which is consistent with the findings presented in this study. Galaxies with low He II/Hβ show low X-ray emission and vice versa, sources with high He II/Hβ show higher LX/SFR. We perform a linear regression fit to quantify this correlation. The slope of the linear regression fits is higher for the soft CSC band but the results are similar for all bands accounting for the fit uncertainties. This agrees with the fact that most of the SFGs of our sample show a rather soft X-ray spectrum (Section 3.4). Overall, the He II/Hβ ratio appears as an enhanced tracer of the LX/SFR ratio compared to metallicity showing lower scatter and steeper slopes.
The majority of the SFGs closely follow the regression fits, besides two sources with significant X-ray excess. The color-coding of Figure 4 reveals that most intensively star-forming sources log (sSFR/yr−1) ≤ −8 tend to be below these linear regression fits. On the contrary, the ones slightly less actively star-forming, with log (sSFR/yr−1) ≥ −8, tend to show an excess of LX/SFR. As the sSFR is the ratio of the SFR over the M⋆ of the galaxies, it traces the youth and starburst intensity of their SPs. All these sources host very young SPs with log (sSFR/yr−1) ≤ −9. However, the fact that those with the highest sSFR show relatively lower LX/SFR indicates a dependence on the star-forming activity and possibly the age of the SPs.
Observations of the nearby Large and Small Magellanic Clouds have shown that some exceptionally young SPs show a deficit in X-ray emission (Antoniou et al. 2010, 2019). This has also been discussed as the reason for the X-ray luminosity deficit of some of the highly star-forming dwarf Blueberry galaxies (e.g., Adamcová et al. 2024). Models of HMXBs showed that very young SPs, with ages less than 5 Myr host fewer HMXBs and thus, show lower X-ray intensity (e.g., Shtykovskiy & Gilfanov 2007) while for SPs with ages below 3 Myr, they may be completely absent (Lehmer et al. 2024). This deficit is attributed to the ages of their SPs and the time needed to produce XRBs. Very young galaxies may show lower X-ray emission compared to those with slightly older SPs since the peak of their X-ray emission is estimated to be around 30–50 Myr (e.g., Fragos et al. 2013b). Our sample tends to follow this trend.
The total X-ray output of a galaxy includes the XRBs and the circumgalactic medium’s hot gas emission. While the hot gas’ contribution can be significant in passive galaxies, it becomes less important in starburst galaxies like this samples’ SFGs (e.g., Gilbertson et al. 2022; Vladutescu-Zopp et al. 2023, 2025). Recent analysis on a large sample of X-ray observed sources estimated that, on average, the contribution of hot gas in the total X-ray output of SFGs is around 10% (Kyritsis et al. 2025). Moreover, the majority of our sample’s SFGs are dwarf galaxies with M⋆ < 109.5 M⊙ which are known not to be able to sustain large amounts of hot gas due to their weaker gravitational fields (e.g., Boroson et al. 2011; Mineo et al. 2012). Thus, we do not expect strong biases in the adopted fluxes due to hot-gas contribution.
3.6. Direct comparison between X-ray and He II luminosities
Since the SFR is correlated and can be estimated through the strength of the Balmer emission lines (e.g., Kennicutt 1998), we can remove the denominators of both terms of the LX/SFR–He II/Hβ relation and examine directly the relation between the X-ray and He II luminosities. The work of SB12 does not provide the He II luminosities. We recover them through the given He II/Hβ ratios and the Hβ emission-line fluxes estimated by MPA-JHU which are based on the same SDSS spectra.
Moreover, since the X-ray emission corresponds to the complete spatial extent of the sources, we need to correct the cases where the SDSS fiber does not fully cover the sources. To perform aperture correction on sources that may be larger than the SDSS fiber (3″ box), we crossmatch our sample with the Heraklion Extragalactic Catalog (HECATE; Kovlakas et al. 20212) that provides the angular sizes of galaxies up to 200 Mpc. We find that only three sources of our sample have a major axis larger than 3″, for which we multiply the ratio of their major axis over the size of the SDSS fiber with the He II luminosity derived by the SDSS spectra. The aperture correction may suffer from biases due to the potential spatial variation of the He II emission on the surface of the galaxy. However, since the correction is required only for 3/165 sources we do not expect it to significantly affect the results of this analysis.
The He II–X-ray luminosity relation is examined in Figure 5 separately for the provided soft, medium, hard, and total CSC energy bands. To quantify the correlation we performed Markov-chain Monte-Carlo (MCMC) fits adopting a linear relation between the X-ray and He II luminosities. The relation is in the form:  where the α, β, and σ represent the intercept, the slope, and the variance respectively. The MCMC fitting was performed with the Python emcee package (Foreman-Mackey et al. 2013). The fitting implemented 32 walkers over 5000 iterations with the first 500 for the burn-in phase. To estimate the initialization parameters, we performed a maximum likelihood fit with the minimization algorithm scipy (Virtanen et al. 2020). We adopted a uniform prior throughout the process. The results of the MCMC fitting are provided separately for the different X-ray energy bands in Table 1. As represented by the shaded areas in Figure 5, the uncertainties of the fit are quite low accounting for the fact that the intercepts and slopes of each fit are strongly anti-correlated.
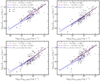 |
Fig. 5. X-ray as a function of He II luminosity for different X-ray energy bands in logarithmic space. The energy bands total, soft, medium, and hard appear from top to bottom and left to right respectively. The pink triangles and blue rhombuses show AGNs and SFGs respectively as adopted by this work (Section 3.1). The black dotted, purple dashed-dotted, and blue dashed lines correspond to the best results of MCMC fits involving all sources, AGNs, and SFGs respectively. The shaded areas with the same colors correspond to the uncertainties of the respective fits. The results of the MCMC fits are presented at the top of each plot and are summarized in Table 1. |
Summary of MCMC fitting results of the X-ray and He II correlation.
The comparisons and fits presented in Figure 5 display a tight linear correlation between X-ray and He II luminosities regardless of the class of the sources. This correlation holds for all X-ray energy bands, including the total, soft, medium, and hard, extending for about seven orders of magnitude. On average, the X-ray luminosity is about 2.5 orders of magnitude higher than that of the He II. Most of the low LHe II and LX sources are purely SFGs while the most luminous are AGNs. In addition to the hard X-ray band where the fit corresponding to the SFGs is slightly lower than the respective fit of the AGNs, their fits overlap, indicating a similar excitation mechanism for both classes. The displayed scatter between the luminosities is overall lower for the total X-ray emission. The SFGs show a larger scatter compared to AGNs, a fact which however could be attributed to the relatively smaller size of the sample.
4. Investigation of the ionization properties of all (agnostic to X-rays) He II galaxies
This section expands on the former analysis and investigates some of the ionization properties of all the SB12 He II galaxies regardless of whether they have been detected in X-rays or not. In Figure 6, we compare several parameters of the SB12 sample. The comparisons galaxies emitting He II with SnR > 5.5, measured and cataloged by SB12, and matched with the SDSS MPA-JHU catalog. We omit sources having S/N < 5 in the [O II] λ 3726, [O III]λ 4959, [O III]λ 5007, and Hβ emission lines yielding a sample of 2399 galaxies. We also plot the X-ray-selected sample (Section 3.1). The larger, agnostic-to-X-rays sample partially serves as a control sample for the sources with detected X-ray and He II emission. We note that some X-ray-selected sources lack [O} II]λ 3726 detection because this line can fall outside the SDSS spectrum range due to their higher redshift. Conversely, some X-ray sources do not have counterparts in the agnostic sample because of the S/N constraints applied to all the emission lines used in these comparisons. The X-ray-selected AGNs and SFGs exhibit distributions similar to their counterparts in the agnostic sample. This suggests that the X-ray-detected sample is representative and not significantly different from the majority of He II emitters.
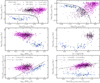 |
Fig. 6. Several comparisons of 2399 galaxies emitting He II with SnR > 5.5, measured and cataloged by SB12, and matched with the SDSS MPA-JHU catalog having S/N > 5 in all compared emission lines. SB12 SFGs and AGNs are represented by light blue rhombuses and violet triangles respectively. BPT SFGs are represented by a black cross. The X-ray-selected SFGs and AGNs (Section 3.1) are also shown with blue right-pointing and purple left-pointing triangles respectively. Top left: He II/Hβ over [N II]/Hα. The black curve represents the SB12 classification criterion separating AGN from SFGs. Top right: BPT [O III]/Hβ over [N II]/Hα diagram. The dashed black line shows the Kauffmann et al. (2003) classification criterion. Middle left: He II/Hβ as a function of EWHβ. Middle right: He II/Hβ as a function of metallicity. Bottom left: O32 as a function of EWHβ. The blue dashed line represents the best linear regression fit involving only BPT and SB12 SFGs. The black line represents a threshold above which only AGNs of our sample are located. Bottom right: He II/Hβ as a function of O32. The black dashed-dotted and blue dashed lines show the best linear regression fits involving solely SB12 AGNs or SFGs, respectively. |
The first two plots show the BPT and the SB12 diagrams, providing classification for the sources. The BPT diagram uses optical emission-line ratios to distinguish between AGNs and SFGs, while the SB12 diagram provides an alternative classification based on He II/Hβ flux ratios. Comparing the two helps identify discrepancies in classification methods and provides insight into the ionization mechanisms at play. Similarly to the X-ray sample, a significant number of sources are considered SFGs by the BPT but as AGNs by SB12. Based on SB12, 2322 galaxies are classified as AGNs and 77 as SFGs. Based on the BPT 431 galaxies are located below the Kauffmann et al. (2003) line and are classified as purely SFGs. As discussed in Section 3.1 most of the BPT SFG but SB12 AGNs of our X-ray sample show broadened emission lines indicating contribution from the BLR of an AGN. Histograms of the Balmer-lines velocity dispersion (σBalmer) of this larger sample are presented in Figure 7 separated to the SFG and AGN classes based on the different methods. Once again it is shown that the sources identified as SFGs by the BPT but as AGNs by SB12 are those showing the largest σ among the galaxies of this sample indicating the presence of an AGN. Therefore, for the following comparisons and discussion, we consider purely star-forming sources classified as such by both diagrams. The rest are considered as AGNs.
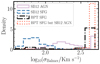 |
Fig. 7. Histograms of the logarithm of the Balmer lines velocity dispersion (σ) for the different classes of the agnostic-to-X-rays sample. The pink continuous and blue dashed lines show the AGNs and SFGs classified by the SB12 diagram. The SFGs based on the BPT diagram are presented with a black dashed-dotted line while the red dotted line shows those classified as SFGs by the BPT but as AGNs by the SB12 diagram. |
The middle left plot of Figure 6 shows the He II/Hβ ratio as a function of the equivalent width of the Hβ line (EWHβ) in logarithmic space. The EW corresponds to the ratio of the emission or absorption component of the line over the continuum. Because the continuum is mainly attributed to the thermal emission of the long-lived low-mass stars it traces the strength and presence of the old SPs. The spectral line component, when in emission, traces the gas excitation from the young SPs. Thus, the EW is an excellent tracer of the SPs’ youth and the galaxies’ star-forming activity. Therefore, the EWs of the Balmer lines show a strong correlation with the sSFR (e.g., Belfiore et al. 2018).
We observe the two classes aggregating in two clusters, with the AGNs at the top left and the SFGs at the bottom right. The SFGs have high EWsHβ but show low He II/Hβ ratios. This lack of correlation indicates that the radiation of the young SPs, which drive the EWsHβ, can not be the excitation mechanism behind He II emission. Conversely, the host galaxies of most AGNs are passive with no significant star-forming activity as shown by their low EWsHβ. However, they show a large scatter in the comparison with the EWsHβ, and higher He II/Hβ ratios which can be attributed to the AGN’s activity.
The middle right plot of Figure 6 shows the He II/Hβ ratio as a function of metallicity including all BPT SFGs for which MPA-JHU provides metallicity estimations. The majority of the BPT-SFGs-but-SB12-AGNs form a cluster of points with high metallicities and high He II/Hβ ratios. As discussed above these sources are probably AGNs, thus, their metallicity estimations should be considered with caution. The pure SFGs of our sample cover a large range of metalicities within 7.7 ≲ 12 + log(O/H) ≲ 9.2. There is no strong correlation found between the He II/Hβ ratio and the metallicity of the SFGs across the full metallicity range. However, the sources tend to show a bimodal behavior albeit their substantial scatter. Galaxies with 12 + log(O/H) > 8.5 show a slightly positive correlation with increased He II/Hβ at super-solar metallicities while low metallicity SFGs with 12 + log(O/H) < 8.5 tend to show an anti-correlation.
The bottom left plot of Figure 6 presents the comparison between the log10(fO III]λ λ4959,5007/fO II]λ3726) ratio (O32) and EWHβ. The O32 primarily measures the ionization state of the gas and is mainly used to estimate a) the ionization parameter U, which describes the number of ionizing photons per hydrogen atom in the ionized gas, and b) the effective temperature (Teff) of the ionizing stars, particularly the hot, young stars in H II regions (e.g., Sanders et al. 2016). Moreover, it has been used as a method to distinguish between galaxies dominated by AGN activity and those dominated by star formation (e.g., Kewley & Dopita 2002) and it has been proposed as a tool to estimate the escape fraction of ionizing photons (e.g., Nakajima & Ouchi 2014).
The O32 to EWHβ comparison also shows a separate behavior between the two classes. The AGNs are distributed with rather large scatter at high O32 values with most showing low EWsHβ, confirming that the stellar activity can not be the excitation mechanism in AGNs. However, the two parameters show a very tight linear correlation for purely SFGs. Stasińska et al. (2015) has also reported this behavior on purely star-forming and high U galaxies. They suggested that the observed correlation is due to the increase of the effective temperature (Teff) of the interstellar medium (ISM) by ionizing (young) SP’s radiation, while it is also against Lyman continuum escape which would otherwise lead to a drop of the EWHβ.
We perform a linear regression fit involving only the SFGs of this sample to quantify the observed correlation. The fit results to log10(fO III]λ λ4959,5007/f[O} II]λ3726) = −1.16 (± 0.13) + 1.06 (± 0.06) log10 (EWHβ/Å). The standard deviation (std) of the sources around the best-fit line is only 0.18 dex confirming the very tight correlation. Based on the best fit and the scatter of the SFGs around it we draw a line log10(fO III]λ λ4959,5007/f[ II] λ 3726}) = −0.8 + 1.06 log10 (EWHβ/Å) above which no SFGs of our sample are located. However, it should be noted that some AGNs reside under this line.
The bottom right plot of Figure 6 presents the He II/Hβ ratio as a function of O32. The He II/Hβ ratio increases monotonically with O32 only for the AGNs. A linear regression fit of the AGN sources captures this positive correlation. However, it is probably a simplified approach since we observe a flattening at very high O32 values while the fit’s slope is not so steep. This correlation indicates that the dominating ionization source in AGN, the central super-massive BH, also affects the ionization state of the host-galaxy gas. On the other hand, there is no obvious correlation between the He II/Hβ and O32 ratios in SFGs. The respective linear regression fit shows a slightly negative slope, but it could be considered flat, accounting for the fit’s uncertainties and the source’s scatter. This comparison reveals that the He II/Hβ and O32 ratios are uncorrelated across SFGs emitting He II.
5. Discussion
5.1. Wolf-Rayet stars as source of He II excitation
WR stars show He II emission in their spectra and thus are prime candidates for producing this emission in galactic scales. WR stars tend to be more abundant in galaxies with relatively higher metallicity due to various factors related to stellar evolution. These evolved massive stars are susceptible to metallicity. Mainly due to decreased mass loss through stellar winds in low-metallicity environments, the minimum mass for forming WR stars is lower at higher metallicities while their lifetimes become longer (e.g., Maeder et al. 1980; Maeder 1991; Masegosa et al. 1991). It has also been shown that short bursts of star formation favor the formation of WR stars (e.g., Meynet 1995). Moreover, WR stars are typically linked with young, massive star formation, which tends to occur in galaxies with higher SFR. Low-SFR or passive galaxies, generally show fewer WR stars because these stars are short-lived and emerge in environments with significant ongoing star formation (e.g., Masegosa et al. 1991).
Jaskot & Oey (2013) modeled the photoionization around hot WR stars using CLOUDY (Ferland et al. 1998). Their modeling showed that only the hottest WR stars could show  . However, conditions leading to such He II/Hβ ratios would also be combined with log10(fO III]λ λ4959,5007/fO II] λ 3726) > 1. Their work concludes that only 4–5 Myr starbursts, containing a substantial WR population, can simultaneously match the O32 and He II/Hβ ratios. In this work, none of our samples’ SFGs reach log10(fHe II/fHλ) > −1.2 while some sources show log10(fO III]λ λ 4959,5007/f[O II]λ 3726) ≃ 1.7. Moreover, as shown in Figure 6, there is a lack of correlation between these parameters. Thus, they do not match these extreme conditions which would allow WR stars to explain the observed ratios.
Similarly, the analysis of SB12 showed that only 4–5 Myr starbursts with large WR populations can reproduce the hard ionizing UV continuum required for the observed He II/Hβ ratios. However, they discuss that binary stellar evolution allows for a larger fraction of WR stars at a wider age range. Moreover, their dedicated spectral analysis showed that a large fraction of their sample does not show WR features, a fraction that increases with decreasing metallicity to reach about 70% at 12 + log(O/H) < 8.2. Therefore, SB12 suggested some alternative explanations, like the separation between the WR stars and the regions emitting He II, or SPs with higher temperatures than those expected by the current models. While they discarded X-rays as a potential solution, the now-established relation between increased X-ray emission and the number of XRBs in galaxies with lower metallicity was not fully explored at the time.
The SFGs of the agnostic-to-X-rays sample examined in Section 4 extend from normal to very active galaxies as observed by their EW (17 < EWHβ/Å < 411). The comparison between the SFGs’ He II/Hβ ratio and EWHβ shows a lack of or even an anti-correlation. This is against populations of WR stats being the dominant mechanism of He II ionization since otherwise we should observe higher He II/Hβ ratios in galaxies with higher EWs and thus recent star-forming activity. These sources range from extremely metal-poor to super-solar metallicity SFGs (7.67 < 12 + log(O/H) < 9.15; Figure 6). The comparison does not show a correlation extending the full metallicity range of the sample. However, although the scatter is considerable, there is a weak positive correlation between metallicity and the He II/Hβ ratio at 12 + log(O/H) ≳ 8.25 which aligns with increased contribution from WR stars. Therefore, while the excitation of He II by WR stars cannot be ruled out, their influence demonstrates a lower degree of effect than that exerted by the XRB’s X-ray emission.
5.2. Possibility of X-ray obscured AGNs
In this work, we do not fit separately the X-ray spectra, and our comparisons are based on the fluxes provided by the CSC. The CSC does not fit the X-ray spectra of any source with models accounting for intrinsic absorption. However, this could be the case for some of this work’s Seyfert II AGNs, which were found to have hard X-ray spectra potentially attributed to intrinsic obscuration (Section 3.4). These sources also show higher gas-phase extinction (Figure 3). We also do not correct the He II emission for extinction. Thus, this comparison involves the observed fluxes directly. Further analysis accounting for X-ray obscuration and gas-phase extinction correction can provide a clearer picture of the X-ray and He II luminosity relation. Still, the compared parameters retain a tight correlation.
5.3. X-rays as the source of He II excitation in AGNs and SFGs
The behavior displayed by AGNs could be explained by assuming that the central BH is the dominating ionizing source in their host galaxies. The accretion disk of the central BH is capable of producing X-ray and hard UV emission (e.g., Haardt & Madau 1996). The spectral shape of this radiation and its flux depend on several parameters, such as the BH mass or accretion rate. Assuming BHs of similar mass, sources with increased accretion rate would produce higher fluxes in both UV and X-ray emission (e.g., Shappee et al. 2014) capable of exciting He II and elements that do not have such high excitation thresholds like hydrogen or oxygen. Thus, a common source of ionizing radiation can interpret the observed correlation between He II/Hβ, O32, and X-ray emission in AGNs.
SFGs demonstrate a different behavior compared to AGNs, with a lack of correlation between He II/Hβ and O32 or EWHβ, but a very tight correlation between O32 and EWHβ (Figure 6). This behavior could be explained if we assume that there can be two main ionizing components in SFGs, the SP’s UV light and the XRB’s X-ray emission. The dominating low-energy (lower than 54 eV required for the excitation of He II) ionization source is mainly the young massive stars. The young SPs dominate the low-energy ionizing radiation with higher flux compared to X-rays and that is why we observe the very tight correlation between O32 and the EWHβ in SFGs.
At the same time, in SFGs, the He II emission remains unrelated to O32 and the EWHβ but is strongly correlated with the X-ray emission. It is known that in SFGs the UV luminosity scales linearly with the Hα, and subsequently the Hβ luminosity, since hydrogen in the ISM is being excited by the same UV photons (e.g., Buat et al. 2002; Parnovsky et al. 2013; Shim & Chary 2013). The SFGs of our sample show a lack of or an anti-correlation between the He II/Hβ ratio and the EWHβ indicating that while the hydrogen emission-line and the UV luminosity strengthen they are not necessarily followed by the He II emission. As theorized in the past, this indicates that even abundant UV ionizing radiation from young SPs can not excite He II if they are not in rare homogeneous O stars associations which can reach extremely high Teff (e.g., Jaskot & Oey 2013; Stasińska et al. 2015). However, XRBs can abundantly produce high-energy radiation capable of ionizing He II.
The integrated X-ray intensity of a population of high-mass XRBs is known to correlate with the SFR of the host galaxies (e.g., Gilfanov et al. 2004) with dependencies on the age of the SPs (e.g., Fragos et al. 2013b) or the metallicity (e.g., Prestwich et al. 2013). However, the presence of XRBs is rather stochastic (e.g., Douna et al. 2015) with possibly elevated outputs in low-metallicity dwarf starbursts (e.g., Vulic et al. 2022) while the correlation between X-ray emission and the SFR shows significant scatter especially in lower masses and spatial scales (e.g., Kouroumpatzakis et al. 2020). The SFR of galaxies is traced by the strength of the emission of Balmer lines like Hβ, and based on the results of this work the He II emission is powered by the X-ray emission of the XRBs. Thus, the observed stochasticity observed in the SFR–LX relations could also partially explain the observed scatter of the He II/Hβ ratio found in SFGs.
However, further examination is needed to fully understand the LHe II–LX correlation and its scatter. How does the He II intensity depend on the amount of gas present and the state of the ISM? Is the He II emission following the X-ray emission at spatially resolved subgalactic scales, and to what spatial extent can the X-ray emission ionize helium? Do all galaxies with X-rays show He II emission, and vice versa, do all galaxies with He II emission emit X-rays?
For instance, Senchyna et al. (2017) reported one source with He II emission but no X-ray equivalent. However, based on this work’s LHe II–LX correlation, the observed He II luminosity LHe II = 2.6 × 1037 erg s−1 of the source SB 111 corresponds to LX = 3.6 × 1038 erg s−1 in the 0.5–1.2 keV energy range which would make the source marginally undetected for a limiting luminosity of LX ≃ 3 × 1038 erg s−1 in case it has a soft X-ray spectrum as most of our sample’s SFGs. Similarly, Kehrig et al. (2018) which examined the metal-poor galaxy SBS 0335-052E, suggested that the observed He II intensity could not be fully explained by the relatively low X-ray luminosity. However, based on this work’s LHe II–LX correlation and accounting for the scatter and the lower energy range, its 0.5–5 keV LX = 4 × 1039 erg s−1 is in agreement with the source’s observed LHe II = 2.16 × 1038 erg s−1.
The study of Kaaret et al. (2004) performed a spatially resolved analysis of a bright X-ray source located at the outskirts of the dwarf irregular galaxy Holmberg II. The source is considered to be a ULX with LX = 5 × 1039 erg s−1. This source was found to be surrounded by a H II region emitting He II with LHe II = 2.7 × 1036 erg s−1. Moreover, the location of the He II emission in Holmberg II follows spatially the X-ray source. The observed luminosities agree with this work’s LHe II–LX relation considering the scatter and uncertainties. In this case, the observed LHe II is weaker and not stronger with respect to the expected by the LHe II–LX relation as in the cases of SB 111 and SBS 0335-052E.
The results of this work are also similar to that of Satyapal et al. (2004) which have reported a linear correlation between the X-ray luminosity and that of another high ionization but mid-IR emission line, the [O IV] at λ = 26 μm. Similarly to He II, the excitation of [O IV] requires photons with energies higher than 55 eV. The LX–L[O IV] comparison reported by Satyapal et al. (2004) involved starbursts, LINERs, and AGN galaxies as classified by the morphology and distribution of their X-ray sources showing a correlation transcending their classes.
Overall, the results of this work are aligned with previous studies proposing the XRBs’ X-ray emission as the main source of He II ionization in low metallicity galaxies (e.g., Schaerer et al. 2019; Oskinova et al. 2019; Simmonds et al. 2021; Oskinova & Schaerer 2022; Lehmer et al. 2022). Using binary stellar evolution simulations (Fragos et al. 2013a,b), Schaerer et al. (2019) modeled the expected relationship between the He II/Hβ ratio and EWHβ, incorporating the contributions of XRBs associated with the parent SPs. The SFGs analyzed in this study (Figure 6) align well with these models, exhibiting He II/Hβ ratios significantly higher than those predicted by the Xiao et al. (2018) binary evolution models (BPASS; Eldridge et al. 2017), which do not account for XRB contributions. Additionally, our analysis demonstrates that the correlation between X-ray and He II luminosities extends to SFGs with higher, near-solar metallicities. These galaxies show He II/Hβ ratios and EWHβ values consistent with the higher-metallicity models presented in Schaerer et al. (2019).
Moreover, this work shows that the LHe II–LX correlation holds regardless of the class of the galaxies and extends to AGNs which show on average higher luminosities than SFGs. The separate fits for the AGNs and SFGs overlap suggesting a common He II excitation mechanism regardless if the X-ray source is a central super-massive BH or XRBs scattered throughout the host galaxies.
6. Conclusions
Summarizing the results of this work, we crossmatched the CSC with the SB12 and MPA-JHU catalogs to examine the relation of He II and X-ray emission in galaxies. We analyzed 165 galaxies well detected in X-rays by Chandra and He II by SDSS, and 2399 galaxies with He II emission matched with the MPA-JHU catalog regardless if they have X-ray observations.
Regarding the X-ray and He II emitting galaxies:
-
BPT SFGs classified as AGNs by SB12 show high metallicities, indicating evolved and passive host galaxies contradicting their strong He II/Hβ ratio. Additionally, these sources show high-velocity dispersions and excess X-ray emission compared to what is expected by their SFR. Most of them also show broadened Balmer lines compared to the forbidden ones and are considered NLS1s in this work.
-
On average, our sample’s SFGs show a softer X-ray spectrum compared to NLS1s while the Seyfert II AGNs show the hardest. Similarly, SFGs and NLS1s show on average lower gas-phase extinction than Seyfert II AGNs. This suggests that many of our sample’s Seyfert II AGNs may display an obscured X-ray spectrum.
-
The LX/SFR of SFGs is linearly correlated with the He II/Hβ ratio. This relation holds for all X-ray energy bands provided by CSC and it shows a lower scatter than the LX/SFR–metallicity relation. Furthermore, SFGs with higher sSFR tend to fall below the best-fit LX/SFR–He II/Hβ relation, while those with slightly lower sSFR are above, suggesting a dependence on recent star-forming activity and stellar population age.
-
There is a unified tight correlation between the observed X-ray and He II luminosity that holds for both SFGs and AGNs. While the former show lower luminosities on average compared to the latter, the linear regression fits overlap indicating a similar He II excitation mechanism. This correlation remains similarly tight for about seven orders of magnitude of X-ray and He II luminosities. Based on MCMC fitting, we provide linear relations separately for the SFGs, AGNs, the total sample, and the different X-ray energy bands.
Regarding the SB12 He II galaxies regardless if they were observed in X-rays:
-
AGNs and SFGs show significant differences in the comparisons between He II/Hβ, O32 ratio, and the EWHβ. The O32 ratio of purely SFGs is tightly correlated with their EWHβ. This correlation indicates that the SFGs star-forming activity dominates the ionization of lower energy species.
-
AGNs show a higher O32 ratio but are less actively star-forming as indicated by their lower EWHβ. The O32 ratio compared to the EWHβ of AGNs is significantly higher than that of SFGs showing a large scatter and no apparent correlation. This could be attributed to the effect of the AGN’s ionizing radiation on the ISM of the host galaxies. We derive a line above which only AGNs of our sample are located.
-
The O32 ratio is correlated with the He II/Hβ ratio in AGNs. This indicates that the AGN’s radiation is the dominating ionization source over the host galaxies’ ISM for low and higher ionization species.
-
The O32 ratio is not correlated with the He II/Hβ ratio in SFGs. This, along with the tight correlation between the O32 ratio and EWHβ, suggests that while the lower-energy ionization is attributed to star-forming activity, high-energy species like He II require a different source of excitation. The tight correlation between X-ray and He II emission favors that the latter is excited by the higher energy but lower overall flux X-ray photons produced by X-ray binary populations.
This work suggests that X-ray emission is the main source of high-energy He II ionization in galaxies, regardless of whether the ionizing source is an AGN or a population of XRBs. Based on archival homogenized data, we provide linear fits that quantify the correlation between the X-ray and He II luminosities. However, further detailed analysis is required to examine the effects of X-ray obscuration, gas-phase extinction, and universality of the correlation. Moreover, to fully constrain the underlying physical processes, further comparisons with modeling of the photoionization of the ISM and the radiation transfer concerning X-ray and UV radiation should be performed.
Acknowledgments
The authors thank the anonymous referee for providing comments and suggestions that improved this work. The Czech Science Foundation project No. 22-22643S supported this work. This research has made use of: (a) software provided by the CSC in the application packages DS9; (b) the NASA/IPAC Extragalactic Database (NED), which is operated by the Jet Propulsion Laboratory (JPL), California Institute of Technology, under contract with NASA; (c) the NASA/IPAC Infrared Science Archive (IRSA), which is funded by NASA and operated by the California Institute of Technology; Funding for the SDSS and SDSS-II has been provided by the Alfred P. Sloan Foundation, the Participating Institutions, the National Science Foundation, the U.S. Department of Energy, the National Aeronautics and Space Administration, the Japanese Monbukagakusho, the Max Planck Society, and the Higher Education Funding Council for England. The SDSS Web Site is http://www.sdss.org/. The SDSS is managed by the Astrophysical Research Consortium for the Participating Institutions. The Participating Institutions are the American Museum of Natural History, Astrophysical Institute Potsdam, University of Basel, University of Cambridge, Case Western Reserve University, University of Chicago, Drexel University, Fermilab, the Institute for Advanced Study, the Japan Participation Group, Johns Hopkins University, the Joint Institute for Nuclear Astrophysics, the Kavli Institute for Particle Astrophysics and Cosmology, the Korean Scientist Group, the Chinese Academy of Sciences (LAMOST), Los Alamos National Laboratory, the Max-Planck-Institute for Astronomy (MPIA), the Max-Planck-Institute for Astrophysics (MPA), New Mexico State University, Ohio State University, University of Pittsburgh, University of Portsmouth, Princeton University, the United States Naval Observatory, and the University of Washington. This research made use of the Digitized Sky Surveys (DSS). The Digitized Sky Surveys were produced at the Space Telescope Science Institute under U.S. Government grant NAG W-2166. The images of these surveys are based on photographic data obtained using the Oschin Schmidt Telescope on Palomar Mountain and the UK Schmidt Telescope. The plates were processed into the present compressed digital form with the permission of these institutions. The National Geographic Society – Palomar Observatory Sky Atlas (POSS-I) was made by the California Institute of Technology with grants from the National Geographic Society. The Second Palomar Observatory Sky Survey (POSS-II) was made by the California Institute of Technology with funds from the National Science Foundation, the National Geographic Society, the Sloan Foundation, the Samuel Oschin Foundation, and the Eastman Kodak Corporation. The Oschin Schmidt Telescope is operated by the California Institute of Technology and Palomar Observatory. The UK Schmidt Telescope was operated by the Royal Observatory Edinburgh, with funding from the UK Science and Engineering Research Council (later the UK Particle Physics and Astronomy Research Council), until 1988 June, and thereafter by the Anglo-Australian Observatory. The blue plates of the southern Sky Atlas and its Equatorial Extension (together known as the SERC-J), as well as the Equatorial Red (ER), and the Second Epoch [red] Survey (SES) were all taken with the UK Schmidt. All data are subject to the copyright given in the copyright summary. Copyright information specific to individual plates is provided in the downloaded FITS headers. Supplemental funding for sky-survey work at the ST ScI is provided by the European Southern Observatory. This research has made use of TOPCAT (Taylor 2005).
References
- Adamcová, B., Svoboda, J., Kyritsis, E., et al. 2024, A&A, 691, A27 [NASA ADS] [CrossRef] [EDP Sciences] [Google Scholar]
- Antoniou, V., Zezas, A., Hatzidimitriou, D., & Kalogera, V. 2010, ApJ, 716, L140 [NASA ADS] [CrossRef] [Google Scholar]
- Antoniou, V., Zezas, A., Drake, J. J., et al. 2019, ApJ, 887, 20 [NASA ADS] [CrossRef] [Google Scholar]
- Antonucci, R. 1993, ARA&A, 31, 473 [Google Scholar]
- Baldwin, J. A., Phillips, M. M., & Terlevich, R. 1981, PASP, 93, 5 [Google Scholar]
- Belfiore, F., Maiolino, R., Bundy, K., et al. 2018, MNRAS, 477, 3014 [Google Scholar]
- Berg, D. A., Chisholm, J., Erb, D. K., et al. 2021, ApJ, 922, 170 [CrossRef] [Google Scholar]
- Boroson, B., Kim, D.-W., & Fabbiano, G. 2011, ApJ, 729, 12 [NASA ADS] [CrossRef] [Google Scholar]
- Brinchmann, J., Charlot, S., White, S. D. M., et al. 2004, MNRAS, 351, 1151 [Google Scholar]
- Brorby, M., Kaaret, P., Prestwich, A., & Mirabel, I. F. 2016, MNRAS, 457, 4081 [NASA ADS] [CrossRef] [Google Scholar]
- Buat, V., Boselli, A., Gavazzi, G., & Bonfanti, C. 2002, A&A, 383, 801 [NASA ADS] [CrossRef] [EDP Sciences] [Google Scholar]
- Calzetti, D., Armus, L., Bohlin, R. C., et al. 2000, ApJ, 533, 682 [NASA ADS] [CrossRef] [Google Scholar]
- Cardamone, C., Schawinski, K., Sarzi, M., et al. 2009, MNRAS, 399, 1191 [NASA ADS] [CrossRef] [Google Scholar]
- Cassata, P., Le Fèvre, O., Charlot, S., et al. 2013, A&A, 556, A68 [NASA ADS] [CrossRef] [EDP Sciences] [Google Scholar]
- Chabrier, G. 2003, PASP, 115, 763 [Google Scholar]
- Civano, F., Elvis, M., Brusa, M., et al. 2012, ApJS, 201, 30 [Google Scholar]
- Crowther, P. A., Caballero-Nieves, S. M., Bostroem, K. A., et al. 2016, MNRAS, 458, 624 [Google Scholar]
- Douna, V. M., Pellizza, L. J., Mirabel, I. F., & Pedrosa, S. E. 2015, A&A, 579, A44 [NASA ADS] [CrossRef] [EDP Sciences] [Google Scholar]
- Eldridge, J. J., Stanway, E. R., Xiao, L., et al. 2017, PASA, 34 [Google Scholar]
- Evans, I. N., Primini, F. A., Glotfelty, K. J., et al. 2010, ApJS, 189, 37 [NASA ADS] [CrossRef] [Google Scholar]
- Evans, I. N., Evans, J. D., Martínez-Galarza, J. R., et al. 2024, ApJS, 274, 22 [NASA ADS] [CrossRef] [Google Scholar]
- Ferland, G. J., Korista, K. T., Verner, D. A., et al. 1998, Publications of the Astronomical Society of the Pacific, 110, 761 [Google Scholar]
- Foreman-Mackey, D., Hogg, D. W., Lang, D., & Goodman, J. 2013, PASP, 125, 306 [Google Scholar]
- Fornasini, F. M., Civano, F., Fabbiano, G., et al. 2018, ApJ, 865, 43 [NASA ADS] [CrossRef] [Google Scholar]
- Fornasini, F. M., Civano, F., & Suh, H. 2020, MNRAS, 495, 771 [NASA ADS] [CrossRef] [Google Scholar]
- Fragos, T., Lehmer, B., Tremmel, M., et al. 2013a, ApJ, 764, 41 [NASA ADS] [CrossRef] [Google Scholar]
- Fragos, T., Lehmer, B. D., Naoz, S., Zezas, A., & Basu-Zych, A. 2013b, ApJ, 776, L31 [CrossRef] [Google Scholar]
- Gallazzi, A., Charlot, S., Brinchmann, J., White, S. D. M., & Tremonti, C. A. 2005, MNRAS, 362, 41 [Google Scholar]
- Garnett, D. R., Kennicutt, R. C., Jr, Chu, Y.-H., & Skillman, E. D. 1991, ApJ, 373, 458 [NASA ADS] [CrossRef] [Google Scholar]
- Garofali, K., Basu-Zych, A. R., Johnson, B. D., et al. 2024, ApJ, 960, 13 [NASA ADS] [CrossRef] [Google Scholar]
- Gilbertson, W., Lehmer, B. D., Doore, K., et al. 2022, ApJ, 926, 28 [NASA ADS] [CrossRef] [Google Scholar]
- Gilfanov, M., Grimm, H. J., & Sunyaev, R. 2004, MNRAS, 347, L57 [NASA ADS] [CrossRef] [Google Scholar]
- Götberg, Y., de Mink, S. E., Groh, J. H., Leitherer, C., & Norman, C. 2019, A&A, 629, A134 [NASA ADS] [CrossRef] [EDP Sciences] [Google Scholar]
- Haardt, F., & Madau, P. 1996, ApJ, 461, 20 [Google Scholar]
- Hasinger, G. 2008, A&A, 490, 905 [NASA ADS] [CrossRef] [EDP Sciences] [Google Scholar]
- Izotov, Y. I., Guseva, N. G., & Thuan, T. X. 2011, ApJ, 728, 161 [NASA ADS] [CrossRef] [Google Scholar]
- Jaskot, A. E., & Oey, M. S. 2013, ApJ, 766, 91 [Google Scholar]
- Kaaret, P., Ward, M. J., & Zezas, A. 2004, MNRAS, 351, L83 [NASA ADS] [CrossRef] [Google Scholar]
- Kauffmann, G., Heckman, T. M., Tremonti, C., et al. 2003, MNRAS, 346, 1055 [Google Scholar]
- Kehrig, C., Vílchez, J. M., Guerrero, M. A., et al. 2018, MNRAS, 480, 1081 [NASA ADS] [Google Scholar]
- Kennicutt, R. C., Jr 1998, ARA&A, 36, 189 [NASA ADS] [CrossRef] [Google Scholar]
- Kewley, L. J., & Dopita, M. A. 2002, ApJS, 142, 35 [Google Scholar]
- Kewley, L. J., Dopita, M. A., Sutherland, R. S., Heisler, C. A., & Trevena, J. 2001, ApJ, 556, 121 [Google Scholar]
- Khachikian, E. Y., & Weedman, D. W. 1974, ApJ, 192, 581 [NASA ADS] [CrossRef] [Google Scholar]
- Kouroumpatzakis, K., Zezas, A., Sell, P., et al. 2020, MNRAS, 494, 5967 [NASA ADS] [CrossRef] [Google Scholar]
- Kouroumpatzakis, K., Zezas, A., Maragkoudakis, A., et al. 2021, MNRAS, 506, 3079 [NASA ADS] [CrossRef] [Google Scholar]
- Kouroumpatzakis, K., Svoboda, J., Zezas, A., et al. 2024, A&A, 688, A159 [NASA ADS] [CrossRef] [EDP Sciences] [Google Scholar]
- Kovlakas, K., Zezas, A., Andrews, J. J., et al. 2021, MNRAS, 506, 1896 [NASA ADS] [CrossRef] [Google Scholar]
- Kroupa, P. 2001, MNRAS, 322, 231 [NASA ADS] [CrossRef] [Google Scholar]
- Kyritsis, E., Zezas, A., Haberl, F., et al. 2025, A&A, 694, A128 [NASA ADS] [CrossRef] [EDP Sciences] [Google Scholar]
- Lehmer, B. D., Eufrasio, R. T., Basu-Zych, A., et al. 2021, ApJ, 907, 17 [NASA ADS] [CrossRef] [Google Scholar]
- Lehmer, B. D., Eufrasio, R. T., Basu-Zych, A., et al. 2022, ApJ, 930, 135 [NASA ADS] [CrossRef] [Google Scholar]
- Lehmer, B. D., Monson, E. B., Eufrasio, R. T., et al. 2024, ApJ, 977, 189 [NASA ADS] [CrossRef] [Google Scholar]
- Madau, P., & Dickinson, M. 2014, ARA&A, 52, 415 [Google Scholar]
- Madau, P., & Fragos, T. 2017, ApJ, 840, 39 [Google Scholar]
- Maeder, A. 1991, A&A, 242, 93 [NASA ADS] [Google Scholar]
- Maeder, A., Lequeux, J., & Azzopardi, M. 1980, A&A, 90, L17 [NASA ADS] [Google Scholar]
- Maiolino, R., Übler, H., Perna, M., et al. 2024, A&A, 687, A67 [NASA ADS] [CrossRef] [EDP Sciences] [Google Scholar]
- Masegosa, J., Moles, M., & del Olmo, A. 1991, A&A, 244, 273 [NASA ADS] [Google Scholar]
- Mathur, S. 2000, MNRAS, 314, L17 [NASA ADS] [CrossRef] [Google Scholar]
- Meynet, G. 1995, A&A, 298, 767 [NASA ADS] [Google Scholar]
- Mineo, S., Gilfanov, M., Lehmer, B. D., Morrison, G. E., & Sunyaev, R. 2014, MNRAS, 437, 1698 [NASA ADS] [CrossRef] [Google Scholar]
- Mineo, S., Gilfanov, M., & Sunyaev, R. 2012, MNRAS, 426, 1870 [NASA ADS] [CrossRef] [Google Scholar]
- Nakajima, K., & Ouchi, M. 2014, MNRAS, 442, 900 [Google Scholar]
- Nanayakkara, T., Brinchmann, J., Boogaard, L., et al. 2019, A&A, 624, A89 [NASA ADS] [CrossRef] [EDP Sciences] [Google Scholar]
- Olivier, G. M., Berg, D. A., Chisholm, J., et al. 2022, ApJ, 938, 16 [NASA ADS] [CrossRef] [Google Scholar]
- Oskinova, L. M., & Schaerer, D. 2022, A&A, 661, A67 [NASA ADS] [CrossRef] [EDP Sciences] [Google Scholar]
- Oskinova, L. M., Bik, A., Mas-Hesse, J. M., et al. 2019, A&A, 627, A63 [NASA ADS] [CrossRef] [EDP Sciences] [Google Scholar]
- Osterbrock, D. E., & Pogge, R. W. 1985, ApJ, 297, 166 [Google Scholar]
- Pakull, M. W., & Angebault, L. P. 1986, Nature, 322, 511 [NASA ADS] [CrossRef] [Google Scholar]
- Parnovsky, S. L., Izotova, I. Y., & Izotov, Y. I. 2013, Ap&SS, 343, 361 [NASA ADS] [CrossRef] [Google Scholar]
- Planck Collaboration XIII. 2016, A&A, 594, A13 [NASA ADS] [CrossRef] [EDP Sciences] [Google Scholar]
- Plat, A., Charlot, S., Bruzual, G., et al. 2019, MNRAS, 490, 978 [Google Scholar]
- Popesso, P., Concas, A., Morselli, L., et al. 2019, MNRAS, 483, 3213 [Google Scholar]
- Prestwich, A. H., Tsantaki, M., Zezas, A., et al. 2013, ApJ, 769, 92 [NASA ADS] [CrossRef] [Google Scholar]
- Reines, A. E., & Volonteri, M. 2015, ApJ, 813, 82 [NASA ADS] [CrossRef] [Google Scholar]
- Reines, A. E., Greene, J. E., & Geha, M. 2013, ApJ, 775, 116 [Google Scholar]
- Rublev, S. V. 1964, Sov. Astron., 8, 172 [Google Scholar]
- Salim, S., Rich, R. M., Charlot, S., et al. 2007, ApJS, 173, 267 [NASA ADS] [CrossRef] [Google Scholar]
- Salpeter, E. E. 1955, ApJ, 121, 161 [Google Scholar]
- Sanders, R. L., Shapley, A. E., Kriek, M., et al. 2016, ApJ, 816, 23 [Google Scholar]
- Satyapal, S., Sambruna, R. M., & Dudik, R. P. 2004, A&A, 414, 825 [NASA ADS] [CrossRef] [EDP Sciences] [Google Scholar]
- Saxena, A., Pentericci, L., Mirabelli, M., et al. 2020a, A&A, 636, A47 [NASA ADS] [CrossRef] [EDP Sciences] [Google Scholar]
- Saxena, A., Pentericci, L., Schaerer, D., et al. 2020b, MNRAS, 496, 3796 [Google Scholar]
- Schaerer, D. 1996, ApJ, 467, L17 [NASA ADS] [CrossRef] [Google Scholar]
- Schaerer, D., Fragos, T., & Izotov, Y. I. 2019, A&A, 622, L10 [NASA ADS] [CrossRef] [EDP Sciences] [Google Scholar]
- Schmutz, W., Hamann, W. R., & Wessolowski, U. 1989, A&A, 210, 236 [Google Scholar]
- Scott, D. W. 1979, Biometrika, 66, 605 [CrossRef] [Google Scholar]
- Senchyna, P., Stark, D. P., Vidal-García, A., et al. 2017, MNRAS, 472, 2608 [NASA ADS] [CrossRef] [Google Scholar]
- Senchyna, P., Stark, D. P., Mirocha, J., et al. 2020, MNRAS, 494, 941 [CrossRef] [Google Scholar]
- Shappee, B. J., Prieto, J. L., Grupe, D., et al. 2014, ApJ, 788, 48 [Google Scholar]
- Shim, H., & Chary, R.-R. 2013, ApJ, 765, 26 [NASA ADS] [CrossRef] [Google Scholar]
- Shirazi, M., & Brinchmann, J. 2012, MNRAS, 421, 1043 [NASA ADS] [CrossRef] [Google Scholar]
- Shtykovskiy, P. E., & Gilfanov, M. R. 2007, Astronomy Letters, 33, 437 [NASA ADS] [CrossRef] [Google Scholar]
- Simmonds, C., Schaerer, D., & Verhamme, A. 2021, A&A, 656, A127 [NASA ADS] [CrossRef] [EDP Sciences] [Google Scholar]
- Stanway, E. R., & Eldridge, J. J. 2019, A&A, 621, A105 [NASA ADS] [CrossRef] [EDP Sciences] [Google Scholar]
- Stasińska, G., Izotov, Y., Morisset, C., & Guseva, N. 2015, A&A, 576, A83 [NASA ADS] [CrossRef] [EDP Sciences] [Google Scholar]
- Szécsi, D., Langer, N., Yoon, S.-C., et al. 2015, A&A, 581, A15 [NASA ADS] [CrossRef] [EDP Sciences] [Google Scholar]
- Taylor, M. B. 2005, in Astronomical Data Analysis Software and Systems XIV, eds. P. Shopbell, M. Britton, & R. Ebert, ASP Conf. Ser., 347, 29 [Google Scholar]
- Tremonti, C. A., Heckman, T. M., Kauffmann, G., et al. 2004, ApJ, 613, 898 [Google Scholar]
- Triani, D. P., Di Stefano, R., & Kewley, L. J. 2024, ArXiv e-prints [arXiv:2405.08121] [Google Scholar]
- Umeda, H., Ouchi, M., Nakajima, K., et al. 2022, ApJ, 930, 37 [NASA ADS] [CrossRef] [Google Scholar]
- Veilleux, S., & Osterbrock, D. E. 1987, ApJS, 63, 295 [Google Scholar]
- Virtanen, P., Gommers, R., Oliphant, T. E., et al. 2020, Nature Methods, 17, 261 [CrossRef] [Google Scholar]
- Vladutescu-Zopp, S., Biffi, V., & Dolag, K. 2023, A&A, 669, A34 [NASA ADS] [CrossRef] [EDP Sciences] [Google Scholar]
- Vladutescu-Zopp, S., Biffi, V., & Dolag, K. 2025, A&A, 695, A2 [NASA ADS] [CrossRef] [EDP Sciences] [Google Scholar]
- Vulic, N., Hornschemeier, A. E., Haberl, F., et al. 2022, A&A, 661, A16 [NASA ADS] [CrossRef] [EDP Sciences] [Google Scholar]
- Xiao, L., Stanway, E. R., & Eldridge, J. J. 2018, MNRAS, 477, 904 [Google Scholar]
- Yang, H., Malhotra, S., Rhoads, J. E., & Wang, J. 2017, ApJ, 847, 38 [NASA ADS] [CrossRef] [Google Scholar]
Appendix A: Optical spectra of the X-ray BPT SFGs but SB12 AGNs.
This appendix presents rest-frame optical spectra near the Hα and Hβ lines of this work’s 30 X-ray-detected sources which were classified as SFGs by BPT but as AGNs by the SB12 diagram (Section 3.1). Based on visual inspection, the spectra of 29/30 sources show broadened Balmer lines demonstrating contribution from an AGN’s BLR.
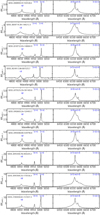 |
Fig. A.1. Optical spectra near the Hβ (left plot) and Hα (right plot) emission lines of the X-ray and He II detected BPT SFGs but SB12 AGNs (Section 3.1). |
All Tables
All Figures
|
Fig. 1. Physical relations of galaxies emitting He II with SnR > 5.5, measured and cataloged by SB12, detected in X-rays and cataloged in the CSCv2.0. In all subplots, the points are color-coded based on the galaxies’ He II/Hβ ratio. The emission-line ratios have low uncertainties which are not plotted for clarity. BPT SFGs are represented by a circle, and BPT AGNs are represented by a triangle marker. SB12 SFGs are marked with a rhombus. Top left: He II/Hβ ratio as a function of the [N II]/Hα ratio. The black curve represents the SB12 classification curve separating AGNs (top right) from SFGs (bottom left). Top right: [O III]/Hβ as a function of the [N II]/Hα ratio, aka the BPT diagram. The dashed black line shows the Kauffmann et al. (2003) classification curve above which composite galaxies and AGNs are located. Middle left: SFR as a function of M⋆, aka the main sequence of SFGs. The brown-dotted, and red dashed-dotted lines represent the Popesso et al. (2019), and Kouroumpatzakis et al. (2021) main sequence fits respectively. Middle right: LX as a function of SFR. The black dashed-dotted line represents the Mineo et al. (2014) relation. Bottom left: LX/SFR as a function of metallicity. The orange continuous, black dashed-doted, green dashed, and magenta dashed-dotted lines represent the Fragos et al. (2013b), Mineo et al. (2014), Brorby et al. (2016), and Lehmer et al. (2021) relations respectively. Bottom right: LX/SFR as a function of He II/Hβ ratio. The black dashed-dotted line represents the Mineo et al. (2014) relation. The red dashed line shows the best linear regression fit involving all sources regardless of their class. |
| In the text | |
|
Fig. 2. Same plots as the upper plots of Figure 1 but color-coded based on the galaxies’ velocity dispersion (σ) of their Balmer lines (top), and the ratio of the velocity dispersions of the Balmer and forbidden lines (bottom). |
| In the text | |
|
Fig. 3. Histograms of the hardness ratio (top), and extinction (bottom) of our sample of He II and X-ray detected sources. The black dashed, and light gray continuous lines correspond to SB12 SFGs and AGNs. The gray dotted line represents sources classified as SFGs by BPT but AGNs by the SB12 diagram (NLS1s; Section 3.1). |
| In the text | |
|
Fig. 4. LX/SFR as a function of metallicity (left column), or He II/Hβ ratio (right column) of SFGs classified by both the SB12 and BPT diagrams. The energy bands total, hard, medium, and soft appear from top to bottom respectively. All points are color-coded based on the galaxies’ sSFR. The red dashed line represents the best linear regression fit and the shaded area shows the uncertainties of the fit. The orange continuous, black dashed-doted line, green dashed, and purple dashed-dotted curves represent the Fragos et al. (2013b), Mineo et al. (2014), Brorby et al. (2016), and Lehmer et al. (2021) relations respectively. The blue dashed and the yellow dashed-dotted lines shown in the second row correspond to the Madau & Fragos (2017) and Fornasini et al. (2020) relations respectively. |
| In the text | |
|
Fig. 5. X-ray as a function of He II luminosity for different X-ray energy bands in logarithmic space. The energy bands total, soft, medium, and hard appear from top to bottom and left to right respectively. The pink triangles and blue rhombuses show AGNs and SFGs respectively as adopted by this work (Section 3.1). The black dotted, purple dashed-dotted, and blue dashed lines correspond to the best results of MCMC fits involving all sources, AGNs, and SFGs respectively. The shaded areas with the same colors correspond to the uncertainties of the respective fits. The results of the MCMC fits are presented at the top of each plot and are summarized in Table 1. |
| In the text | |
|
Fig. 6. Several comparisons of 2399 galaxies emitting He II with SnR > 5.5, measured and cataloged by SB12, and matched with the SDSS MPA-JHU catalog having S/N > 5 in all compared emission lines. SB12 SFGs and AGNs are represented by light blue rhombuses and violet triangles respectively. BPT SFGs are represented by a black cross. The X-ray-selected SFGs and AGNs (Section 3.1) are also shown with blue right-pointing and purple left-pointing triangles respectively. Top left: He II/Hβ over [N II]/Hα. The black curve represents the SB12 classification criterion separating AGN from SFGs. Top right: BPT [O III]/Hβ over [N II]/Hα diagram. The dashed black line shows the Kauffmann et al. (2003) classification criterion. Middle left: He II/Hβ as a function of EWHβ. Middle right: He II/Hβ as a function of metallicity. Bottom left: O32 as a function of EWHβ. The blue dashed line represents the best linear regression fit involving only BPT and SB12 SFGs. The black line represents a threshold above which only AGNs of our sample are located. Bottom right: He II/Hβ as a function of O32. The black dashed-dotted and blue dashed lines show the best linear regression fits involving solely SB12 AGNs or SFGs, respectively. |
| In the text | |
|
Fig. 7. Histograms of the logarithm of the Balmer lines velocity dispersion (σ) for the different classes of the agnostic-to-X-rays sample. The pink continuous and blue dashed lines show the AGNs and SFGs classified by the SB12 diagram. The SFGs based on the BPT diagram are presented with a black dashed-dotted line while the red dotted line shows those classified as SFGs by the BPT but as AGNs by the SB12 diagram. |
| In the text | |
|
Fig. A.1. Optical spectra near the Hβ (left plot) and Hα (right plot) emission lines of the X-ray and He II detected BPT SFGs but SB12 AGNs (Section 3.1). |
| In the text | |
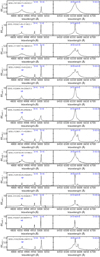 |
Fig. A.2. Continuation of Figure A.1 |
| In the text | |
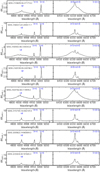 |
Fig. A.3. Continuation of Figure A.2 |
| In the text | |
Current usage metrics show cumulative count of Article Views (full-text article views including HTML views, PDF and ePub downloads, according to the available data) and Abstracts Views on Vision4Press platform.
Data correspond to usage on the plateform after 2015. The current usage metrics is available 48-96 hours after online publication and is updated daily on week days.
Initial download of the metrics may take a while.