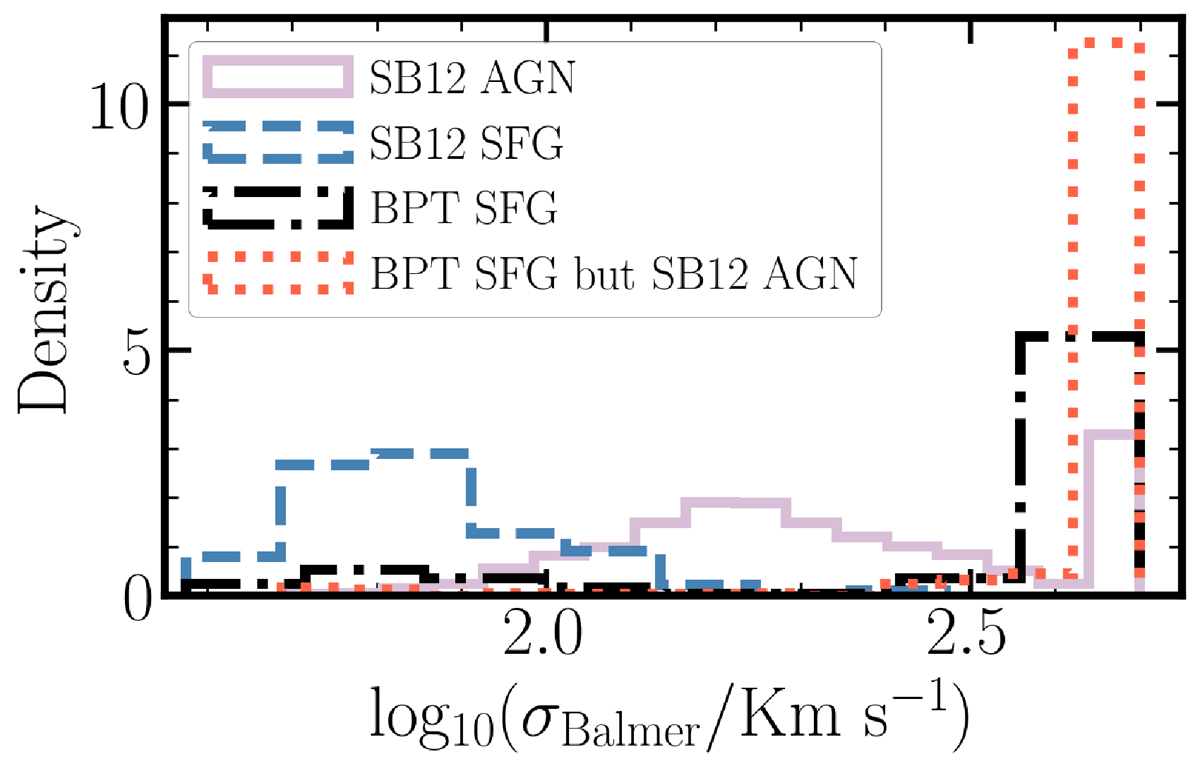
Fig. 7.
Download original image
Histograms of the logarithm of the Balmer lines velocity dispersion (σ) for the different classes of the agnostic-to-X-rays sample. The pink continuous and blue dashed lines show the AGNs and SFGs classified by the SB12 diagram. The SFGs based on the BPT diagram are presented with a black dashed-dotted line while the red dotted line shows those classified as SFGs by the BPT but as AGNs by the SB12 diagram.
Current usage metrics show cumulative count of Article Views (full-text article views including HTML views, PDF and ePub downloads, according to the available data) and Abstracts Views on Vision4Press platform.
Data correspond to usage on the plateform after 2015. The current usage metrics is available 48-96 hours after online publication and is updated daily on week days.
Initial download of the metrics may take a while.